TheStrat TFC Monitor
- Indicadores
- Robert Gerald Wood
- Versión: 1.5
- Actualizado: 23 noviembre 2023
- Activaciones: 10
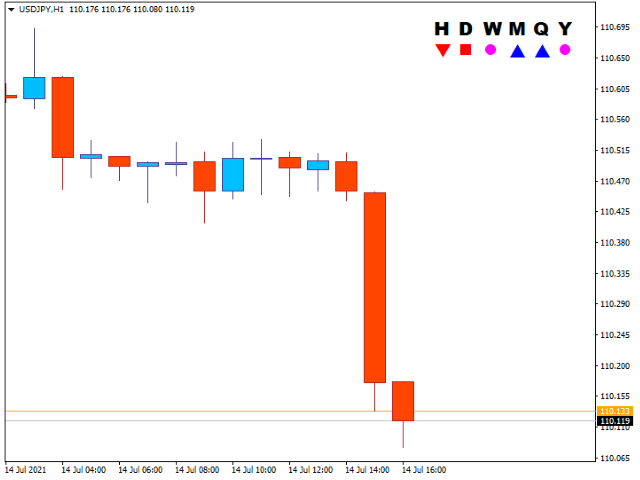
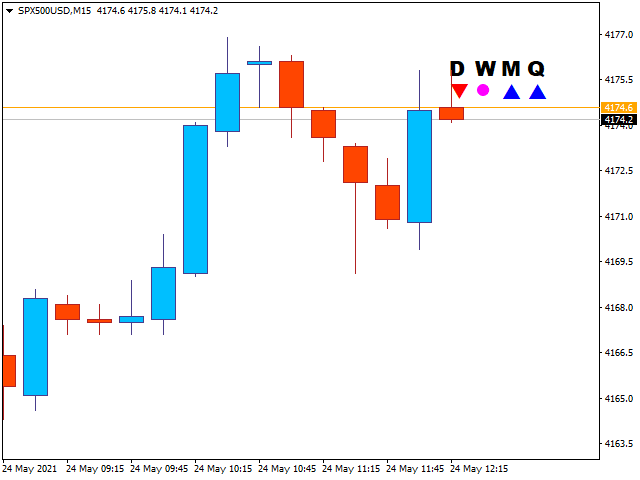
Al operar con The Strat , es importante estar atento a múltiples marcos de tiempo.
Este indicador mostrará el estado diario, semanal, mensual y trimestral de la vela actual para cada período de tiempo.
- Un icono de círculo muestra que la vela en ese período de tiempo es actualmente un Interior, o Tipo 1 en la terminología de TheStrat. Una vela Inside Day está consolidando la acción del precio y estamos buscando una ruptura del rango.
- Un ícono de Triángulo, apuntando hacia arriba o hacia abajo, es una vela de tendencia, o Tipo 2 en la terminología de TheStrat. Una vela con tendencia puede ser alcista o bajista, lo que indica que se ha salido del rango de velas anterior y ahora tiene una tendencia en una dirección.
- Un icono cuadrado es una vela exterior o tipo 3 en la terminología de The Strat. Esto indica dos cosas, una que el precio está indeciso sobre la dirección en ese período de tiempo, y probablemente bastante entrecortado, y dos, que en períodos de tiempo más bajos es probable que haya buenas oportunidades para negociar reversiones cortas. El cuadrado será de color alcista o bajista para mostrar qué lado está ganando actualmente.
Los colores utilizados para cada ícono se pueden configurar a tu gusto, y el tamaño del texto y los íconos también son configurables.
AJUSTES
Selecciones de marco de tiempo
Mostrar por hora
Cuando es verdadero, muestra el estado de la vela por hora.
ShowDaily
Cuando es Verdadero, muestra el estado diario de las velas.
ShowWeekly
Cuando es Verdadero, muestra el estado de la vela semanal.
MostrarMensual
Cuando es verdadero, muestra el estado de la vela mensual.
Mostrar Trimestral
Cuando es verdadero, muestra el estado de la vela trimestral.
ShowAnual
Cuando es verdadero, muestra el estado de la vela anual.
Formato de visualización
InteriorFuenteColor
El color a usar cuando se dibuja dentro (Tipo 1) de velas.
AlcistaFuenteColor
El color a usar cuando se dibujan velas con tendencia alcista (Tipo 2) o Velas externas (Tipo 3).
BearishFuenteColor
El color a usar cuando se dibujan velas con tendencia alcista (Tipo 2) o Velas externas (Tipo 3).
HeaderFontName
La fuente que se utilizará para los encabezados de los iconos de estado de las velas.
Tamaño de fuente
El tamaño de fuente a utilizar para los títulos. Esto también controla el tamaño total de la pantalla del indicador.