BazeZone MT4
- Indicadores
- Stefan Van Dockum
- Versión: 1.0
- Activaciones: 5
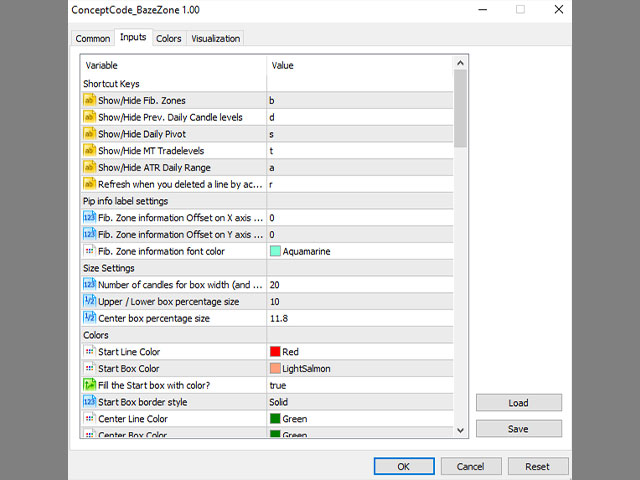
Baze Zone is a configurable combination of tools/levels (MT5 version also available at MT5 section) :
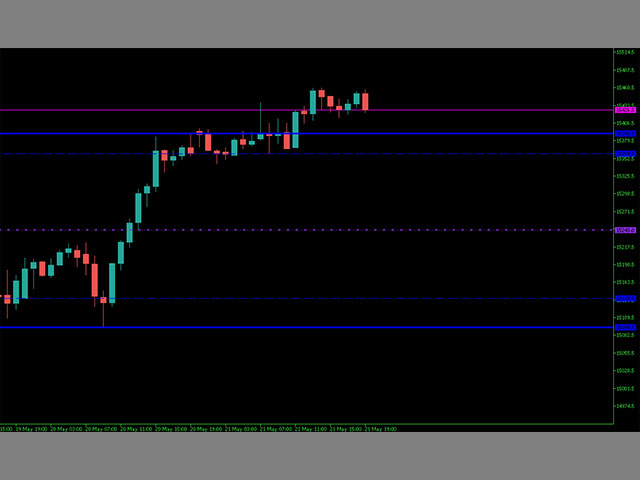
- Fib levels, 14, 23,50
- Fib Extension 27,61
- Pivot Points
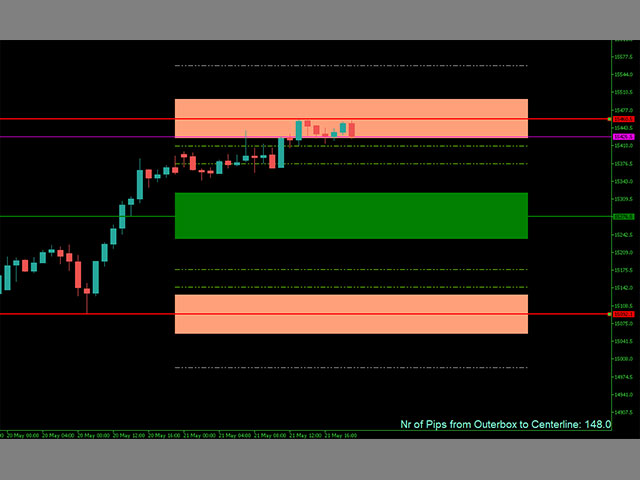
- Adds boxes to indicate range 'breakout'
- ATR Range
- Prev Daily Candle Range
- Shortcut keys to hide/show the lines (configurable)
In short, use this tool to add some extra zones to you fib tool. And use the extra's in combination with the shortcut keys to keep your chart clean.
You can drag the lines for the Fib Levels.
The name of the tool comes from one of the character of your favorite SciFi movies.. and also refers to some 'base'/fundamental levels.