Blended Candle Strength
- Indicadores
- Eduardo Bortolotte
- Versión: 1.0
- Activaciones: 5
Blended Candle Strength PRO (BCS)
Any trading strategy, whether it is a continuation, trend reversal or breakout requires, in addition to analyzing the context of the price movement, confirmation signals for both trading entry and exit. And for that, it is necessary to analyze the formats of the candlesticks and fit them in known patterns to assist decision making.
In addition to the context and format, two other important information to determine the strength of candlesticks are the size of the bar, indicating the range in which the price varied, and the volume, indicating the number of transactions in each period.
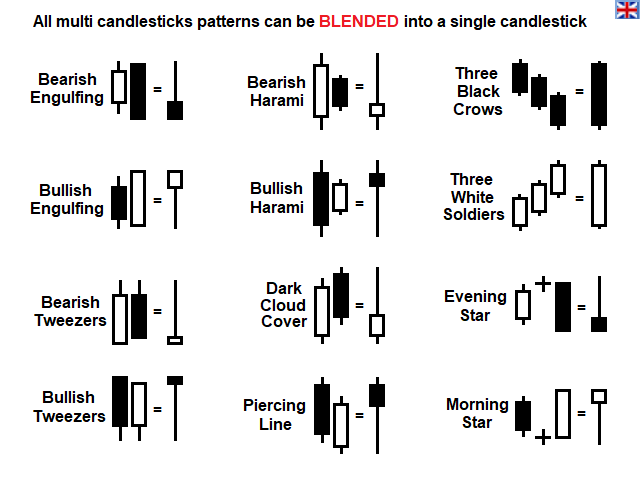
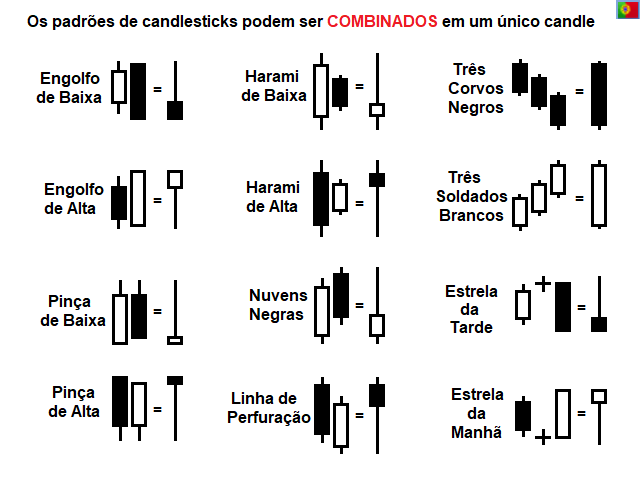
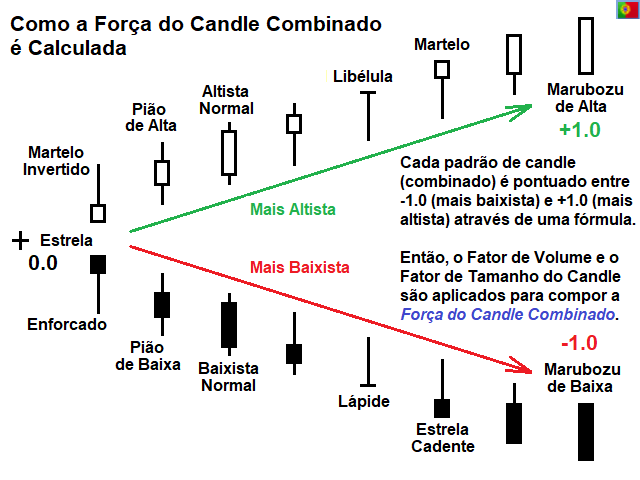
Another very important concept for the analysis of candlestick patterns is Blended Candles, which attests to the fact that patterns of 2, 3 or more candles can be converted into single candles for simplified reading and analysis. Attached is a diagram with 12 examples of converting these patterns from multiple to single candles.
Uniting all the exposed for the assessment of candlesticks, the Blended Candle Strength (BCS) indicator was created, associating pattern, size and volume of candlesticks and also the possibility of analyzing them combined (blended), all unified in one numerical value representing the strength of the bars for trading signals confirmation.
How it is calculated
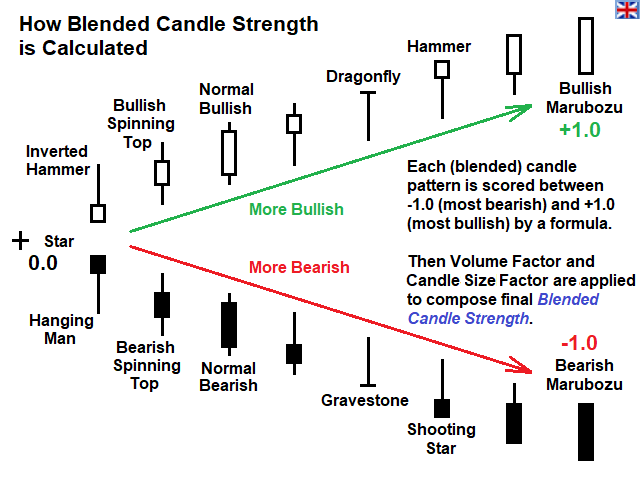
- Candle pattern score: by open, high, low and close values, the pattern of each candle is identified through a formula that punctuates them between -1.0, for Bearish Marubozu — the most bearish pattern — and +1.0, the Bullish Marobozu — the most bullish one — passing through Star (value 0.0) and all the intermediate possibilities, as shown in the attached diagram.
- Volume Factor: candlestick transactions volume (in ticks or real) divided by the average of the N previous candlesticks volumes.
- Candle Size Factor: candle size (with or without the "shadows") divided by the average of the N previous candles sizes.
Inputs
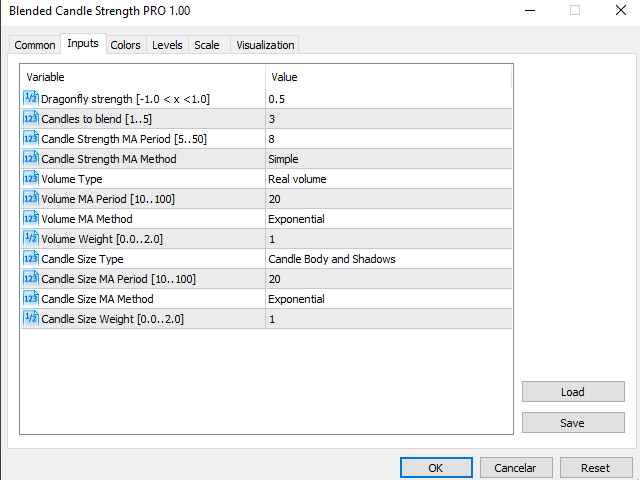
This PRO version allows you to individually adjust the methods and periods of the average strength, volume and size of the candles, in addition to the weights of the Volume Factor and the Candle Size Factor, the number of candles to be blended (from 1 to 5) and also the possibility to modify the reference value for the Dragonfly pattern strength (0.5, by default), totaling 12 parameters, as shown in the attached screenshot.
Alternatively, consider the FREE Blended Candle Strength version, with fewer features.
Outputs
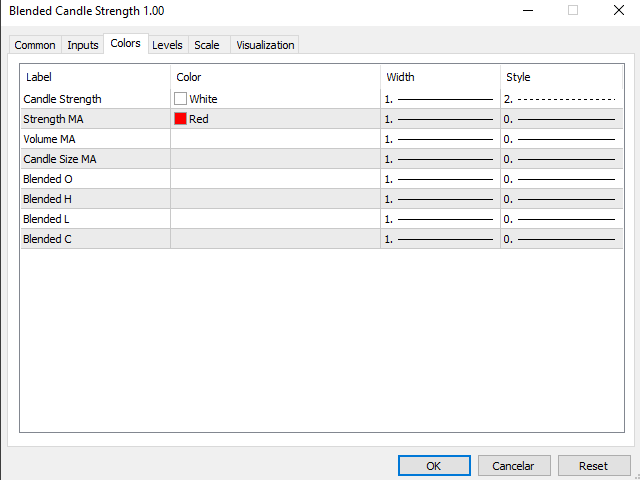
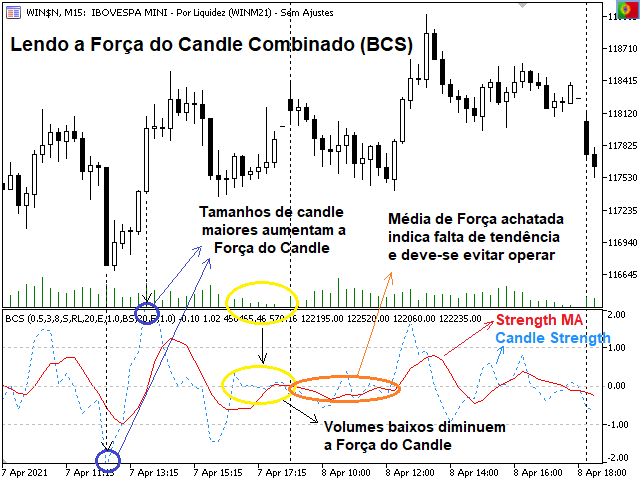
As the indicator shows relative values, the lines are plotted in a separate window and includes reference levels -1.0 and +1.0. As shown in the attached screenshot, the indicator has 8 output buffers, 2 of which visual with customizable colors and styles.
Visual buffers (plotted in a separate window on the graph):
- Candle Strength: main BCS value, which can go beyond the -1.0 and +1.0 limits depending on the values of Volume Factor and Candle Size Factor.
- Strength MA: average of previous BCS.
Numeric buffers (shown in MetaTrader Data Window, Ctrl+D)
- Volume MA : average of previous volumes.
- Candle Size MA: average of the sizes of the previous candles.
- Blended O/H/L/C (4): open, high, low and close Blended Candles values .
Interpretation
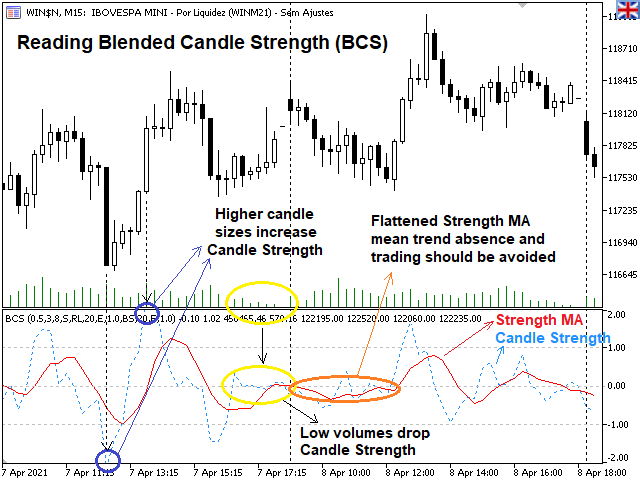
The immediate reading of the BCS is that the farther the value is from the 0.0 level, the greater the strength of the candlesticks, either to enter long (positive BCS) or short (negative BCS).
By analogy, the closer to the central level 0.0 (zero), the lower the candlestick's strength, so trading in these regions would better be avoided and opened positions be closed, due to the lack of trend confirmation and the weakening of the previous trend.
As the strongest pattern, the Marubozu, is valued 1.0 (in absolute), values beyond -1.0 and +1.0 levels indicate great strength, because in addition to a strong candle pattern, there is also volume and/or candle size above averages.
