• Información general
  • Comentarios (1)
  • Discusión (2)
  • Novedades

TheStrat Levels MT5

5

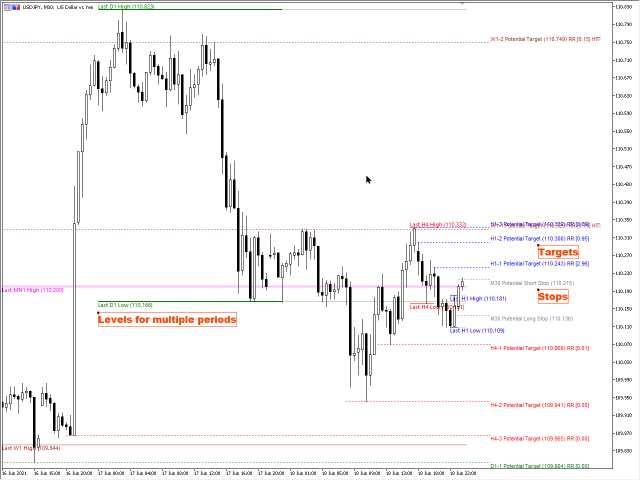
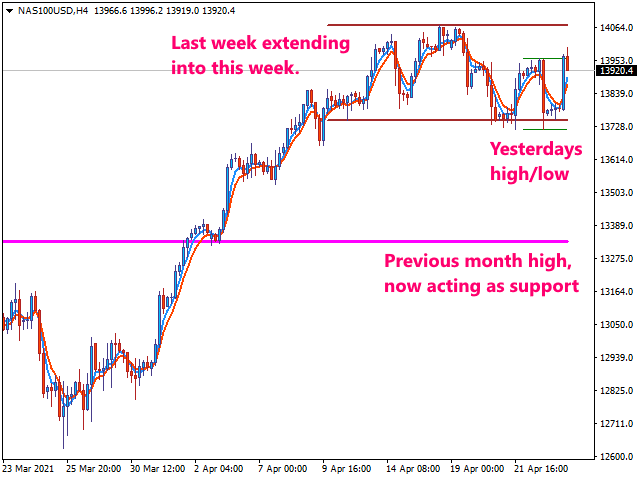
This indicator draws the prior Highs and Lows for multiple timeframes, and can display potential Take Profit and Stop Loss levels.

In Rob Smith's #The Strat terms, these are potential entry points, or alternatively potential targets for open positions. I like to use them in both ways. On a lower timeframe, say 5 minutes to get a good entry on a daily or weekly level, and then as a potential target. Very small stops required giving an excellent risk/reward ratio.

Key Features

 - Levels from Hourly, Four Hourly, Daily, Weekly and Monthly timeframes
 - Potential Take Profit levels
 - Potential Stop Loss levels based on the current or higher timeframe
 - Risk / Reward calculated continuously for each potential target level based on potential stop level
 - Pivot Machine Gun identification
 - Labelling for each level so you can identify what there
 - Comprehensive options to make it look as you wish

    Please watch the DEMO video for more details as the pictures do not do the indicator justice.


    Settings

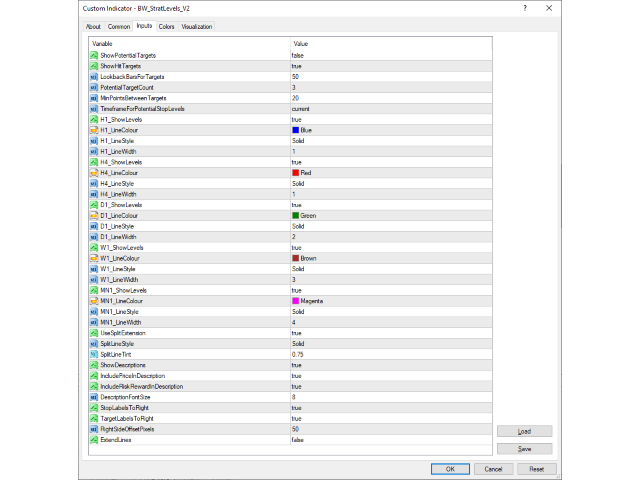
    There are a number of settings, repeated for each timeframe.

    ShowLevels

    When true, the levels are drawn for this timeframe. The lines are drawn from the last period start to the current time. Once a new period is started, the lines will be redrawn to the new levels.

    LineColour

    You can set the line colour to any value from the standard colour selection.

    LineStyle

    The line style can vary from the simple solid line, dots, dashes or dots and dashes.

    LineWidth

    If the line style is solid, the line width can be any value from the selection available, 1 to 5.


    UseSplitExtension

    When set to True, the lines drawn are split into the historic part drawn using the line styles, width and colours above, and the projected part using a modified style based on the following settings.

    SplitLineStyle

    If you wish you can set the line style so it is clearly visibly different to the historic part of the line. If you set it to STYLE_SOLID, then the projected line will retain the width set above.

    SplitLineTint

    You can modify the colour of the projected line by giving it a tint. That is a reduction in intensity of the main colour selected for the historic line set above. The default value here is 0.5 which means halve the intensity of the colour.


    Stop and Target Levels

    ShowPotentialTargets

    When true, potential target levels are shown for each timeframe enabled using the ShowLevels settings.

    ShowHitTargets

    When true, if a target level has been hit it will stay on the chart until the timeframe has expired. Otherwise, once hit, potential target levels are removed.

    LookbackBarsForTargets

    Controls how far back in the history the system should look for target levels. Default is 50 bars.

    PotentialTargetCount

    This allows you to choose how many potential target levels you want to see per timeframe. Default is 3.

    MinPointsBetweenTargets

    Having targets too close together is not very helpful, so this setting allows you to define how many points should be between one target and the next. Calculated per timeframe.

    TimeframeForPotentialStopLevels

    Allows you to choose the timeframe stop loss levels should be calculated from. By default it uses the current timeframe, giving a very tight stop loss.


    Descriptive Labels

    ShowDescriptions

    When true, descriptive labels are drawn for every level shown.

    IncludePriceInDescription

    When true, puts the price value of the level in the description.

    IncludeRiskRewardInDescription

    When true, adds the risk / reward value in the description.

    DescriptionFontSize

    Choose how big the descriptive labels should be.

    StopLabelsToRight

    When true, the labels for stop levels are drawn to the right of the stop level. Set to false, the description will be drawn to the left of the level.

    TargetLabelsToRight

    When true, the labels for target levels are drawn to the right of the stop level. Set to false, the description will be drawn to the left of the level.

    RightSideOffsetPixels

    Allows you to choose how far from the current time the stop and target labels should be drawn. Only relevant if you use StopLabelsToRight or TargetLabelsToRight.


    ExtendLines

    By default, this is false. When True, the lines are extended off to the right hand side of the chart.

    Comentarios 1
    renetrader07
    135
    renetrader07 2023.11.23 18:24 
     

    This greatly helps with being more mechanical with my trading

    Productos recomendados
    Vanguard's Volatility indicator is based on the analysis of long and short price volatility. It helps to determine market entry points by displaying favorable entry points with arrows. This indicator can be used as a filter in trading or as a tool to show the exact direction of the trend. It is suitable for both scalping on small time intervals and long-term trading. It is important to remember that successful trading requires a comprehensive approach, and additional information is needed to en
    This product is designed for the MT5 platform and offers two key features: VWAP (Volume Weighted Average Price) calculation and Volume Profile analysis. Advantages: VWAP Calculation: The product calculates the VWAP, which is a popular indicator used by traders to determine the average price of a security based on its trading volume. It helps identify potential buying or selling opportunities by comparing the current price to the average price weighted by volume. Volume Profile Analysis: The prod
    Algo Map
    Kenny Michael Smith
    5 (3)
    MAPA DE ALGO CARACTERÍSTICAS - NIVELES DE ENTRADA - TOMAR NIVELES DE GANANCIAS - PUNTOS DE ENTRADA DE INVERSIÓN - ESTRATEGIA DE REVERSIÓN - ESTRATEGIA DE COMERCIO DE TENDENCIAS - COMPRAR Y VENDER SEÑALES DE SWING TRADING EN CADA PLAZO DE TIEMPO ¡EL SOFTWARE COMERCIAL #1 SUPERA CUALQUIER MERCADO CUALQUIER DÍA CON ESTE SOFTWARE MT5! ¡QUIERO PASAR EL MAPA DE ALGO DE FIRMAS DE PROP ES AMISTOSO DE FIRMA DE PROP! NUEVO EN EL COMERCIO Y QUIERE UNA ESTRATEGIA QUE FUNCIONE CON EL T
    Automatic Vwap Midas
    Ricardo Almeida Branco
    5 (1)
    The 3 Automatic Vwap (Midas) Indicator can be used for Price and Volume studyers to map the movement of market drivers. It automatically plots 3 Vwaps, two of which are dynamic and will be updated throughout the day if new highs or new lows emerge. The third Vwap is daily and can help if the trend is up or down. Also, an auxiliary indicator that plots (also dynamic) points of interest with OHLC prices (Open, High and Low of the current day and Close of the previous day) was inserted. Success and
    TickDelta
    Andrey Gladyshev
    The TickDelta indicator shows the difference in the number of oscillations of the best prices per unit of time. In this case, the unit of time is the specified timeframe (M1, M2, M5, M15, etc.). This value indirectly shows the market "sentiment". Due to the "tick-wise" nature, the indicator is more appropriate for use in scalping strategies. When applied in conjunction with real volumes and monitoring of various instrument charts, it is possible to identify certain reversal setups. In some cases
    Visual Heatmap Book Analyzer
    Alexandre Moraes De Souza Lima
    Visual Heatmap Book Analyser This indicator monitors the market liquidity and generates colors based on order patterns, quantities, and renewal activities in the book. This allows you to visualize the order flow and identify areas of high and low liquidity and activity. The indicator uses machine learning techniques to analyze the order behavior in the book, enabling it to detect patterns and trends in orders, allowing you to make informed decisions about your trading operations. The color pal
    The chaos wave
    Letlhogo Mokgatle
    This is the best indicator we have created by far, this indicator replicates the well known heiken ashi indicator,  but with a more precise entry point, this indicator can work on all time-frames and is strong on all the time frames , this indicator does not repaint nor does it lag , this indicator strategy combined with price action will change your trading experience , elevate your experience to the next level.
    Adjustable Consecutive Fractals  looks for 2 or more fractals in one direction and sends out a on screen alert, sound alert and push notification, for strong reversal points . Adjustable Consecutive Fractals, shows the fractals on chart along with a color changing text for buy and sell signals when one or more fractals appear on one side of price. Adjustable Consecutive Fractals is based Bill Williams Fractals . The standard Bill Williams fractals are set at a non adjustable 5 bars, BUT withe
    [ MT4 Version ]  [ Kill Zones ]  [ SMT Divergences ] How to trade using Order Blocks:  Click here User Interface Performance:  During testing in the strategy tester, the UI may experience lag. Rest assured, this issue is specific to the testing environment and does not affect the indicator's performance in live trading. Elevate your trading strategy with the  Order Blocks ICT Multi TF  indicator, a cutting-edge tool designed to enhance your trading decisions through advanced order block analysis
    Vwap Freeze
    Ricardo Almeida Branco
    5 (1)
    The previous day's vwap is used by some traders as a support and resistance point, after all it is one of the ways to consider the fair price of that asset or that pair the day before. Possible defenses can occur in this region indicating a reversal, or triggering stops starting a new, more directional movement. It is a matter of analyzing how it will add to your operational. To avoid manually drawing the previous day's vwaps and saving time for your analysis, use the Vwap Freeze indicator,
    Displays trends in current chart. You can display trends of multiple timeframes in one chart by inserting this indicator as often as you want. Key features: displays trend line by finding highs and lows counts number of high/low of current trend in different color (long/short) allows you to display multiple timeframe trends in one chart Settings: Indicator Name: if you want to show M5 and H1 on one chart add TITrend twice to your current chart and rename M5 to "TITrendM5" and H1 to "TITrendH1" C
    Buy Sell Visual MTF
    Naththapach Thanakulchayanan
    This MT5 indicator, Bull Bear Visual MTF (21 Time Frames), summarize the strength color graphic and percentages of power for both  Bull and Bear in current market emotion stage which will show you in multi time frames and sum of the total Bull and Bear power strength which is an important information for traders especially you can see all Bull and Bear power in visualized graphic easily, Hope it will be helpful tool for you for making a good decision in trading.
    Volume Trade Levels
    Mahmoud Sabry Mohamed Youssef
    The idea behind this indicator is very simple , First it contains 2 mechanisms to place your trades: 1- Enter the Pips you want to duplicate to price levels. 2- Automatically let the indicator specify the largest Buy / Sell Volume Candle and place duplicated levels based on the candle itself. How it works: 1- Enter the Pips you want to duplicate to price levels:    1- once the indicator is loaded you will need first to Specify the number of pips in the indicator Configuration window ,you can
    ScalperGun
    Mikhail Nazarenko
    Scalper gun  - главное оружие для торговли скальпингом и свингом, с визуализацией и алертом точек входа. Индикатор работает как в трендовых, так и в нетрендовых рыночных условиях. Подходит начинающим и опытным трейдерам.  SCALPER GUN превосходит по скорости, качеству визуализации и точности входа популярные топовые индикаторы этого сайта!!! Перед покупкой скачайте демо Scalper gun и сравните с аналогичными индикаторами для скальпинга в тестере MT4. Особенности Это готовая торговая система с виз
    VWAP Indicator MT5
    Kyra Nickaline Watson-gordon
    Description : VWAP (Volume-Weighted Average Price) is the ratio of the value traded to total volume traded over a particular time horizon. It is a measure of the average price at which pair is traded over the trading horizon. Read More. All Symbols and All Timeframes are supported. Indicator Inputs :     VWAP Mode : Mode of VWAP Calculation. Options can be selected : Single,Session,Daily,Weekly,Monthly     Volumes : Real Volumes,Tick Volumes     Price Type : Used price for cal
    Sinal IFR
    Aurenice Barros De Abreu Carvalho
    Sinal com base no indicador RSI, que indica compra marcando com uma seta verde quando o preco sai da região de sobrevendido, e sinaliza venda quando o preco sai da regiao de sobrecomprado. A sinalizacão é  feita com uma seta verde para compra e seta rosa para venda. Permite configurar o nível de sobrecompra e de sobrevenda, além do período do RSI. Funciona em qualquer período gráfico.
    Wave Box Market Frenquency
    Jean Jacques Huve Ribeiro
    4.75 (4)
    Totally linked to the result of a movement and the duration he had. Its height records how many ticks the asset walked during a given movement, its width shows us the duration that movement had. Its configuration must be in line with the Weis Wave Indicator configuration to observe the movement force and can indicate a possible accumulation or distribution of the movement;
    FREE
    Hello There, Today I want to show you my new researchable fore BUY SELL indicator, it work all asset, and also work Derive Volatility asset! it work all time frame, but i recommend start 5 minute to H1 when you receive a signal just take trade and stay wait for your take profit asset All Major Pair And minor IT WORK ALSO XAUUSD Fantastic results,  for more info,,, message us thank you   
    Limitless MT5
    Dmitriy Kashevich
    Limitless MT5 is a universal indicator suitable for every beginner and experienced trader. works on all currency pairs, cryptocurrencies, raw stocks Limitless MT5 - already configured and does not require additional configuration And now the main thing Why Limitless MT5? 1 complete lack of redrawing 2 two years of testing by the best specialists in trading 3 the accuracy of correct signals exceeds 80% 4 performed well in trading during news releases Trading rules 1 buy signa
    Novato
    Juan Manuel Rojas Perez
    5 (1)
    Descubre el poderoso aliado que te guiará en el laberinto de los mercados financieros. Este indicador revolucionario te llevará de la incertidumbre a la claridad, permitiéndote identificar con precisión los puntos de inflexión del mercado. Mejora tus decisiones de entrada y salida, optimiza tus operaciones y ¡multiplica tus ganancias con confianza. ¡Para más información, te invitamos a unirte a nuestro canal de Telegram en https://t.me/Profit_Evolution  ¡Allí encontrarás contenido exclusivo, a
    FREE
    Novato alertas
    Juan Manuel Rojas Perez
    5 (3)
    Descubre el poderoso aliado que te guiará en el laberinto de los mercados financieros. Este indicador revolucionario te llevará de la incertidumbre a la claridad, permitiéndote identificar con precisión los puntos de inflexión del mercado. Mejora tus decisiones de entrada y salida, optimiza tus operaciones y ¡multiplica tus ganancias con confianza. Ahora con alertas en tu pc o móvil ¡Para más información, te invitamos a unirte a nuestro canal de Telegram en   https://t.me/Profit_Evolution  ¡
    FREE
    This script automatically calculates and updates ICT's daily IPDA look back time intervals and their respective discount / equilibrium / premium, so you don't have to :) IPDA stands for Interbank Price Delivery Algorithm. Said algorithm appears to be referencing the past 20, 40, and 60 days intervals as points of reference to define ranges and related PD arrays. Intraday traders can find most value in the 20 Day Look Back box, by observing imbalances and points of interest. Longer term traders c
    This z-score indicator shows the correct z-score of an asset, as it uses the normalized price data for calculation, which is the only correct way. Z-score is only applicable for normal distributed data, therefore not the actual price is considered, but the normalised returns, which were assumed to follow a normal distribution. Returns are mean reverting and assumed to follow a normal distribution, therefore z-score calculation of returns is more reliable than z-score on price, as price is NOT m
    Version MT4 Williams Vix Fix MT5 ¿Necesitas ayuda para encontrar cuándo el mercado ha alcanza el próximo suelo? Williams Vix Fix MT5 se basa en la volatilidad del mercado y otorga un gran apoyo para saber cuándo una corrección está llegando a su fin. ¡PRUÉBALO GRATIS AHORA! Williams Vix Fix MT5 deriva del indicador VixFix de Larry Williams adaptado para todo tipo de  activos financieros . VIX representa el miedo y la codicia en el mercado en función de su volatilidad. Un valor alto de VIX indi
    Boom and Crash Pro Indicator
    Savia Forex Software Solutions
    Boom and Crash Pro Indicator The Savia Forex Solutions Boom and Crash Pro Indicator gives you highly accurate entries on all Boom and Crash Indices. The Boom and Crash Pro Indicator is dynamic and powerful and is optimized for all timeframes. Trade with improved confidence and maximize your success rate. Benefits Dynamic and Powerful. Boom and Crash Pro Indicator is fully optimized for all chart timeframes. Whether price action is an uptrend, downtrend or trading sideways, Boom and Crash Pro Ind
    NIVELES CRITICOS DE RAD Los procesos de Acumulación y Distribución de Volumen generan los soportes y resistencias naturales del mercado.  A medida que estos proceso se generan, los niveles en los que el volumen relevante se posiciona se convierten en zonas de difíciles de franquear al alza o a la baja. El indicador RAD,   rastrea el Volumen Relevante en tiempo real, identificando los  procesos de acumulación y distribución, graficándolos como  zonas de SOPORTE o RESISTENCIA.  Mediante el uso de
    El indicador le permite determinar la dirección actual del precio y la volatilidad del mercado. Esta versión del Traders Dynamic Index tiene eliminado el rediseño de los datos históricos, la velocidad de cálculo del algoritmo optimizada, más parámetros externos para ajustes más precisos y sus funcionalidades extendidas: se agregó la selección del oscilador inicial y los métodos de suavizado de los promedios. . Parámetros: Mode Osc - selección del oscilador de estimación Period Osc - el período d
    Three Candles Pattern
    Edson Cavalca Junior
    5 (1)
    The patterns of 3 (three) Candles: Three White Soldiers; Three Black Crows; These are reversal patterns widely used by traders, as they have a high probability of showing the inversion of the current market movement. For example, if in a bullish trend there are three black crows, there is a high probability of reversing the current bullish movement. The Three White Soldiers have the following characteristics: There are 3 consecutive candles with a good body, that is, the difference between
    Trend driver bars is the manual trading system, which defines current trend continue or it's pull-back/reverse. "Driver" bars - are price action patterns that has powerfull affect on market, defining it's near future direction. Generally, driver bars represents trend "skeleton" and often anticipates new market impulse. System plots arrows when market shows 3 pattenrs in a row(most powerfull combo-pattern), and makes fast scalping of incomming movement. Loss positions closes by common profit. Lot
    Keltner Channels (ou   Canais de Keltner ) é mais um indicador de   volatilidade   utilizado pela   análise técnica. Também chamado de   envelope , esse canal foi criado por Chester Keltner para monitorar os seus investimentos no mercado futuro de café na década de 1960. Porém, com o passar do tempo, passou também a ser utilizado para outros ativos e, atualmente, é uma das ferramentas mais utilizadas pelos traders. Nesta versão customizada foram adicionados novas opções de método de média movel
    Los compradores de este producto también adquieren
    TPSproTREND PrO MT5
    Roman Podpora
    4.89 (9)
    TPSpro TREND PRO  - is a trend indicator that automatically analyzes the market and provides information about the trend and each of its changes, as well as giving signals for entering trades without redrawing! The indicator uses each candle, analyzing them separately. referring to different impulses - up or down impulse. Exact entry points into transactions for currencies, crypto, metals, stocks, indices!  Version MT4               DETAILED DESCRIPTION               R ecommended to use with an
    TPSpro RFI Levels MT5
    Roman Podpora
    4.75 (12)
    INSTRUCCIONES       RUSO   -   ING        Se   recomienda utilizar con un indicador.       -       TPSpro   TENDENCIA PRO -   Versión MT5 Un elemento clave en el trading son las zonas o niveles desde los que se toman las decisiones de compra o venta de un instrumento de trading. A pesar de los intentos de los principales actores de ocultar su presencia en el mercado, inevitablemente dejan rastros. Nuestra tarea era aprender a identificar estos rastros e interpretarlos correctamente. Funciones p
    FX Levels es un indicador de soporte y resistencia excepcionalmente preciso que fusiona el método Lighthouse tradicional con un enfoque dinámico innovador, funcionando a la perfección en todos los símbolos de negociación. Esto incluye pares de divisas, índices, acciones o materias primas. FX Levels identifica puntos de reversión y los muestra en el gráfico, que pueden utilizarse idealmente como objetivos de beneficios en sus actividades de negociación. En el desarrollo de FX Levels, hemos utili
    Quantum TrendPulse
    Bogdan Ion Puscasu
    5 (1)
    Presentamos   Quantum TrendPulse   , la herramienta de trading definitiva que combina el poder de   SuperTrend   ,   RSI   y   Stochastic   en un indicador integral para maximizar su potencial de trading. Diseñado para traders que buscan precisión y eficiencia, este indicador le ayuda a identificar tendencias del mercado, cambios de impulso y puntos de entrada y salida óptimos con confianza. Características principales: Integración con SuperTrend:   siga fácilmente la tendencia predominante del
    Atomic Analyst MT5
    Issam Kassas
    4.32 (19)
    En primer lugar, vale la pena enfatizar que este Indicador de Trading no repinta, no redibuja y no se retrasa, lo que lo hace ideal tanto para el trading manual como para el automatizado. Manual del usuario: configuraciones, entradas y estrategia. El Analista Atómico es un Indicador de Acción del Precio PA que utiliza la fuerza y el impulso del precio para encontrar una mejor ventaja en el mercado. Equipado con filtros avanzados que ayudan a eliminar ruidos y señales falsas, y aumentan el poten
    FX Power MT5 NG
    Daniel Stein
    5 (7)
    Obtenga su actualización diaria del mercado con detalles y capturas de pantalla a través de nuestro Morning Briefing aquí en mql5 y en Telegram ! FX Power MT5 NG es la nueva generación de nuestro popular medidor de fuerza de divisas, FX Power. ¿Y qué ofrece este medidor de fuerza de nueva generación? Todo lo que le encantaba del FX Power original PLUS Análisis de fuerza de ORO/XAU Resultados de cálculo aún más precisos Períodos de análisis configurables individualmente Límite de cálculo persona
    Primero que todo, vale la pena enfatizar que este Sistema de Trading es un Indicador No Repintado, No Redibujado y No Retrasado, lo que lo hace ideal tanto para el trading manual como para el automatizado. Curso en línea, manual y descarga de ajustes preestablecidos. El "Sistema de Trading Inteligente MT5" es una solución completa de trading diseñada para traders nuevos y experimentados. Combina más de 10 indicadores premium y presenta más de 7 estrategias de trading robustas, lo que lo convie
    PZ Swing Trading MT5
    PZ TRADING SLU
    5 (4)
    Swing Trading es el primer indicador diseñado para detectar oscilaciones en la dirección de la tendencia y posibles oscilaciones de reversión. Utiliza el enfoque de intercambio de línea de base, ampliamente descrito en la literatura comercial. El indicador estudia varios vectores de precios y tiempos para rastrear la dirección de la tendencia agregada y detecta situaciones en las que el mercado está sobrevendido o sobrecomprado y listo para corregir. [ Guía de instalación | Guía de actualización
    Introduciendo       Quantum Breakout PRO   , el innovador indicador MQL5 que está transformando la forma en que comercia con Breakout Zones. Desarrollado por un equipo de comerciantes experimentados con experiencia comercial de más de 13 años,       Desglose cuántico PRO       está diseñado para impulsar su viaje comercial a nuevas alturas con su innovadora y dinámica estrategia de zona de ruptura. El indicador de ruptura cuántica le dará flechas de señal en las zonas de ruptura con 5 zonas
    FX Volume MT5
    Daniel Stein
    4.93 (14)
    Obtenga su actualización diaria del mercado con detalles y capturas de pantalla a través de nuestro Morning Briefing aquí en mql5 y en Telegram ! FX Volume es el PRIMER y ÚNICO indicador de volumen que proporciona una visión REAL del sentimiento del mercado desde el punto de vista de un bróker. Proporciona una visión impresionante de cómo los participantes institucionales del mercado, como los brokers, están posicionados en el mercado Forex, mucho más rápido que los informes COT. Ver esta info
    Este es un genial indicador para MT5 que ofrece señales precisas para entrar en una transacción sin redibujar. Se puede aplicar a cualquier activo financiero: fórex, criptomonedas, metales, acciones, índices. Nos dará valoraciones bastante precisas y nos dirá cuándo es mejor abrir y cerra una transacción. Eche un vistazo  al vídeo  (6:22), ¡contiene un ejemplo de procesamiento de una sola señal que ha amortizado el indicador! La mayoría de los tráders mejoran sus resultados comerciales durante l
    Ahora $ 147 (aumentando a $ 499 después de algunas actualizaciones) - Cuentas ilimitadas (PC o Mac) Manual de usuario de RelicusRoad + Videos de capacitación + Acceso al grupo privado de Discord + Estado VIP UNA NUEVA MANERA DE VER EL MERCADO RelicusRoad es el indicador comercial más poderoso del mundo para divisas, futuros, criptomonedas, acciones e índices, y brinda a los comerciantes toda la información y las herramientas que necesitan para mantenerse rentables. Brindamos análisis téc
    Blahtech Supply Demand MT5
    Blahtech Limited
    4.54 (13)
    Was: $299  Now: $99   Supply Demand uses previous price action to identify potential imbalances between buyers and sellers. The key is to identify the better odds zones, not just the untouched ones. Blahtech Supply Demand indicator delivers functionality previously unavailable on any trading platform. This 4-in-1 indicator not only highlights the higher probability zones using a multi-criteria strength engine, but also combines it with multi-timeframe trend analysis, previously confirmed swings
    ¡La mejor solución para cualquier operador novato o experto! Este indicador es una herramienta única, de alta calidad y asequible porque hemos incorporado una serie de características propias y una nueva fórmula. ¡Con sólo UN gráfico puede leer la Fuerza de la Divisa para 28 pares de Divisas! Imagínese cómo mejorará su operativa porque podrá señalar el punto exacto de activación de una nueva tendencia o de una oportunidad de scalping. Manual del usuario: haga   clic aquí Ese es el primero
    Quantum Trend Sniper
    Bogdan Ion Puscasu
    4.71 (49)
    Introduciendo       Indicador Quantum Trend Sniper   , el innovador indicador MQL5 que está transformando la forma en que identificas y negocias los cambios de tendencia. Desarrollado por un equipo de comerciantes experimentados con experiencia comercial de más de 13 años,       Indicador de francotirador de tendencia cuántica       está diseñado para impulsar su viaje comercial a nuevas alturas con su forma innovadora de identificar cambios de tendencia con una precisión extremadamente alta.
    Gold TMAF MTF - es el mejor indicador técnico bursátil. El algoritmo del indicador analiza el movimiento del precio de un activo y refleja la volatilidad y las posibles zonas de entrada. Las mejores señales del indicador: - Para VENTA = límite superior rojo de TMA2 por encima del límite superior rojo de TMA1 + indicador fractal rojo por encima + flecha amarilla de señal SR en la misma dirección. - Para COMPRA = límite inferior azul de TMA2 por debajo del límite inferior azul de TMA1 + i
    TPA True Price Action indicator reveals the true price action of the market makers through 100% non-repainting signals strictly at the close of a candle! TPA shows entries and re-entries, every time the bulls are definitely stronger than the bears and vice versa. Not to confuse with red/green candles. The shift of power gets confirmed at the earliest stage and is ONE exit strategy of several. There are available now two free parts of the TPA User Guide for our customers. The first "The Basics"
    Este indicador reconoce más de 30 patrones de velas japonesas y los resalta maravillosamente en el gráfico. Es simplemente uno de esos indicadores sin los que los operadores de acciones de precios no pueden vivir. Mejora tu análisis técnico de la noche a la mañana Detecta patrones de velas japonesas fácilmente Comercio de patrones de inversión confiables y universales Salte a las tendencias establecidas de forma segura utilizando patrones de continuación El indicador no se repinta e implementa
    "The Squeeze indicator attempts to identify periods of consolidation in a market. In general the market is either in a period of quiet consolidation or vertical price discovery. By identifying these calm periods, we have a better opportunity of getting into trades with the potential for larger moves. Once a market enters into a "squeeze," we watch the overall market momentum to help forecast the market direction and await a release of market energy." The Modified TTM Squeeze Indicator is a modi
    Was: $249  Now: $99   Market Profile defines a number of day types that can help the trader to determine market behaviour. A key feature is the Value Area, representing the range of price action where 70% of trading took place. Understanding the Value Area can give traders valuable insight into market direction and establish the higher odds trade. It is an excellent addition to any system you may be using. Inspired by Jim Dalton’s book “Mind Over Markets”, this indicator is designed to suit the
    El Indicador de Cuadrados de Gann es una herramienta poderosa de análisis de mercado basada en el artículo "Fórmula Matemática para Predicciones de Mercado" escrito por W.D. Gann, que se basa en conceptos matemáticos para el análisis. Incorpora elementos de las técnicas de Gann relacionadas con los cuadrados de 144, 90 y 52, así como el cuadrado de 9. Además, incluye el método del  sobre cómo combinar el cuadrado de 9 con canales y patrones de estrellas. Manual del Usuario y Modo de Uso: Antes d
    Trend Forecaster
    Alexey Minkov
    5 (6)
    The Trend Forecaster indicator utilizes a unique proprietary algorithm to determine entry points for a breakout trading strategy. The indicator identifies price clusters, analyzes price movement near levels, and provides a signal when the price breaks through a level. The Trend Forecaster indicator is suitable for all financial assets, including currencies (Forex), metals, stocks, indices, and cryptocurrencies. You can also adjust the indicator to work on any time frames, although it is recommen
    Introduction Harmonic Patterns are best used to predict potential turning point. Traditionally, Harmonic Pattern was identified manually connecting peaks and troughs points in the chart. Manual harmonic pattern detection is painfully tedious and not suitable for everyone. You are often exposed under subjective pattern identification with manual pattern detection. To avoid these limitations, Harmonic Pattern Plus was designed to automate your harmonic pattern detection process. The functionality
    FxaccurateLS
    Shiv Raj Kumawat
    WHY IS OUR FXACCCURATE LS MT5 THE PROFITABLE ? PROTECT YOUR CAPITAL WITH RISK MANAGEMENT Gives entry, stop and target levels from time to time. It finds Trading opportunities by analyzing what the price is doing during established trends. POWERFUL INDICATOR FOR A RELIABLE STRATEGIES We have made these indicators with a lot of years of hard work. It is made at a very advanced level. Established trends provide dozens of trading opportunities, but most trend indicators completely ignore them!
    AT Forex Indicator MT5
    Marzena Maria Szmit
    5 (5)
    The AT Forex Indicator MT5 is a sophisticated trading tool designed to provide traders with a comprehensive analysis of multiple currency pairs. This powerful indicator simplifies the complex nature of the forex market, making it accessible for both novice and experienced traders. AT Forex Indicator uses advanced algorithms to detect trends, patterns and is an essential tool for traders aiming to enhance their forex trading performance. With its robust features, ease of use, and reliable signal
    Advanced Supply Demand MT5
    Bernhard Schweigert
    4.5 (14)
    ¡Actualmente con 33% de descuento! ¡La mejor solución para cualquier tráder principiante o experto! Este indicador es una herramienta comercial única, de alta calidad y asequible, porque incorpora una serie de características patentadas y una nueva fórmula. Con esta actualización, podrá mostrar zonas de doble marco temporal. No solo podrá mostrar un marco temporal más alto, sino también mostrar ambos, el marco temporal del gráfico MÁS el marco temporal más alto: MOSTRANDO ZONAS ANIDADAS. A todos
    Volume by Price MT5
    Brian Collard
    3.25 (4)
    The Volume by Price Indicator for MetaTrader 5 features Volume Profile and Market Profile TPO (Time Price Opportunity). Volume and TPO histogram bar and line charts. Volume Footprint charts. TPO letter and block marker collapsed and split structure charts. Static, dynamic and flexible range segmentation and compositing methods with relative and absolute visualizations. Session hours filtering and segment concatenation with Market Watch and custom user specifications. Graphical layering, positio
    XQ Indicator MetaTrader 5
    Marzena Maria Szmit
    3 (2)
    Step into the realm of Forex trading with confidence and precision using XQ, a cutting-edge Forex indicator designed to elevate your trading game to unprecedented heights. Whether you're a seasoned trader or just stepping into the world of currency exchange, XQ Forex Indicator empowers you with the insights and signals needed to make informed trading decisions. The signal conditions are a combination of three indicators, and XQ Forex Indicator only display  medium and long-term trends . The ind
    PTS - Buscador de Compras por Divergencia de Precision Trading Systems El Buscador de Divergencias de Precisión fue diseñado para encontrar los mínimos del mercado con una precisión milimétrica y lo hace con frecuencia. En el análisis técnico, la habilidad de identificar mínimos generalmente es mucho más fácil que identificar máximos, y este elemento está diseñado precisamente para esa tarea. Después de identificar una divergencia alcista, es prudente esperar a que la tendencia se vuelva al
    ¿Está buscando un potente indicador de compraventa de divisas que pueda ayudarlo a identificar oportunidades comerciales rentables con facilidad? No busque más allá de Beast Super Signal. Este indicador basado en tendencias fácil de usar monitorea continuamente las condiciones del mercado, buscando nuevas tendencias en desarrollo o saltando sobre las existentes. Beast Super Signal da una señal de compra o venta cuando todas las estrategias internas se alinean y están en 100% de confluencia entre
    Otros productos de este autor
    Multi Chart Crosshairs MT5
    Robert Gerald Wood
    5 (4)
    Este indicador está diseñado para hacer que las revisiones de muchos gráficos en diferentes escalas de tiempo sean más rápidas y fáciles de hacer. Realice un seguimiento del tiempo y el precio en varios gráficos Cambiar símbolo en un gráfico y todos los demás gráficos del mismo símbolo también se cambiarán. Fácil de usar, rápido de dominar El indicador le permite identificar el precio y la hora en la que se encuentra el puntero del mouse en el gráfico actual, en todos los demás gráficos abiertos
    This indicator will draw patterns based on   Rob Smith's   The Strat   as they emerge in real time on your chart. As price evolves,   TheStrat   offers 18 distinct price action patterns that can help you get good entries in the market. Each pattern involves two or three candles, and this indicator will draw a bounding box around the candles and name the pattern. The indicator also shows when a potential setup is forming, known by stratters as an Actionable signal. Candles Each candle is de
    Creé este indicador simple mientras aprendía sobre TheStrat de Rob Smith y lo encuentro tan útil que pensé en compartirlo con usted. Si lo encuentra útil, mire los otros indicadores que he publicado en MQL5. El indicador simplemente dibuja una sola línea en el gráfico que muestra el nivel de precio que selecciona de un marco de tiempo más alto. Con la configuración, tiene control total sobre el período de tiempo que muestra, pero de forma   predeterminada, calcula el período de tiempo más alto,
    FREE
    Este indicador dibujará una etiqueta por encima o por debajo de cada vela basada en TheStrat de Rob Smith a medida que se desarrollen con el tiempo en su gráfico. A medida que evoluciona el precio, una vela puede cambiar entre tres estados. Cuando la vela se abre por primera vez, si se encuentra completamente dentro de las velas anteriores altas y bajas, entonces comenzará como un Tipo 1. A medida que pasa el tiempo, si rompe el máximo o mínimo de la vela anterior, se producirá un tipo 2, y s
    Chart Drawing Cloner
    Robert Gerald Wood
    5 (2)
    Este script le permite copiar objetos de dibujo de cualquier tipo, como líneas de tendencia, retrocesos de Fibonachi, etc., en uno o más gráficos. De forma predeterminada, la secuencia de comandos copiará todos los objetos en el gráfico actual, es decir, el gráfico al que se aplicó la secuencia de comandos, a cualquier otro gráfico del mismo símbolo cargado actualmente. Ajustes Plazo de destino Cuando se establece en algo que no sea PERIOD_CURRENT, copiará los objetos en cualquier gráfico
    FREE
    A simple script that can delete all the drawing objects on a chart, or just the objects of a specific type. Settings: DeleteObjectsOfType By default the value will be blank which means ALL drawing objects on the chart will be deleted. If you only wish to delete specific types of drawing object, change this setting to the type of object to delete. For example, Fibonacci Retracement, Text, Label or Trend Line. Please see the demonstration video for more information.
    FREE
    This script allows you to toggle the "Show Trade Levels" option, but for the current chart only. Normally, you can only change the setting using the Options -> Chart menu for ALL charts, but this script allows you to do it for a SINGLE chart. I'm using it when I take screenshots, because most of the time I'm not trying to show the trades, just some functionality of one of my other tools. Iif you need that functionality, then this script is very helpful! If the script helps you, please let me
    FREE
    TheStrat Patterns
    Robert Gerald Wood
    This indicator will draw patterns based on Rob Smith's The Strat as they emerge in real time on your chart. As price evolves, TheStrat offers 18 distinct price action patterns that can help you get good entries in the market. Each pattern involves two or three candles, and this indicator will draw a bounding box around the candles and name the pattern. The indicator also shows when a potential setup is forming, known by stratters as an Actionable signal. Candles Each candle is defined by i
    Multi Chart Crosshairs
    Robert Gerald Wood
    5 (1)
    This indicator is designed to make reviews of many charts on different timescales quicker, and easier to do. Track Time and Price across multiple charts Change Symbol on one chart and all other charts of the same symbol will be changed too. Easy to use, quick to master The indicator allows you to identify the price and time where the mouse pointer is on the current chart, across all other charts open on the same Symbol. This allows you to quickly see information on multiple charts whereas normal
    TheStrat Levels
    Robert Gerald Wood
    This indicator draws the prior Highs and Lows for multiple timeframes, and can display potential Take Profit and Stop Loss levels. In Rob Smith's # The Strat   terms,   these are potential entry points, or alternatively potential targets for open positions. I like to use them in both ways. On a lower timeframe, say 5 minutes to get a good entry on a daily or weekly level, and then as a potential target. Very small stops required giving an excellent risk/reward ratio. Please watch the DEMO video
    TheStrat Candles
    Robert Gerald Wood
    5 (1)
    Este indicador dibujará una etiqueta encima o debajo de cada vela según       Rob Smith       El Strat       a medida que se desarrollan con el tiempo en su gráfico. A medida que evoluciona el precio, una vela puede cambiar entre tres estados. Cuando la vela se abre por primera vez, si se encuentra completamente dentro de las velas altas y bajas anteriores, comenzará como Tipo 1. A medida que pasa el tiempo, si rompe el máximo o el mínimo de la vela anterior, se convertirá en un tipo 2, y si
    TheStrat FTFC
    Robert Gerald Wood
    FTFC se refiere a Full Timeframe Continuity como se define en   The Strat   de Rob Smith. Este indicador dibuja dos líneas en el gráfico, una de las más altas de los niveles de apertura trimestrales, mensuales, semanales, diarias o por horas, y la segunda de las más bajas de esos valores. Esto le da un canal por encima o por debajo del cual es más probable que el comercio sea muy fuerte en una dirección. Entre líneas, la acción del precio será más agitada y es posible que desee utilizar paradas
    A los mercados les encantan los números redondos y, a menudo, actúan como soporte en un mercado a la baja o como resistencia cuando el precio sube. Este indicador está diseñado para dibujar niveles de precios en valores redondos. Lo hace automáticamente, pero también tiene la opción de anularlo y determinar los niveles que desea ver. Un nivel redondo puede ser tan simple como pasos de 10, 10, 20, 30, etc. o si está trabajando con Forex, tal vez quiera ver cambios en 0.1 o 0.01. El indicador dibu
    TheStrat Monitor
    Robert Gerald Wood
    3 (2)
    If you've not already learnt about The Strat trading strategy , go google it now. I promise it won't be a waste of your time, and you will likely learn some new tricks whether you use it or not. OK, so now you know what TheStrat is, you will be able to understand what this indicator can do for you. Key Features In short, the Indicator will: Show Timeframe Continuity for all supported timeframes Supports two timeset views, Day trader and Swing trader Show when Full Timeframe Continuity is in pl
    Al operar con   The Strat   , es importante estar atento a múltiples marcos de tiempo. Este indicador mostrará el estado diario, semanal, mensual y trimestral de la vela actual para cada período de tiempo. Un icono de círculo muestra que la vela en ese período de tiempo es actualmente un Interior, o Tipo 1 en la terminología de TheStrat. Una vela Inside Day está consolidando la acción del precio y estamos buscando una ruptura del rango. Un ícono de Triángulo, apuntando hacia arriba o hacia abajo
    Active Pivot Levels
    Robert Gerald Wood
    5 (1)
    Los niveles de pivote son un nivel técnico bien establecido que es reconocido en todos los mercados. Este indicador dibujará los pivotes trimestrales, mensuales, semanales, diarios y de cuatro horas actuales en el gráfico, para cualquier símbolo. También puede mostrar los niveles de soporte y resistencia para cada período y elegir cuál mostrar del nivel 1 al 4.     Elija el tipo de pivote entre: Estándar Camarilla DeMark Woody Fibonacci Tenga en cuenta que los pivotes DeMark tienen un solo nivel
    ATR Extremes
    Robert Gerald Wood
    El rango verdadero promedio (ATR) es un indicador de uso común que mide la cantidad de movimiento en el precio durante una duración determinada. Sin embargo, el valor que da no está definido dentro de ningún tipo de límite, lo que hace que usarlo para cualquier otra cosa que no sean cálculos de stop loss o take profit, sea casi imposible. Este indicador es su indicador ATR estándar, pero hemos introducido demarcaciones percentiles para que pueda ver los extremos. Puede elegir entre percenti
    Range Exhaustion
    Robert Gerald Wood
    El agotamiento del rango ocurre cuando el precio alcanza o supera el rango esperado para el período actual. En estos niveles, el precio comienza a perder su impulso en relación con el período anterior, por lo que es un buen punto para asegurarse de que no está tomando nuevas posiciones. Este indicador le mostrará dónde es probable que suceda esto en su gráfico, mostrando niveles para períodos diarios, semanales y mensuales. Cuando ve que el precio supera estos niveles de agotamiento, le está dic
    TheStrat FTFC MT5
    Robert Gerald Wood
    FTFC se refiere a Full Timeframe Continuity como se define en   The Strat   de Rob Smith. Este indicador dibuja dos líneas en el gráfico, una de las más altas de los niveles de apertura trimestrales, mensuales, semanales, diarias o por horas, y la segunda de las más bajas de esos valores. Esto le da un canal por encima o por debajo del cual es más probable que el comercio sea muy fuerte en una dirección. Entre líneas, la acción del precio será más agitada y es posible que desee utilizar paradas
    TheStrat Monitor MT5
    Robert Gerald Wood
    5 (1)
    Si aún no conoce   la estrategia comercial de The Strat   , búsquela en Google ahora. Te prometo que no será una pérdida de tiempo, y es probable que aprendas algunos trucos nuevos, ya sea que lo uses o no. Bien, ahora que sabe qué es TheStrat, podrá comprender lo que este indicador puede hacer por usted. Características clave En resumen, el Indicador: Mostrar la continuidad del marco de tiempo para todos los marcos de tiempo admitidos Admite dos vistas de conjuntos de tiempo, Day trader y Swi
    TheStrat TFC Monitor MT5
    Robert Gerald Wood
    5 (1)
    Al operar con   The Strat   , es importante estar atento a múltiples marcos de tiempo. Este indicador mostrará el estado diario, semanal, mensual y trimestral de la vela actual para cada período de tiempo. Un icono de círculo muestra que la vela en ese período de tiempo es actualmente un Interior, o Tipo 1 en la terminología de TheStrat. Una vela Inside Day está consolidando la acción del precio y estamos buscando una ruptura del rango. Un ícono de Triángulo, apuntando hacia arriba o hacia abajo
    Los niveles de pivote son un nivel técnico bien establecido que es reconocido en todos los mercados. Este indicador dibujará los pivotes trimestrales, mensuales, semanales, diarios y de cuatro horas actuales en el gráfico, para cualquier símbolo. También puede mostrar los niveles de soporte y resistencia para cada período y elegir cuál mostrar del nivel 1 al 4.     Elija el tipo de pivote entre: Estándar Camarilla DeMark Woody Fibonacci Tenga en cuenta que los pivotes DeMark tienen un solo nivel
    A los mercados les encantan los números redondos y, a menudo, actúan como soporte en un mercado a la baja o como resistencia cuando el precio sube. Este indicador está diseñado para dibujar niveles de precios en valores redondos. Lo hace automáticamente, pero también tiene la opción de anularlo y determinar los niveles que desea ver. Un nivel redondo puede ser tan simple como pasos de 10, 10, 20, 30, etc. o si está trabajando con Forex, tal vez quiera ver cambios en 0.1 o 0.01. El indicador dibu
    ATR Extremes MT5
    Robert Gerald Wood
    El rango verdadero promedio (ATR) es un indicador de uso común que mide la cantidad de movimiento en el precio durante una duración determinada. Sin embargo, el valor que da no está definido dentro de ningún tipo de límite, lo que hace que sea casi imposible usarlo para cualquier otra cosa que no sean cálculos de stop loss o take profit. Este indicador es su indicador ATR estándar, pero hemos introducido demarcaciones de percentiles para que pueda ver los extremos. Puede elegir entre percentiles
    El agotamiento del rango ocurre cuando el precio alcanza o supera el rango esperado para el período actual. En estos niveles, el precio comienza a perder su impulso en relación con el período anterior, por lo que es un buen punto para asegurarse de que no está tomando nuevas posiciones. Este indicador le mostrará dónde es probable que suceda esto en su gráfico, mostrando niveles para períodos diarios, semanales y mensuales. Cuando ve que el precio supera estos niveles de agotamiento, le está dic
    Filtro:
    renetrader07
    135
    renetrader07 2023.11.23 18:24 
     

    This greatly helps with being more mechanical with my trading

    Robert Gerald Wood
    4557
    Respuesta del desarrollador Robert Gerald Wood 2023.11.23 18:26
    Many thanks for the review. This is the indicator I use the most now, it takes a little getting used to, but worth it!
    Respuesta al comentario
    Versión 2.10 2021.06.18
    Fix for issue where lines were not drawing for charts with not enough history data on the current timeframe.
    Fix for issue where number of potential targets displayed was being restricted unintentionally.
    Minor performance improvements.
    Versión 2.0 2021.06.16
    NEW - Version 2 of the Indicator.
    Almost a complete rewrite, now includes the drawing of potential Take Profit and Stop loss levels and showing the associated Risk/Reward value for each. Pivot Machine Gun (PMG) scenarios are also identified and shown on each level with that potential.

    - Levels from Hourly, Four Hourly, Daily, Weekly and Monthly timeframes
    - Potential Take Profit levels
    - Potential Stop Loss levels based on the current or higher timeframe
    - Risk / Reward calculated continuously for each potential target level based on potential stop level
    - Pivot Machine Gun identification
    - Labelling for each level so you can identify what there
    - Comprehensive options to make it look as you wish