Average Cost Price For MT5
- Indicadores
- Zihni Taş
- Versión: 2.0
- Actualizado: 23 mayo 2024
- Activaciones: 5
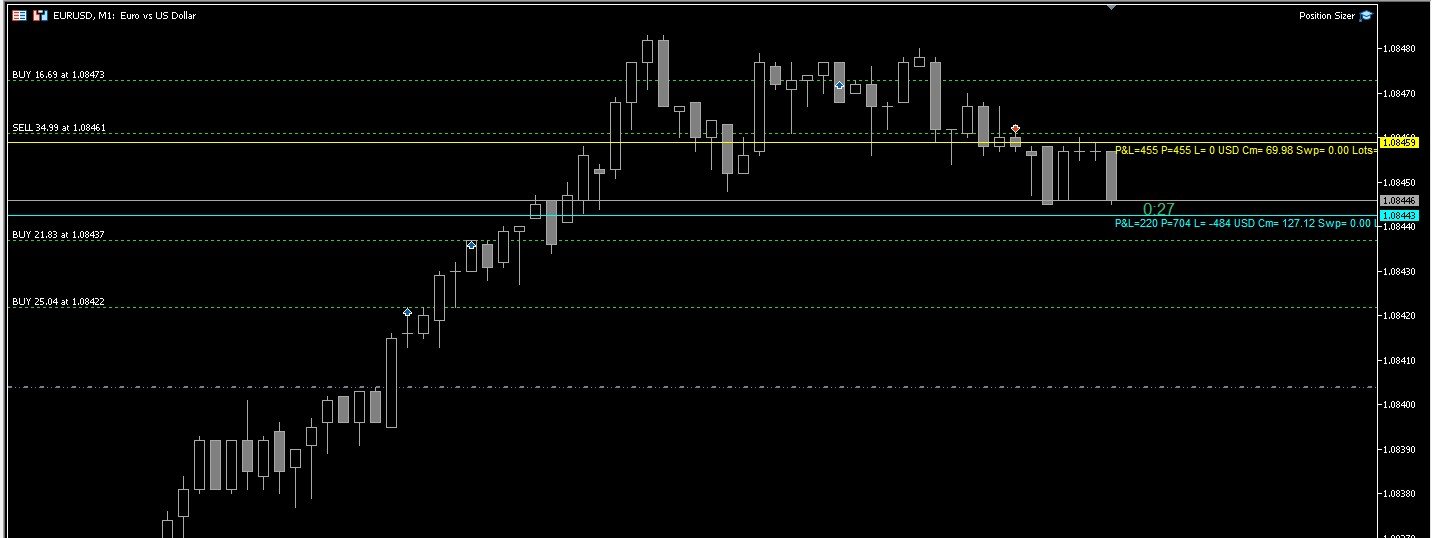
Average Cost Price helps you keep track of your open positions on the chart. In doing so, it provides lines and explanations on the chart. This line is the average price value of the Bid or Ask.
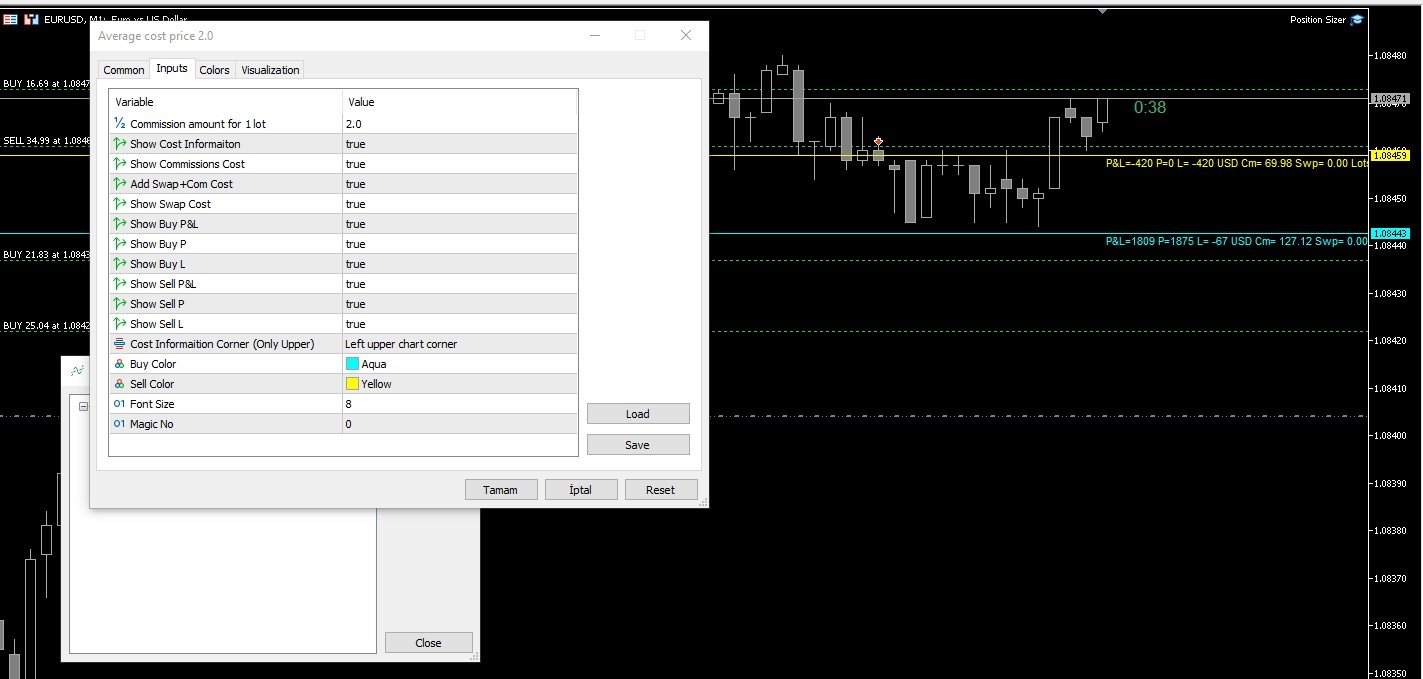
If you wish, you can see the average cost price by adding SWAP and COMMISSION to the average price value.
*** You can add commission manually per lot.
The legend below the Average Cost Price line gives you:
* Average Buy or Sell price line,
* Swap Amount,
* Commission Amount,
* Total Profit or Loss amount,
* Profit or Loss status of individual transactions in Profit or Loss,
* Lot quantity
*** From Settings These options can be added or removed.