• Información general
  • Comentarios
  • Discusión

Trigger Cash

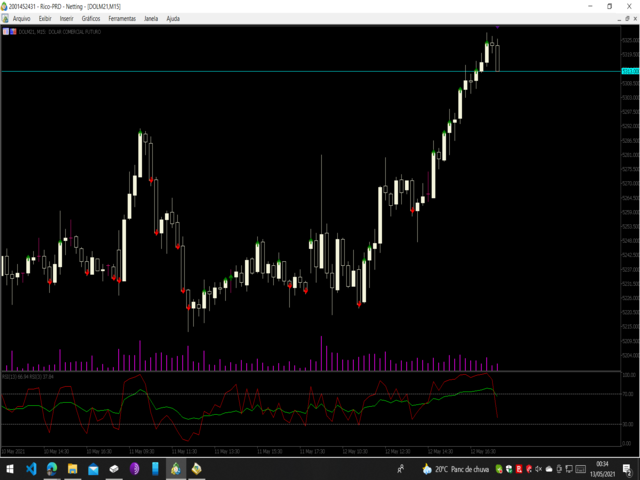
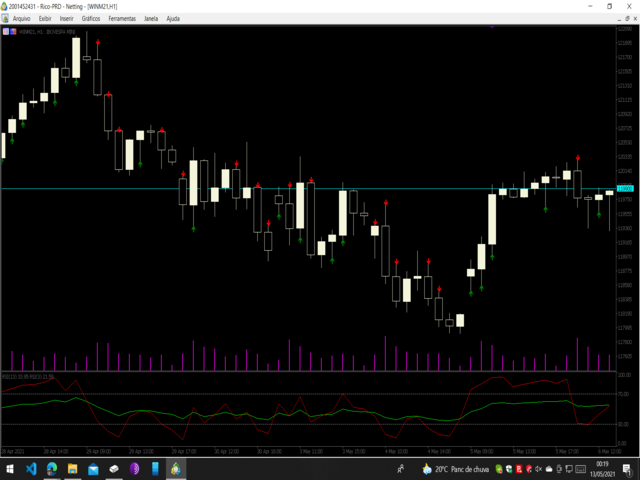
Los activadores son reglas de negocio que usted define para su ejecución inmediata después de que se crean o actualizan los tickets. Por ejemplo, se puede utilizar un disparador para notificar al cliente cuando se ha abierto un ticket. El otro se puede crear para notificar al cliente cuando se resuelve el ticket. Este programa le indica al usuario cuándo se activa un disparador de inversión de tendencia. Este programa me dio mucha comodidad en mis operaciones en el mini índice. ¡Realice el back-test gratuito! ¡Gracias de antemano por su atención!


Productos recomendados
Was: $249  Now: $99   Market Profile defines a number of day types that can help the trader to determine market behaviour. A key feature is the Value Area, representing the range of price action where 70% of trading took place. Understanding the Value Area can give traders valuable insight into market direction and establish the higher odds trade. It is an excellent addition to any system you may be using. Inspired by Jim Dalton’s book “Mind Over Markets”, this indicator is designed to suit the
Based on the trading model/strategy/system of gold double-position hedging and arbitrage launched by Goodtrade Brokers, problems encountered in daily operations: 1. Account B immediately places an order immediately following account A. 2: After account A places an order, account B will automatically copy the stop loss and take profit. 3: Account A closes the position of Account B and closes the position at the same time. 4: When account B closes the position, account A also closes the position.
Mean Reversion Supply Demand Indicator Mean Reversion Supply Demand is the indicator to detect the important supply demand zone in your chart. The concept of supply demand trading relies on the quantity mismatching between buying and selling volumes in the financial market. Typically, supply demand zone serves to predict the turning point. The wave pattern, for any supply demand zone to work as an successful trade, looks like the price must touch the base zone, move away and then return to zone
Volume by Price MT5
Brian Collard
3.25 (4)
The Volume by Price Indicator for MetaTrader 5 features Volume Profile and Market Profile TPO (Time Price Opportunity). Volume and TPO histogram bar and line charts. Volume Footprint charts. TPO letter and block marker collapsed and split structure charts. Static, dynamic and flexible range segmentation and compositing methods with relative and absolute visualizations. Session hours filtering and segment concatenation with Market Watch and custom user specifications. Graphical layering, positio
Your Trend Friend
Luigi Nunes Labigalini
5 (1)
The trend is your friend! Look at the color of the indicator and trade on that direction. It does not  repaint. After each candle is closed, that's the color of the trend. You can focus on shorter faster trends or major trends, just test what's most suitable for the symbol and timeframe you trade. Simply change the "Length" parameter and the indicator will automatically adapt. You can also change the color, thickness and style of the lines. Download and give it a try! There are big movements
Ante todo, vale la pena enfatizar que esta Herramienta de Trading es un Indicador No Repintado, No Redibujado y No Retrasado, lo que la hace ideal para el trading profesional. Curso en línea, manual del usuario y demostración. El Indicador de Conceptos de Acción del Precio Inteligente es una herramienta muy potente tanto para traders nuevos como experimentados. Combina más de 20 indicadores útiles en uno solo, combinando ideas avanzadas de trading como el Análisis del Trader del Círculo Inte
Support & Resistance indicator is a modification of the standard Bill Williams' Fractals indicator. The indicator works on any timeframes. It displays support and resistance levels on the chart and allows setting stop loss and take profit levels (you can check the exact value by putting the mouse cursor over the level). Blue dashed lines are support level. Red dashed lines are resistance levels. If you want, you can change the style and color of these lines. If the price approaches a support lev
Supply and Demand Indicator + FREE Currency Strength Meter ADD-ON Looking for a powerful tool that can help you identify the most reactive zones in the forex market? Our supply and demand indicator for MetaTrader 4 and 5 is exactly what you need. With its advanced algorithms and real-time analysis, this indicator helps traders of all experience levels make informed trading decisions. The supply and demand indicator is a cutting-edge tool that helps traders identify areas where buyers and sellers
This z-score indicator shows the correct z-score of an asset, as it uses the normalized price data for calculation, which is the only correct way. Z-score is only applicable for normal distributed data, therefore not the actual price is considered, but the normalised returns, which were assumed to follow a normal distribution. Returns are mean reverting and assumed to follow a normal distribution, therefore z-score calculation of returns is more reliable than z-score on price, as price is NOT m
SolarTrade Suite Financial Indicator: Jupiter Market Indicator - ¡Su guía confiable en el mundo de los mercados financieros! Este es un indicador de tendencia que utiliza algoritmos especiales innovadores y avanzados para calcular su valor, y también tiene un diseño agradable a la vista. Es muy fácil entender las lecturas de este indicador: color azul - compra, rojo - venta. Vea nuestros otros productos de la serie SolarTrade Suite en la parte inferior de la descripción. ¿Quiere navegar
NIVELES CRITICOS DE RAD Los procesos de Acumulación y Distribución de Volumen generan los soportes y resistencias naturales del mercado.  A medida que estos proceso se generan, los niveles en los que el volumen relevante se posiciona se convierten en zonas de difíciles de franquear al alza o a la baja. El indicador RAD,   rastrea el Volumen Relevante en tiempo real, identificando los  procesos de acumulación y distribución, graficándolos como  zonas de SOPORTE o RESISTENCIA.  Mediante el uso de
Before installing the HeatMap indicator make sure you are using a broker that gives you access to the Depth of market (DOM) !! This indicator creates a heatmap on your chart allowing you to see the buy or sell limit orders easily and in real time. You have the possibility to change the setting and the colors of the HeatMap in order to adapt to all markets and all charts. Here is an example of a setting you can use with the NASDAQ100 on the AMPGlobal broker :  https://www.youtube.com/watch?v=x0
Mine Farm is one of the most classic and time-tested scalping strategies based on the breakdown of strong price levels. Mine Farm is the author's modification of the system for determining entry and exit points into the market... Mine Farm - is the combination of great potential with reliability and safety. Why Mine Farm?! - each order has a short dynamic Stop Loss - the advisor does not use any risky methods (averaging, martingale, grid, locking, etc.) - the advisor tries to get
¡El nivel Premium es un indicador único con más del 80% de precisión de predicciones correctas! ¡Este indicador ha sido probado por los mejores especialistas en comercio durante más de dos meses! ¡El indicador del autor no lo encontrarás en ningún otro lugar! ¡A partir de las capturas de pantalla, puede ver por sí mismo la precisión de esta herramienta! 1 es ideal para operar con opciones binarias con un tiempo de vencimiento de 1 vela. 2 funciona en todos los pares de divisas, accion
KT Renko Patterns MT5
KEENBASE SOFTWARE SOLUTIONS
KT Renko Patterns scans the Renko chart brick by brick to find some famous chart patterns that are frequently used by traders across the various financial markets. Compared to the time-based charts, patterns based trading is easier and more evident on Renko charts due to their uncluttered appearance. KT Renko Patterns features multiple Renko patterns, and many of these patterns are extensively explained in the book titled Profitable Trading with Renko Charts by Prashant Shah. A 100% automate
Owl Smart Levels MT5
Sergey Ermolov
4.07 (28)
Versión MT4  |  FAQ El Indicador Owl Smart Levels es un sistema comercial completo dentro de un indicador que incluye herramientas de análisis de mercado tan populares como los fractales avanzados de Bill Williams , Valable ZigZag que construye la estructura de onda correcta del mercado y los niveles de Fibonacci que marcan los niveles exactos de entrada. en el mercado y lugares para tomar ganancias. Descripción detallada de la estrategia Instrucciones para trabajar con el indicador Asesor de c
M & W Pattern Pro is an advanced scanner for M and W patters , it uses extra filters to ensure scanned patterns are profitable. The indicator can be used with all symbols and time frames. The indicator is a non repaint indicator with accurate statistics calculations. To use , simply scan the most profitable pair using the statistics dashboard accuracy , then enter trades on signal arrow and exit at the TP and SL levels. STATISTICS : Accuracy 1 : This is the percentage of the times price hit
The indicator identifies critical support and resistance areas. It also can give alerts and notifications to your mobile. A lot of customization options are available: You can have different timeframe on your current chart. For example, if your current chart timeframe is H1, you can assign the indicator timeframe to M15.The indicator identifies critical support and resistance areas. It also can give alerts and notifications to your mobile. A lot of customizations are available. There is an opti
Double HMA MTF for MT5
Pavel Zamoshnikov
3.67 (3)
This is an advanced multi-timeframe version of the popular Hull Moving Average (HMA) Features Two lines of the Hull indicator of different timeframes on the same chart. The HMA line of the higher timeframe defines the trend, and the HMA line of the current timeframe defines the short-term price movements. A graphical panel with HMA indicator data from all timeframes at the same time . If the HMA switched its direction on any timeframe, the panel displays a question or exclamation mark with a tex
BoxChart MT5
Evgeny Shevtsov
5 (7)
The market is unfair if only because 10% of participants manage 90% of funds. An ordinary trader has slim changes to stand against these "vultures". This problem can be solved. You just need to be among these 10%, learn to predict their intentions and move with them. Volume is the only preemptive factor that faultlessly works on any timeframe and symbol. First, the volume appears and is accumulated, and only then the price moves. The price moves from one volume to another. Areas of volume accumu
This indicator has been developed to identify and display these trends quickly and easily, allowing you to see instantly, those currency pairs which are trending, and those which are not – and in all timeframes, with just one click. The 28 currency pairs are displayed as a fan as they sweep from strong to weak and back again, and this is why we call it the ‘currency array’. All 28 pairs are arrayed before you, giving an instant visual description of those pairs that are trending strongly, those
SmartTrendMt5
Andrey Spiridonov
The SmartTrendMt5 trend indicator generates signals based on the principle of combined analysis of calculated reference points within the Keltner channel. The indicator plots the Keltner channel in a separate window (by default, red lines and a blue line - the middle of the channel), and also draws the histogram of calculated reference points for each candle (by default, the histogram bars are yellow). The should be attached to a chart of any timeframe and any trading symbol in the usual way.
How to use Pair Trading Station Pair Trading Station is recommended for H1 time frame and you can use it for any currency pairs. To generate buy and sell signal, follow few steps below to apply Pair Trading Station to your MetaTrader terminal. When you load Pair Trading Station on your chart, Pair Trading station will assess available historical data in your MetaTrader platforms for each currency pair. On your chart, the amount of historical data available will be displayed for each currency pai
Este indicador le mostrará los valores TP y SL (en esa moneda) que ya configuró para cada pedido en los gráficos (cerrados a la línea de transacción/pedido) que lo ayudarán mucho a estimar sus ganancias y pérdidas para cada pedido. Y también te muestra los valores de PIP. el formato que se muestra es "Valores de moneda de nuestros valores de ganancias o pérdidas / PIP". El valor TP se mostrará en color verde y el valor SL se mostrará en color rojo. Para cualquier pregunta o más información, n
No Demand No Supply MT5
Trade The Volume Waves Single Member P.C.
No Demand No Supply   This indicator identifies   No Demand –No Supply candles to your chart and plots volume bars colored according to the signal. It can be applied to all timeframes or to a specific one only. It can also be used as regular volume indicator  with exceptional future of WEIGHTED VOLUME. Furthermore is has an alert notification, sound and email when a signals occurs. The indicator does not repaint but the alert will come on two candles back due to the definition of No Demand No Su
Cumulative delta indicator As most traders believe, the price moves under the pressure of market buying or selling. When someone redeems an offer standing in the cup, the deal is a "buy". If someone pours into the bid standing in the cup - the deal goes with the direction of "sale". The delta is the difference between purchases and sales. A cumulative delta - the difference between the cumulative sum of purchases and sales for a certain period of time. It allows you to see who is currently contr
WanaScalper
Isaac Wanasolo
1 (1)
A scalping indicator based on mathematical patterns, which on average gives signals with relatively small SL, and also occasionally helps to catch big moves in the markets (more information in the video) This indicator has three main types of notifications: The first type warns of a possible/upcoming signal on the next bar The second type indicates the presence of a ready signal to enter the market/open a position The third type is for SL and TP levels - you will be notified every time price r
WAPV Weis Wave Chart Forex
Eduardo Da Costa Custodio Santos
El Weis Wave Chart Forex para MT5 es un indicador de precio y volumen. La lectura de Precio y Volumen fue ampliamente difundida a través de Richard Demille Wyckoff en base a las tres leyes creadas por él: Oferta y Demanda, Causa y Efecto y Esfuerzo vs. Resultado. En 1900, R.Wyckoff ya utilizaba el gráfico de ondas en sus análisis. Muchos años después, alrededor de 1990, David Weis Automatizó el gráfico de ondas de R. Wyckoff y hoy os traemos la evolución del gráfico de ondas de David Weis. Muest
Una de las secuencias numéricas se llama "Secuencia de incendios forestales". Ha sido reconocida como una de las secuencias nuevas más bellas. Su característica principal es que esta secuencia evita tendencias lineales, incluso las más cortas. Es esta propiedad la que formó la base de este indicador. Al analizar una serie de tiempo financiera, este indicador intenta rechazar todas las opciones de tendencia posibles. Y solo si falla, entonces reconoce la presencia de una tendencia y da la señal
The Penta-O is a 6-point retracement harmonacci pattern which usually precedes big market movements. Penta-O patterns can expand and repaint quite a bit. To make things easier this indicator implements a twist: it waits for a donchian breakout in the right direction before signaling the trade. The end result is an otherwise repainting indicator with a very reliable trading signal. The donchian breakout period is entered as an input. [ Installation Guide | Update Guide | Troubleshooting | FAQ | A
Los compradores de este producto también adquieren
FxaccurateLS
Shiv Raj Kumawat
WHY IS OUR FXACCCURATE LS MT5 THE PROFITABLE ? PROTECT YOUR CAPITAL WITH RISK MANAGEMENT Gives entry, stop and target levels from time to time. It finds Trading opportunities by analyzing what the price is doing during established trends. POWERFUL INDICATOR FOR A RELIABLE STRATEGIES We have made these indicators with a lot of years of hard work. It is made at a very advanced level. Established trends provide dozens of trading opportunities, but most trend indicators completely ignore them!
Ahora $ 147 (aumentando a $ 499 después de algunas actualizaciones) - Cuentas ilimitadas (PC o Mac) Manual de usuario de RelicusRoad + Videos de capacitación + Acceso al grupo privado de Discord + Estado VIP UNA NUEVA MANERA DE VER EL MERCADO RelicusRoad es el indicador comercial más poderoso del mundo para divisas, futuros, criptomonedas, acciones e índices, y brinda a los comerciantes toda la información y las herramientas que necesitan para mantenerse rentables. Brindamos análisis téc
Fxaccurate TCT
Shiv Raj Kumawat
WHY IS OUR FXACCCURATE TCT MT5 THE PROFITABLE ? Gives entry, stop and target levels from time to time. It finds Trading opportunities by analyzing what the price is doing during established trends. We have made these indicators with a lot of years of hard work. It is made at a very advanced level. Established trends provide dozens of trading opportunities, but most trend indicators completely ignore them! The trend reveals trading indicator represents an average of 10 different trades per trend
TrendMaestro5
Stefano Frisetti
note: this indicator is for METATRADER4, if you want the version for METATRADER5 this is the link:  https://www.mql5.com/it/market/product/108106 TRENDMAESTRO ver 2.4 TRENDMAESTRO recognizes a new TREND in the bud, he never makes mistakes. The certainty of identifying a new TREND is priceless. DESCRIPTION TRENDMAESTRO identifies a new TREND in the bud, this indicator examines the volatility, volumes and momentum to identify the moment in which there is an explosion of one or more of these data a
ESTE INDICADOR, BASADO EN INTELIGENCIA ARTIFICIAL, identifica posibles puntos de reversión del mercado leyendo la huella y señala CON ANTICIPACIÓN pequeños movimientos del mercado antes de que ocurran. A diferencia de los indicadores de precio y volumen, que generan entradas "tardías", es decir, cuando ya se ha producido una confirmación en el precio o en el volumen de un cambio de dirección y, por lo tanto, a menudo el movimiento ya ha terminado, este indicador señala, basándose en lo que lee
Go Way TREND
Ywsf Hsyn Hmad Alrsh
Vaya con la tendencia. Sí, espere la señal de entrada, ya sea de compra o venta, en un cuadro de 15 minutos, y verifique la señal si aparece en un cuadro de 30 minutos (a veces la señal tarda una hora o más en aparecer. Puede regresar al cuadro de 15 minutos y regrese al cuadro de 30 minutos, y repita esto hasta que le aparezca la señal principal. Si la señal aparece en el cuadro de 30 minutos, ingrese con el precio y se obtendrá la ganancia cuando cambie la línea del dibujo. , se registran gan
Satoro mt5
Mykhailo Lozhkin
An indicator based on time-tested trading methods that gives a signal that the market is overbought or oversold in a certain period of time The indicator does not disappear when it appears, easy to use Suitable for any trade It can be used on any currency pair or crypto He performed best in the period H1,H4,daily After the purchase, you will also receive a seller's template with settings The seller uses it more for trading on cryptocurrency After the purchase, I also keep in touch
IVISTscalp5
Vadym Zhukovskyi
5 (5)
Te presentamos el indicador iVISTscalp5, que no solo es único sino también efectivo en operaciones de trading. Este indicador se basa en datos temporales y es el resultado de muchos años de experiencia y análisis profundo de los mercados financieros. El indicador iVISTscalp5 es una excelente herramienta para el trading manual. La conveniencia, simplicidad y visualización, toda la complejidad está oculta en su interior. Hemos simplificado al máximo la configuración y uso del indicador iVISTscalp5
Introduction to X3 Chart Pattern Scanner X3 Cherart Pattern Scanner is the non-repainting and non-lagging indicator detecting X3 chart patterns including Harmonic pattern, Elliott Wave pattern, X3 patterns, and Japanese Candlestick patterns. Historical patterns match with signal patterns. Hence, you can readily develop the solid trading strategy in your chart. More importantly, this superb pattern scanner can detect the optimal pattern of its kind. In addition, you can switch on and off individu
Boom and Crash Trend Detector is a  Non-Repaint   MT5 trading system usually being sold for 50 0$ . Most people use this for Deriv but can be used to forex too. The boom and crash spike indicator is a spike detecting software, with Multiple features, these features include. Spike Alert ( from 10 to 100-second warning before spike) Continues spike Alert (for double or continuous spikes at a time) supports all Boom/crash Indices M6 time frame works best here . Bigger time frame trend pointer f
Piranha version 2
Maria Strudov
5 (1)
"Piranha" - an autonomous trading system that determines overbought and oversold levels on the chart. Red and blue zones represent overbought and oversold levels respectively. Entry points are marked with arrows: a downward arrow in the red zone for "sell" and an upward arrow in the blue zone for "buy". The Take profit level is indicated by the green moving average. Key features: Adjusting the Take profit level as the green moving average changes position. Averaging ability when a new market e
The iChannels
BeeXXI Corporation
5 (2)
Ultra-fast recognition of parabolic channels (as well as linear, horizontal and wavy channels) throughout the depth of history, creating a hierarchy of channels. Required setting: Max bars in chart: Unlimited This indicator is designed primarily for algorithmic trading, but can also be used for manual trading.  This indicator will have a very active evolution in the near future and detailed descriptions on how to apply to create robots
SMCpro
Arief
5 (1)
Currently Price  20% OFF  ( for unlimited use ) Indicator   USER MANUAL , trade setups, solving issues, etc :  Direct Download Here     (  for users only  ) Hello World! Introducing.. SMCpro tool and Indicator for  MetaTrader 5 , a cutting-edge feature designed to revolutionize your trading experience. With innovative ICT Smart Money Concept, you gain unparalleled insight into market dynamics, empowering you to make informed trading decisions like never before. SMC Indicator built on th
El Oscilador de Índice de Precisión (Pi-Osc) de Roger Medcalf de Precision Trading Systems La versión 2 ha sido cuidadosamente recodificada para cargar rápidamente en su gráfico y se han incorporado algunas otras mejoras técnicas para mejorar la experiencia. El Pi-Osc fue creado para proporcionar señales precisas de temporización de operaciones diseñadas para encontrar puntos de agotamiento extremos, los puntos a los que los mercados se ven obligados a llegar solo para eliminar las órdenes
Matreshka
Dimitr Trifonov
5 (1)
Matreshka self-testing and self-optimizing indicator: 1. Is an interpretation of the Elliott Wave Analysis Theory. 2. Based on the principle of the indicator type ZigZag, and the waves are based on the principle of interpretation of the theory of DeMark. 3. Filters waves in length and height. 4. Draws up to six levels of ZigZag at the same time, tracking waves of different orders. 5. Marks Pulsed and Recoil Waves. 6. Draws arrows to open positions 7. Draws three channels. 8. Notes support and re
"CYBERBOT PROJECT"  The first unique product on the MQL5 market > One file Indicator contains Dozens of Indicators + 5 Oscillators including advanced mastermind capabilities simultaneously for 8 Pairs + 8 Timeframes + 8 Shadows  as well as the presence of horizontal lines for Pivot, Support and Resistance which will be adjusted automatically every day [All in one chart]. Currently, the product's selling price is over $480; however, we are offering a monthly rental system for only $30. This all
All in One package includes the  Oscillator Predictor ,  MACD Predictor ,  Thrust Scanner  and  Advanced Fibonacci  indicators which are mandatory for applying  Dinapoli  trade plans.  Please visit below links for detailed explanations of indicators. Advanced Fibonacci Indicator =>  https://www.mql5.com/en/market/product/107933 Thrust Scanner Indicator =>  https://www.mql5.com/en/market/product/52829 Overbought /Oversold Predictor indicator => https://www.mql5.com/en/market/product/52628 Macd
Limited Offer:    Take advantage of our limited-time offer on the FxBears Powers Indicator! When you purchase this powerful tool, you'll also receive the renowned FxBears EA, an expert advisor that automatically executes the indicator's signals. Don't miss out on this unbeatable combination to enhance your trading strategy! No more losses with this indicator, test it for years ago and see if there is losses in one day results. but before testing it please see the explaining video down here. 
Contact us to receive a comprehensive user guide after purchasing. William Delbert Gann, commonly known as W.D. Gann, was an exceptional market analyst renowned for his unique trading style in the early 20th century.  His trading techniques were based on a blend of mathematics, geometry, astrology, and ancient mathematics. Gann believed that stock market movements followed specific patterns and cycles, rather than being random. His methodologies, celebrated for their accuracy and relevance, con
VTrende Pro
Andrii Diachenko
5 (1)
VTrende Pro - MTF indicator for trend trading with a display panel for MT5 *** Videos can be translated into any language using subtitles (video language - Russian) Although the signals of the VTrende Pro indicator can be used as signals of a full-fledged trading system, it is recommended to use them in conjunction with the Bill Williams TS. VTrende Pro is an extended version of the VTrende indicator. Difference between Pro version and VTrende: - Time zones - Signal V - signal 1-2 waves
The indicator is designed to close positions on the market in time. For example: to take profits ahead of schedule if the price has not reached TakeProfit, and the market is turning around. The indicator analyzes the momentum, not the trend. He does not give any information about the trend. The indicator is well suited for finding divergence. The Ershov 38 Parrots indicator dynamically adjusts to the market and detects price movement impulses of medium and high amplitude. It almost does not rea
VIP Buy Sell Signals
Hapu Arachchilage Tharindu Lakmal
Here is a Live DEMO testing account for the indicator. ( Profit proofs ) Login (MT5) - 100246 Server - FusionMarkets-Demo Investor PW - VIPindicator@2024 Contact me through this email aaddress to download the FREE strategy PDF for this indicator tharindu999lakmal@gmail.com Introduction   The   "Buy Sell Signals"   is designed to provide BUY and SELL trade signals based on the current market conditions.   A   Profitable   Trading Strategy   (Chee sheet)   is provided for this trading indicato
El indicador genera señales de entrada para OPCIONES BINARIAS, dibujando una flecha en el gráfico y emitiendo una alerta audible. HORARIO DE FUNCIONAMIENTO: 6:00 GMT/ 17:00 GMT (no recomendado después de las 17:00 GMT y durante la noche debido a la volatilidad demasiado baja y la falta de volúmenes) PARES: EUR/USD (@EU6), GBP/USD (BP6). Plazos: 1,2,3,5,10,15 minutos Mejor marco de tiempo: 3 minutos CADUCIDAD: 1 vela El indicador necesita volúmenes reales (sin volúmenes de ticks) para
EQ Cutrim Theory
Marco Aurelio Santos Costa
Ronal Cutrim has been a dedicated mathematician for 14 years and has more than 10 years of experience in the financial market. The concept of the theory is simple, find imbalance between buyers and sellers. Which makes a lot of sense, because nothing goes up forever, nothing falls forever.   When you find an asset with a mathematical probability of unbalanced equilibrium, it is a great way to get into trading:  TUTORIAL: Turn on the subtitles, the video is subtitled
The SuperTrend MTF indicator is an excellent trend tracking indicator . It can not only display SuperTrend trends within the timeframe of the chart, but also set up to display SuperTrend trends for larger time frames simultaneously . This will be beneficial for grasping trends at a larger time scale and predicting future trends . At the same time, the price of the trend line can also be displayed at a glance, making it easy to observe. Input parameters :  ATR period used at chart timeframe 
Offer 249 down from 350 for the next 1 copies. then back to 350 $ Are you tired of using outdated indicators that leave you guessing where to set your profit targets? Look no further than the AK CAP Opening Range Breakout Indicator. This powerful tool is backed by a US patent and has already helped countless traders pass funded challenges like FTMO. We use it daily on our prop traders and internal funds, and now it's available to you as well. The calculation behind the indicator is incredibly
Smooth price for Monarch
Konstantin Gruzdev
5 (1)
The Smooth Price technical indicator is used for plotting a smoothed line as close to the price of the financial instrument as possible, and serves to eliminate its noise components. The indicator is part of the Monarch trading system, but here it is presented as an independent technical analysis tool. The indicator is based on the cluster digital filter , which, unlike the ClusterSMA , is applied directly to the price time series. Smooth Price does not redraw (except the very last, zero bar) an
BookMap HeatMap
Roberto Spadim
1 (2)
This Indicator creates a heatmap based on depth of market of the current symbol or another symbol. Other symbol is useful when you trade futures market and a contract has 'mini' and 'full' split. For example, in Brazil (B3 - BMF&Bovespa), WDO and DOL are future Forex contract of BRL/USD (where 1 DOL = 5 WDO) and big banks work mostly with DOL (where liquidity is important). Please use with M1 timeframe , objects are too small to be displayed at higher timeframes (MT5 limit). The number of level
Классификатор силы тренда. Показания на истории не меняет. Изменяется классификация только незакрытого бара. По идее подобен полной системе ASCTrend, сигнальный модуль которой, точнее его аппроксимация в несколько "урезанном" виде, есть в свободном доступе, а также в терминале как сигнальный индикатор SilverTrend . Точной копией системы ASCTrend не является. Работает на всех инструментах и всех временных диапазонах. Индикатор использует несколько некоррелируемых между собой алгоритмов для класси
Gartley Projections D
Oleksandr Medviediev
3 (2)
El indicador identifica los patrones armónicos (XABCD) según los desarrollos de H.M.Gartley ("Beneficios en el mercado de valores", 1935г). Proyecta el punto D como un punto en la proyección en perspectiva (especifique ProjectionD_Mode = true en la configuración). No vuelve a dibujar. Cuando se cierra una barra del período de trabajo, si el punto del patrón identificado no se ha movido durante las barras Patterns_Fractal_Bars, aparece una flecha en el gráfico (en la dirección del movimiento
Filtro:
No hay comentarios
Respuesta al comentario