Auto Trend Fit
- Indicadores
- Ross Adam Langlands Nelson
- Versión: 1.0
Automatic Trend Line Fit.
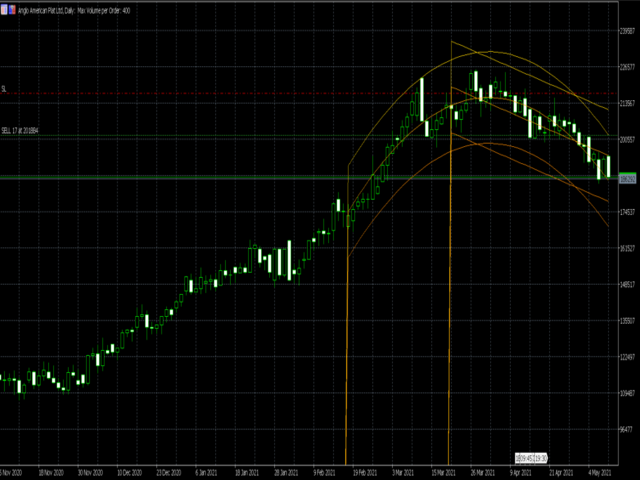
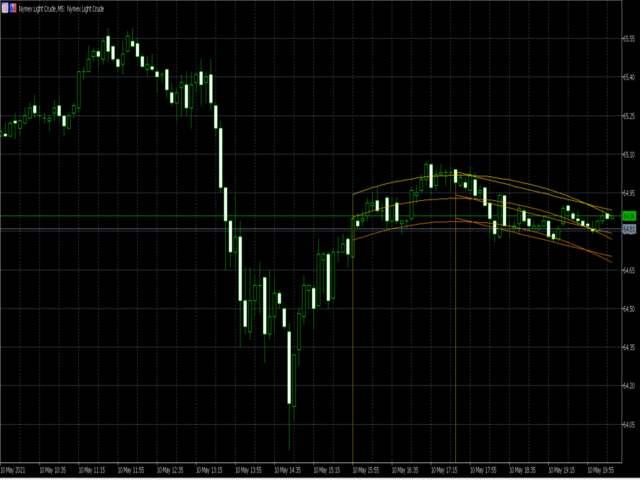
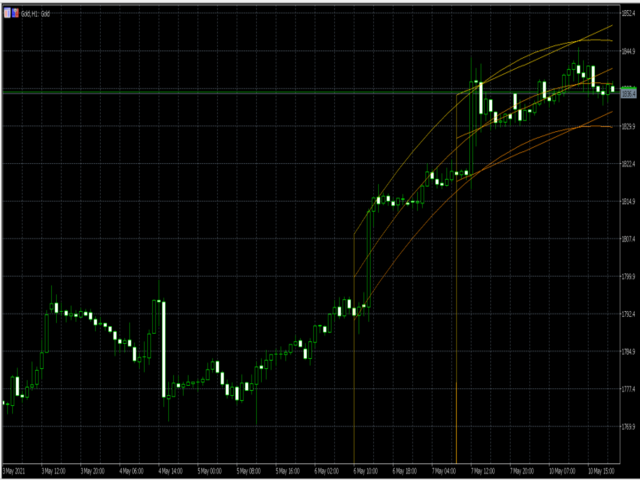
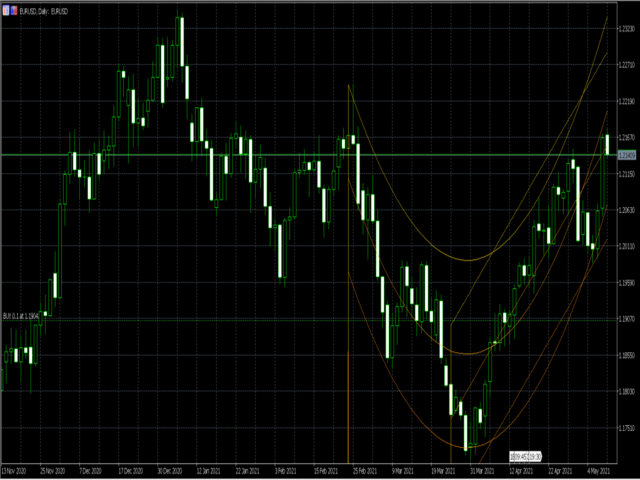
This indicator automatically plots the straight line and parabolic (curved) trend to any symbol at any timeframe. The plotted straight line is a good indication of the current trend and the curved line is an indication of a change momentum or change in the current trend.
Plotting the straight line over about 2/3 the number of candles as the curved line is usually a good way to determine entry and exit points as it shows the current trend and momentum of the market.
This indicator also gives the option of plotting a channel around both the straight line and curved line for more well timed entry and exit points. This channel is set at a multiple of the ATR above and below the trend lines.
The inputs required are the number of candles to fit the curved line to (numCurve), the number of candles to fit the straight line to (numStraight) and the ATR multiple to set the channel lines (ATRBounds).



I am overjoyed to see the indicator you invented, because I am looking everywhere for the parabolic line indicator. Although it differs from your concept, its essence is the same. I really like your indicator. Can you provide me with the code for this indicator? If possible, I would greatly appreciate it. Thank you