Tick Chart
- Indicadores
- Maxim Romanov
- Versión: 1.1
- Actualizado: 24 marzo 2020
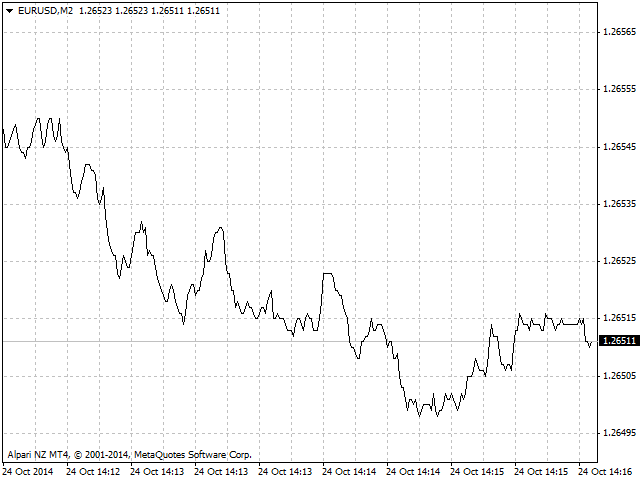
As we know, МТ4 and МТ5 do not store tick history, which may be necessary to develop trading strategies and market analysis. I have developed a method allowing you to receive tick history very easily. The indicator gathers tick history in real time and writes it to XXXXXX2.hst file, where XXXXXX is a symbol name. This file can be used to create an offline chart or something else. If you use a trading robot, then launch the indicator and control your broker by examining the spread and quotes. All price movements are recorded in the history. If you have any doubts concerning stop loss activation, you can simply look at the tick chart. You might want to sell the obtained tick history to other traders.
The indicator records BID and ASK prices. That looks as follows on candle charts:
- open=Ask;
- high=Ask;
- close=Bid;
- low=Bid.
If you set a line chart, only BID price is displayed.
The history can be copied to any terminal. The history is stored in the terminal folder corresponding to your broker and trade account \history\Broker-ECN-Demo.
Initially, I have developed the indicator for other purposes. Using Operational TimeFrame script, I create non-standard Time Frame charts from the tick ones. This is Time Frame after a specified amount of ticks or points. In other words, the bar is closed not in the course of time, but after N ticks or points are passed by the price, depending on what I want to receive. So, we perform operational sampling, not time one. Such charts are much easier to analyze. Patterns, including the fractal ones, can be detected much more clearly on them. I think these charts to be "correct", since they reflect the very essence of the market processes.
