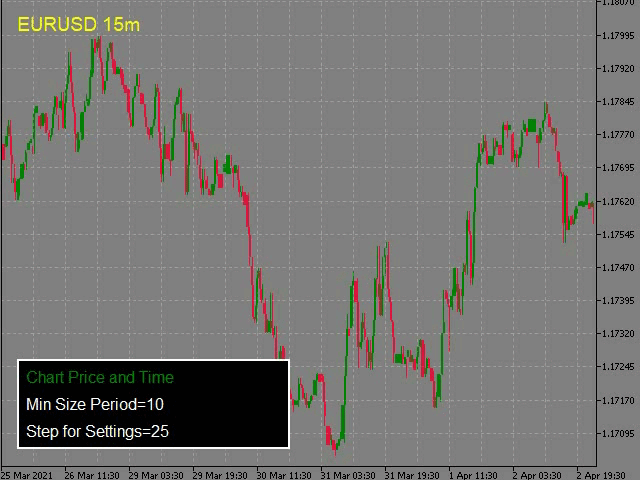
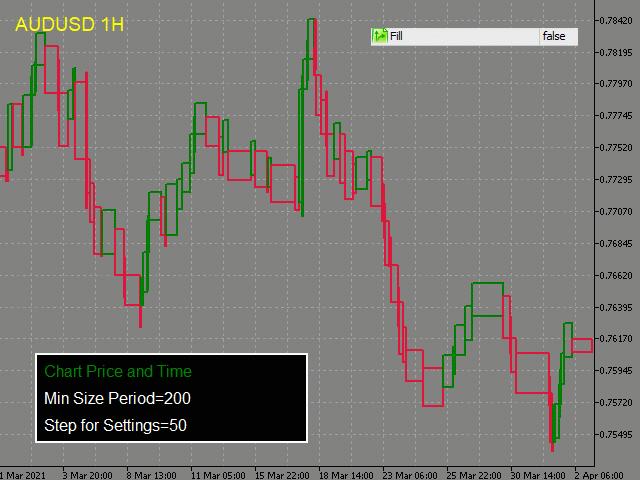
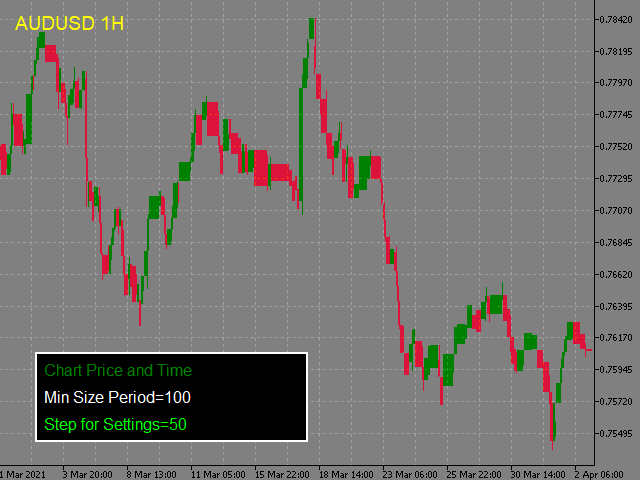
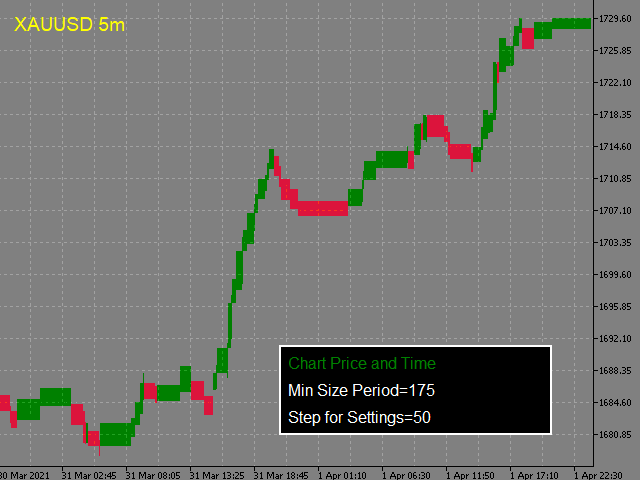
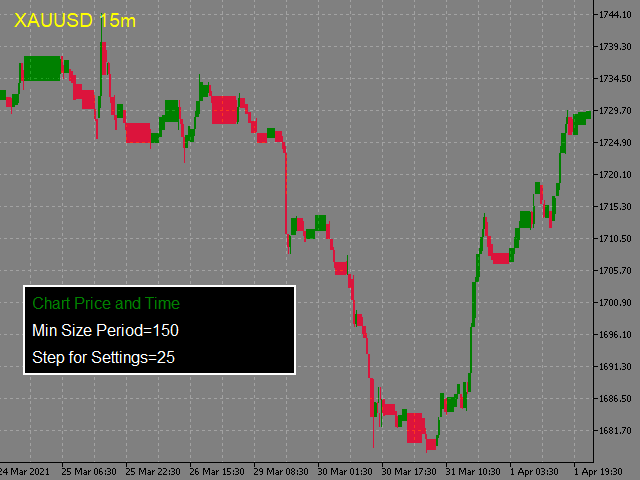
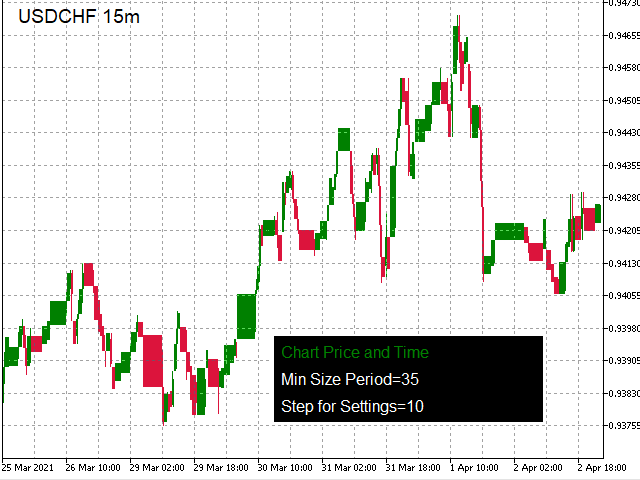
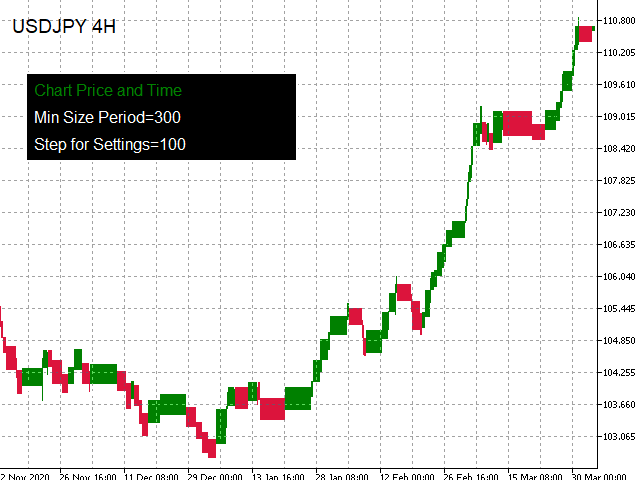
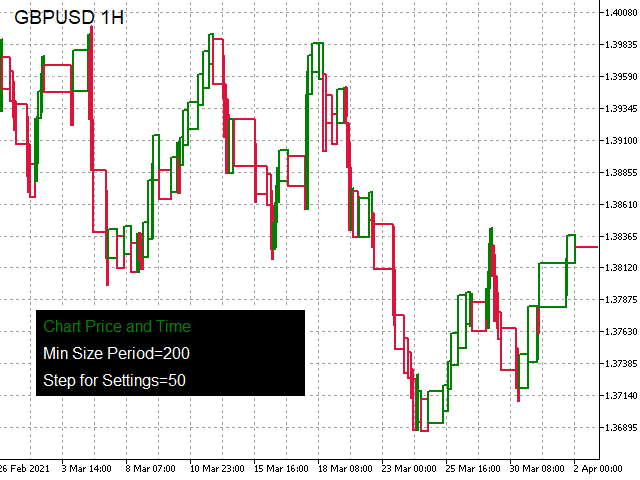
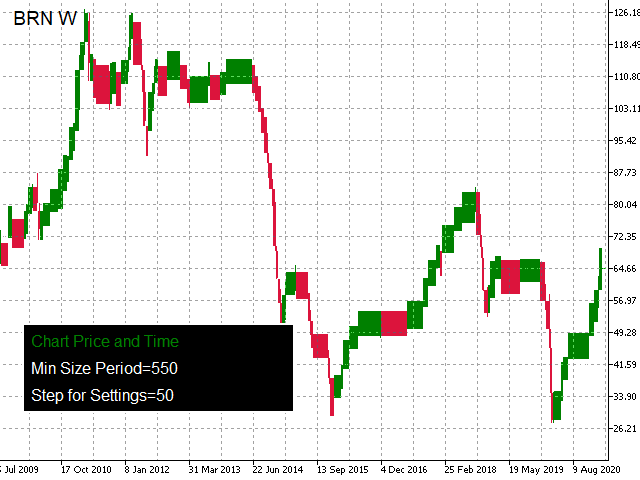
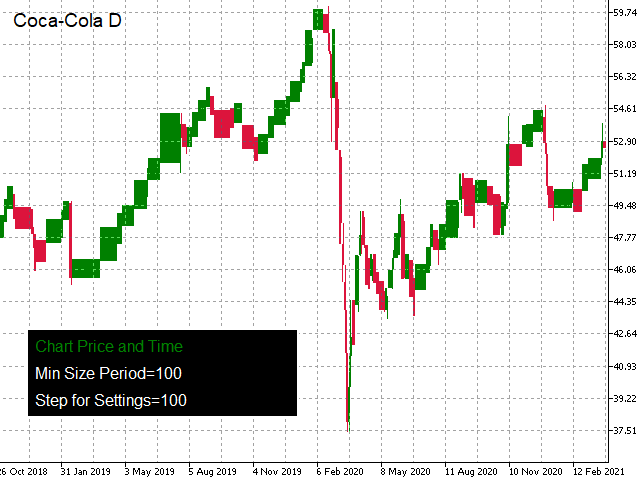
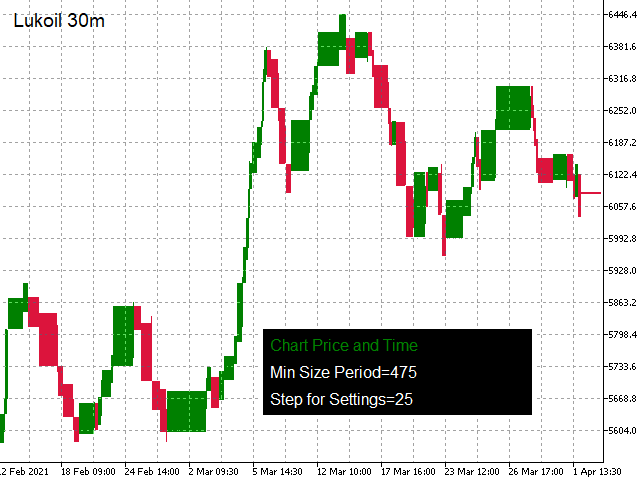
Chart Price and Time
- Indicadores
- Pavel Verveyko
- Versión: 1.1
- Actualizado: 24 octubre 2021
- Activaciones: 10
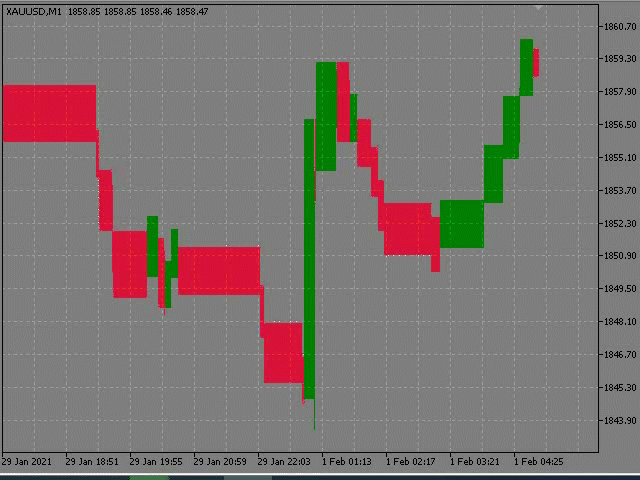
The indicator displays a stock chart of a non-standard type, in which the price and time have the same value.
The usual chart of Japanese candlesticks does not take into account all the information that the time analysis can give. Renko charts do not use all the information that price can give in relation to time. The "Chart Price and Time" indicator takes into account price and time equally and shows the predominance of price or time.
Taking into account price and time equally gives an idea of the price speed, support/resistance levels, level breakouts or failed breakout attempts, sharp movements, prolonged trading corridors, the prevailing trend.
The predominance of time (the rectangle is larger in width than in height) indicates that the price could not overcome the price threshold for a long time.
The predominance of the price (the rectangle is larger in height than in width) indicates that the price is full of power.
Trend: the more rectangles of the same color, with the predominance of the price, the more pronounced the trend is.The indicator does not redraw.
The indicator has a table for setting parameters (does not work in the tester).
The settings are saved for each instrument and each time period.
The size of the table depends on the font size of the table selected in the settings.
The parameter table can be dragged with the mouse.
Settings
- History_Size - size of the displayed history.
- Color_Up - color of the upward movement.
- Color_Down - color of the downward movement.
- Fill - the rectangle is empty or filled with color (it has a big impact on the perception of the price).
- Border_Width - fill thickness of empty rectangles (if Fill=false).
- Tooltip - enable/disable the tooltip (the upper, lower price of the rectangle and the height of the rectangle).
- Min_Size_Period - for each time period, you can set your own indicator parameter (not taken into account when the parameter adjustment table is enabled!).
- Show_Settings - hide/display the parameter adjustment table.
- STEP_for_Settings - step of changing the Min_Size_Period parameter in the parameter adjustment table.
- Settings_Fontsize - font size of the parameter adjustment table.
- Settings_Font - font of the parameter adjustment table.
- Settings_Color_Text - text color of the parameter adjustment table.
- Settings_Color_Background - background color of the parameter adjustment table.
- Settings_Color_Active_plus - text color, when the mouse is hovered over, to increase the value in the parameter adjustment table.
- Settings_Color_Active_minus - text color, when the mouse is hovered over, to reduce the value in the parameter adjustment table.
El usuario no ha dejado ningún comentario para su valoración