Moving Support and Resistance Levels Indie
- Indicadores
- Opengates Success International
- Versión: 1.1
- Actualizado: 22 agosto 2022
- Activaciones: 10
Moving RnS Indicator is created for many functions which is highly useful for the traders. It is a versatile tool that can make whole lots of difference in a trader's trading career. If the best must be gotten from this tool, the trader must study the way it works especially as explained here and more can be discovered because of its functions. It can also be used along with other indicators but if understood well, it can be used alone to get good results.
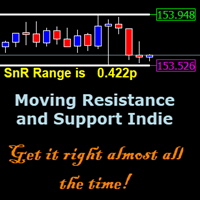
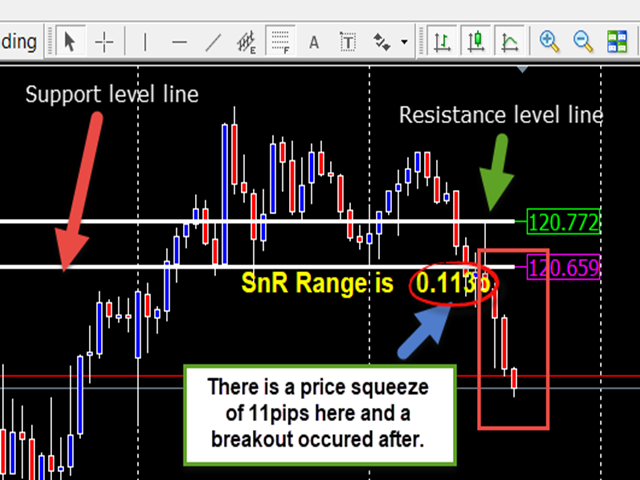
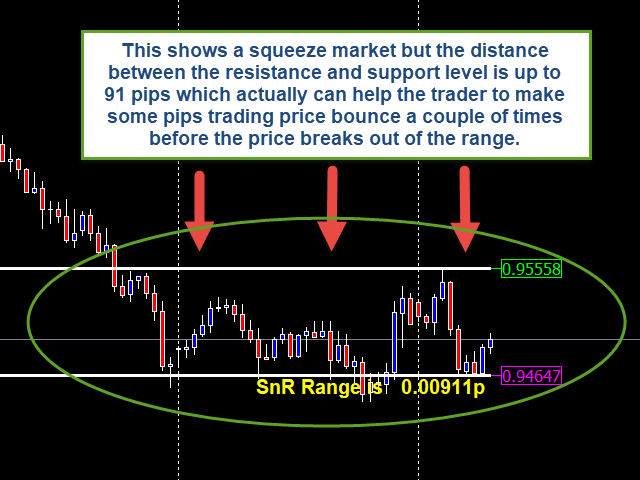
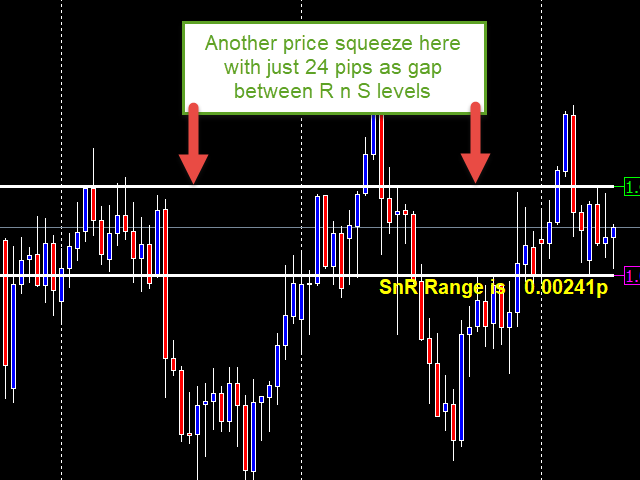
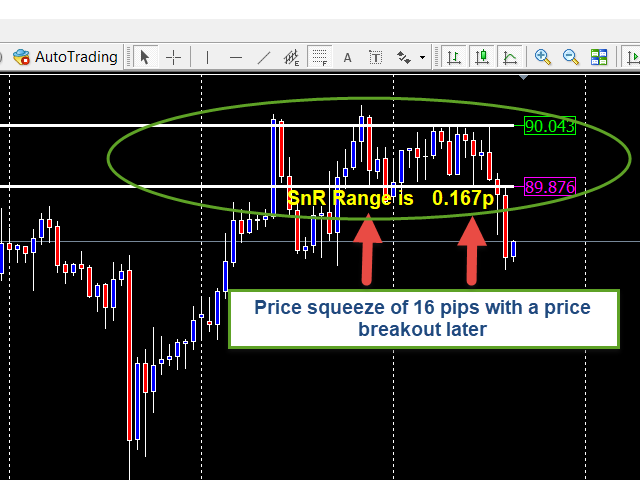
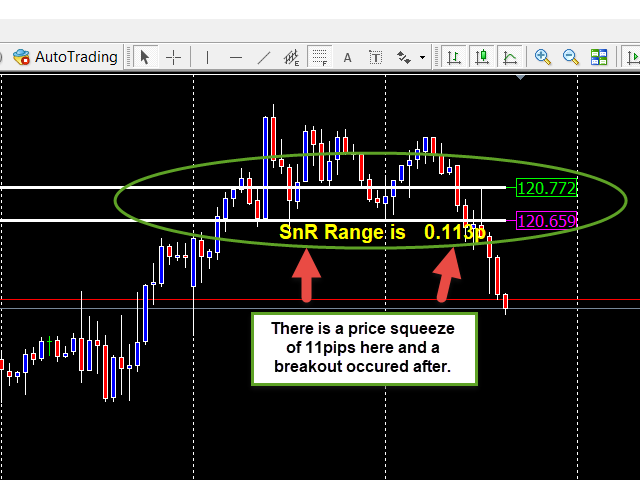
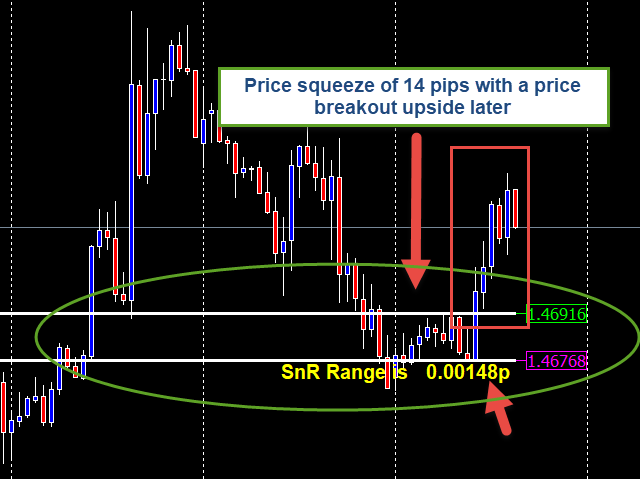
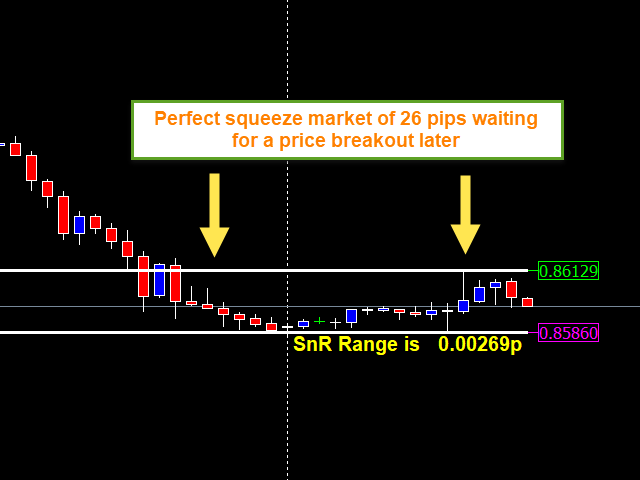
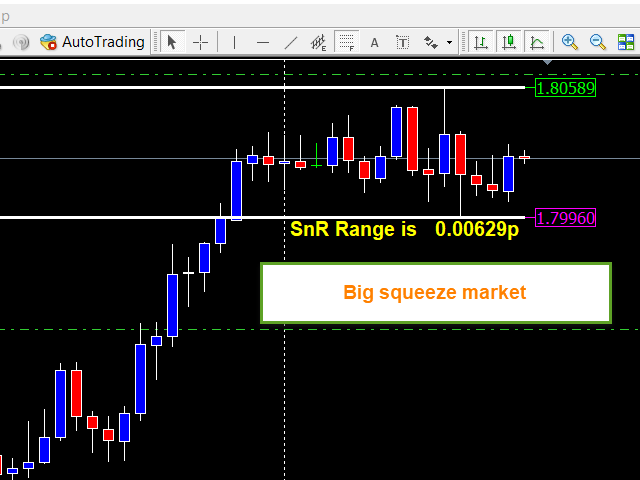
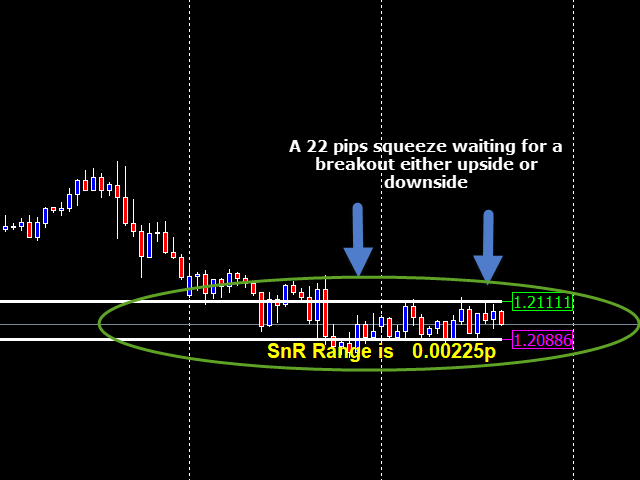
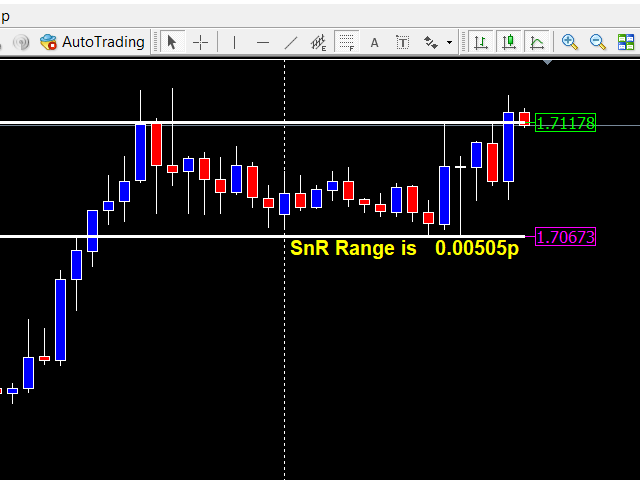
When attached, it starts moving according to the current Resistance and Support level drawing two horizontal lines across the chart (check the screenshots).
Among its usefulness are:
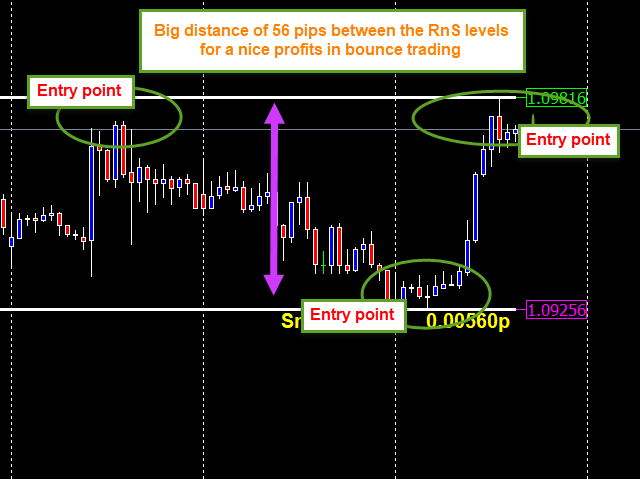
* It plots current Resistance and support levels so that the trader will know the position of the price within the two levels, this will caution the trader on when to enter a trade or not. It also can help the trader to make a timely decision, for instance, if the price is at the resistance or support level, the trader will know that he's supposed to wait for the market to decide what to do next before trading. For example, if the price is at resistance level, two things will either happen next: Price breakout or Bounce, so he can rightly decide to open Buystop pending order a few pips above the resistance level in case of a price breakout and open Sellstop pending order a few pips below the resistance level in case of price bounce and reversal especially if the distance between the resistance and support levels is somehow big like 50pips and above
* It is a common notion that whenever the price squeezes on the chart, it means that a breakout either up or down is imminent. So when you see the MOVING RnS Indicator SHOWS that the distance between the current resistance and support levels is less or equal to 20 pips (note that 20 pips will look like 200pips according to the digits of the price on the chart to avoid making mistake), then a breakout is sure. So the trader is expected to open two pending orders - Buystop and Sellstop above and below these levels for a nice ride.
* It also helps in clearly discovering the squeeze market to AVOID ranging or flat market.
* The next usefulness is that when it draws two horizontal long lines across the window chart and mark out the current resistance and support levels, extends them backward to show the resistance and support levels that had already occurred previously for as long as the trader can scroll backward on the charts, by this you can pick out the frequently occurred and strong resistance and support levels from the past to the current price. You know sometimes, the previous resistance level may become support level later as the price moves on, all these will be highly visible to the trader.
Entry: Pending Buystop, Sellstop, Sell and Buy
Exit (SL):
i. For Bounce Sell order, place your SL a few pips above resistance level
ii. For Bounce Buy order, place your SL a few pips below support level
iii. For Breakout Sell order, place your SL a few pips above resistance level
iv. For Breakout Buy order, place your SL a few pips below support level
Target:
i. For Bounce Sell order, place your TP a few pips above the support level within the RnS levels
ii. For Bounce Buy order, place your TP a few pips below the resistance level within the RnS levels
iii. For Breakout Sell order, you can claim 50 pips OR you can wait until the price moved far below your entry point and move your SL down a few pips below your entry point to breakeven and trail the price all the way until it reverses.
vi. For Breakout Buy order, you can claim 50 pips OR you can wait until the price moved far above your entry point and move your SL up a few pips above your entry point to breakeven and trail the price all the way until it reverses.
In a summary, you can use the MOVING RnS Indicator to trade both breakout and price bounce (reversal) with accurate breakout setting when the price squeezes and also a bounce trading when the price bounces back from resistance or support level with a great distance between both levels like 50 pips upward. Especially when you spot a bearish engulfing candle at the resistance level when the price reverses, then you are good to sell and when you spot bullish engulfing candle at the support level when the price bounces back and reverse, then you are good to buy.
Thanks and enjoy your green pips without stress!
