Multi Time Frame EMA
- Indicadores
- Leonid Basis
- Versión: 3.5
- Activaciones: 5
The MA is a simple tool that smooths out price data by creating a constantly updated average price.
The average is taken over a specific period of time.
This is a Multi Time Frame Exponential Moving Averages indicator.
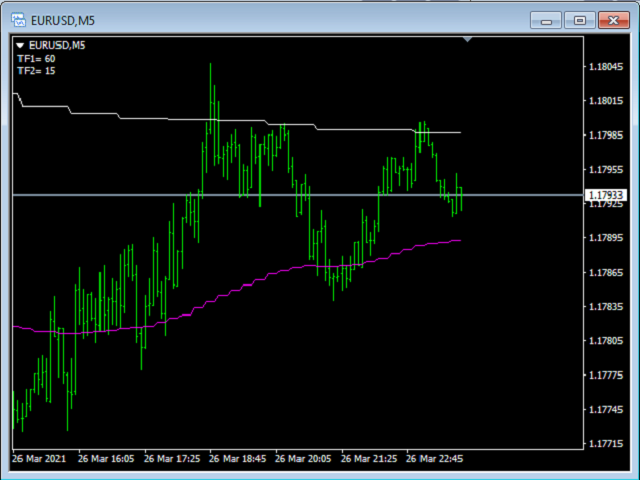
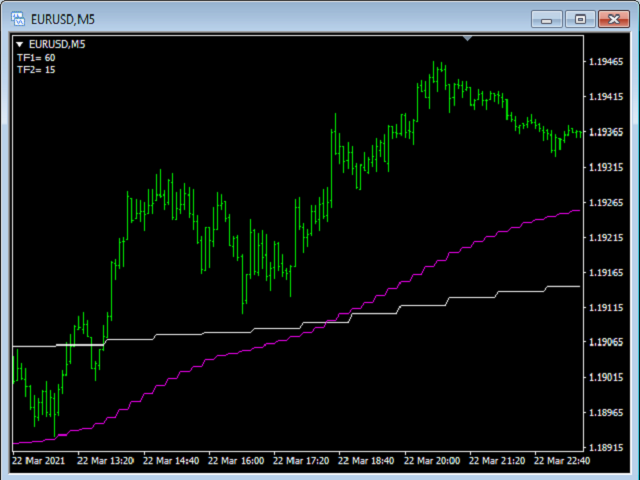
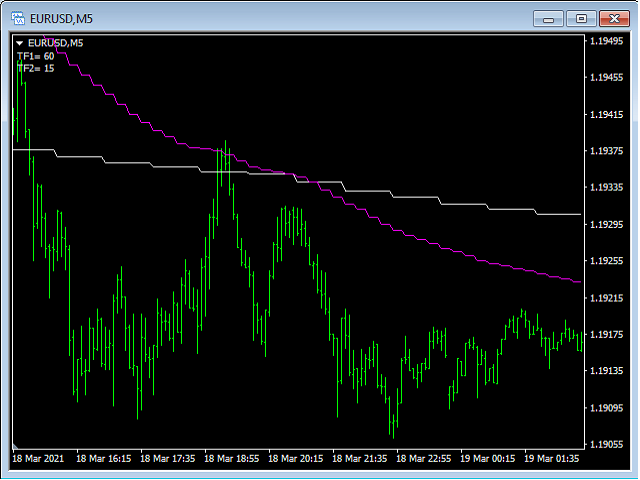
It made for a M5 TF and shows a Moving Average data from H1 (white line) and M15 (magenta line).
If a M15 EMA crossed a H1 EMA from bottom up then you may go Long.
If a M15 EMA crossed a H1 EMA from top down then you may go Short.


