Trend histogram Mefistofel
- Indicadores
- Nikolay Mitrofanov
- Versión: 2.2
- Actualizado: 16 abril 2021
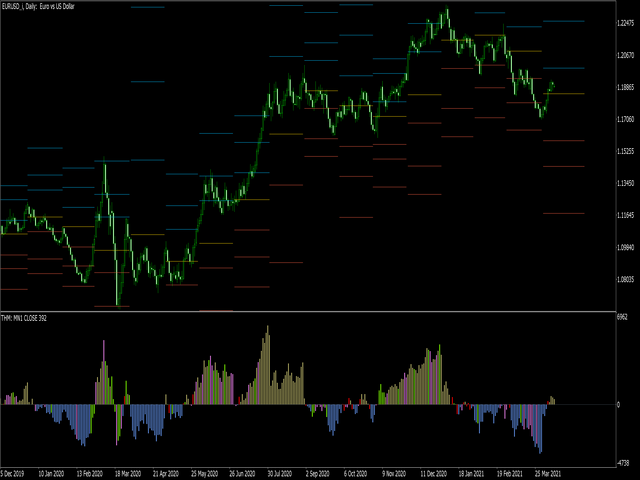
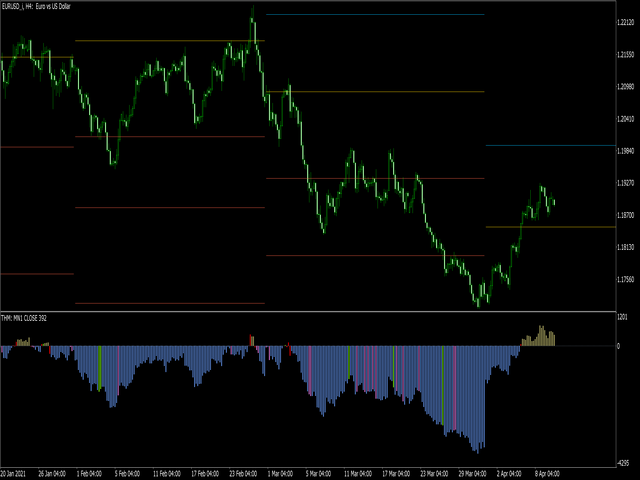
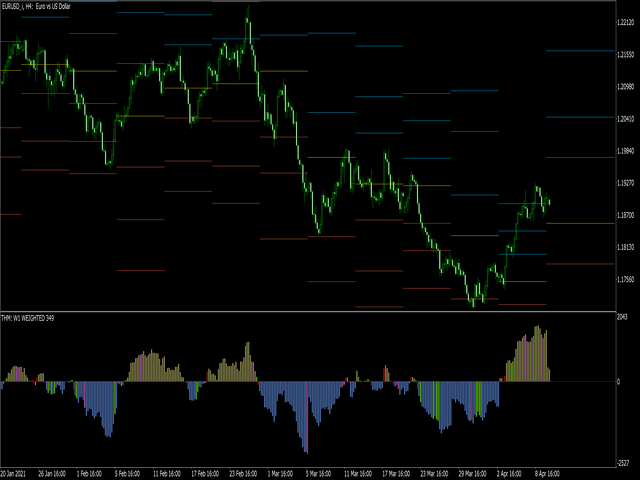
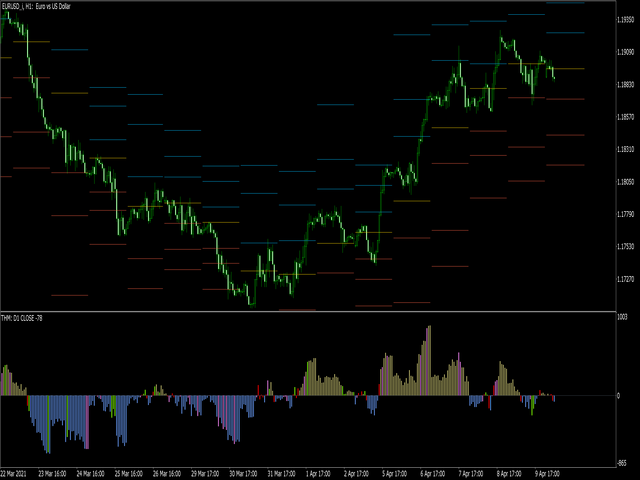
Calculates pivot levels.
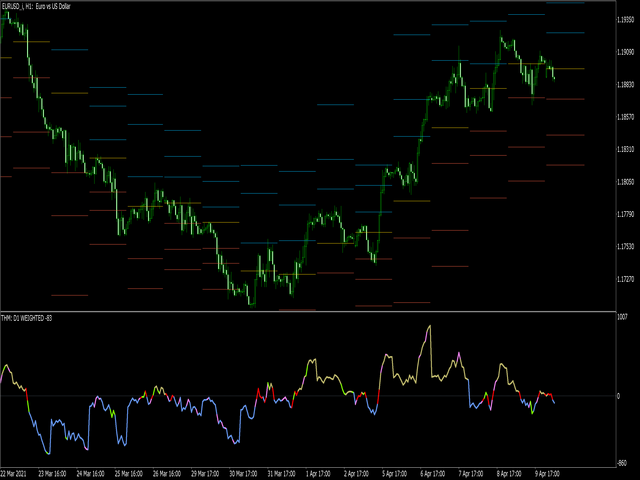
It paints the histogram depending on the location of prices relative to these levels.
Parameter values:
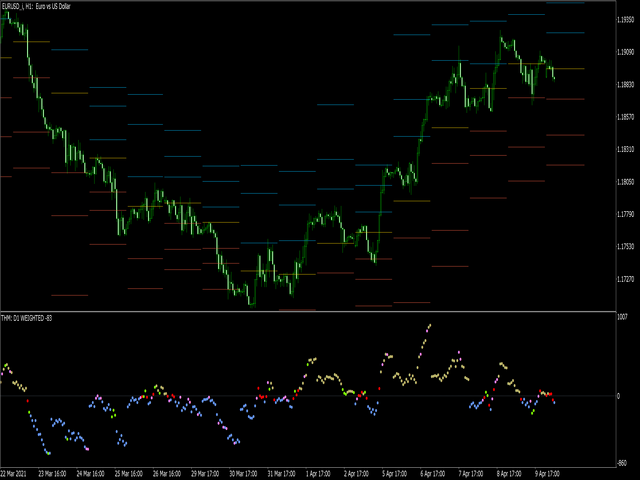
- style - select the type of display (Histogram, Line, Arrow)
- price - price, has little effect on the final look, but this can be customized
- timeframe - select a timeframe for calculating levels.
- color over pivot line - color of everything above the pivot level
- color under pivot line - color of everything below the pivot level
- pivot line intersection color - the color when the body of the candlestick crosses the center line
- color of resistance level breakout - color when the upper shadow of the candlestick crosses any level
- color of support level breakout - the color when the lower shadow of the candlestick crosses any level
- two lines intersection color - the color when two shadws crosses levels
- boost the result with tick volumes - multiplies the calculation result by the number of ticks of the candle
A choice of level options.
- MN1
- W1
- D1
- H12
- H8
- H6
- H4
- H3
- H2
- H1
If the indicator value is near 0, then the price has approached the potential level of reversal or rebound.
Formulas:
Pivot = (high + close + low) / 3
R1 = (2 * Pivot) - low
S1 = (2 * Pivot) - high
R2 = Pivot + (R1 -S1)
R3 = high + (2 * (Pivot - low))
S2 = Pivot - (R1 - S1)
S3 = low - (2 * (high - Pivot))
The horizontal lines in the graph screenshots are shown for clarity. The indicator values are calculated from these lines.
To draw these lines, this utility was used: https://www.mql5.com/en/market/product/63805




El usuario no ha dejado ningún comentario para su valoración