MR Reversal Patterns 5
- Indicadores
- Sergey Khramchenkov
- Versión: 3.1
- Actualizado: 20 abril 2023
- Activaciones: 20
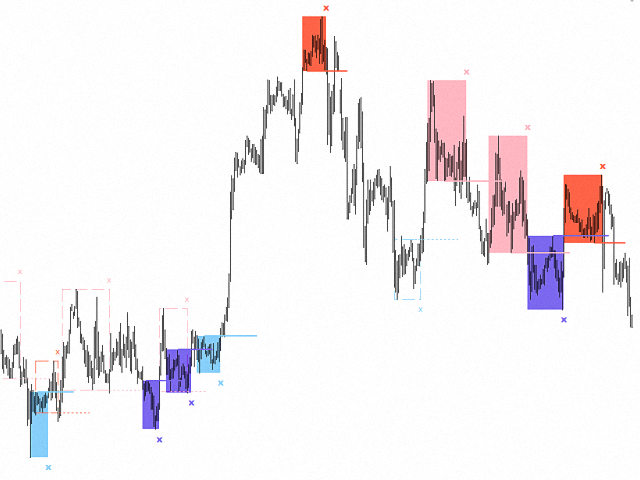
In the "Masters of Risk" trading system, one of the main concepts is related to places where markets change direction. In fact, this is a change in priority and a violation of the trend structure at the extremes of the market, where supposedly there are or would be stop-losses of "smart" participants who are outside the boundaries of the accumulation of volume. For this reason, we call them "Reversal Patterns" - places with a lot of weight for the start of a new and strong trend.
- Through the indicator you can see the changes in the trend structure of the market.
- The indicator shows the key places where the price movement changes its direction.
- The patterns contain accumulated volume in the market.
- The structure of the patterns is similar to the "MW" indicators, but is created from scratch by the author's methodology.
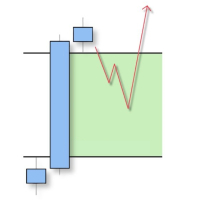
- Reversal pattern 1 - "Change of priority" (“Pereprior” in Russian language) indicates a strong change in trend direction or a tendency. It is characterized by updating the reasonable extremum Low from the uptrend and High from the downtrend.
- Reversal pattern 2 - "Violation of trend structure" (“Slom“ in Russian language) indicates a less pronounced change in trend direction or a tendency. It is also characterized by updating the reasonable extremum Low from the uptrend and High from the downtrend.
- Of the Patterns - "Reversal pattern 1" is more powerful than "Reversal pattern 2" for breaking the tendency of market movements.
- The indicator shows the "Structural levels" at which the price movement in a given direction has been broken. The structural level line continues to the first possible price test point where a breakout has occurred.
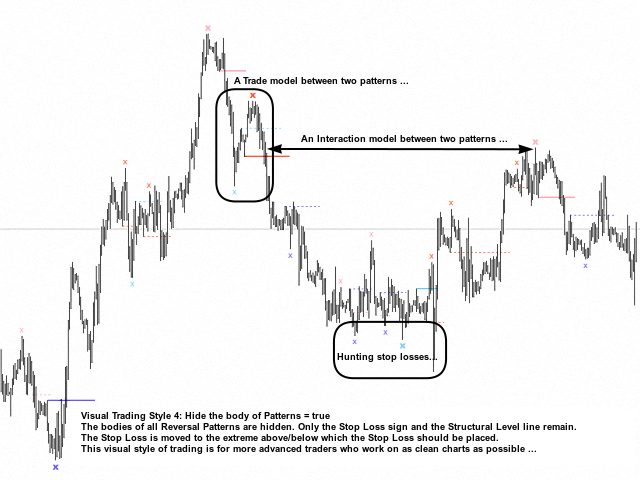
- Indicator shows "Stop loss" places. You can see how the "Big" players are hunting for stop losses.
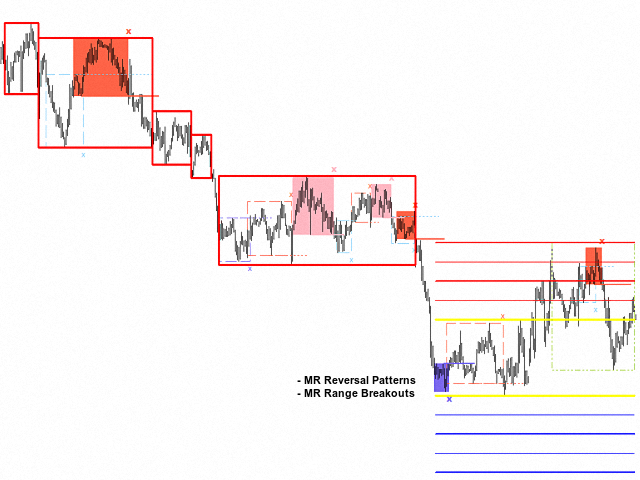
- In combination with the "MR Range Breakouts" indicator, you can see how buyers and sellers are distributed in the "Range". Since every trader waits for confirmation that their market entry is correct, the appearance of "Reversal Patterns" in the "Range" forms the accumulation of the open positions in a place, that we define as a "Point of Control" in the Volume Profile of the Range ". During the movement of the price in a trend, you can see how "Balances" are formed according to the "Auction Market Theory".
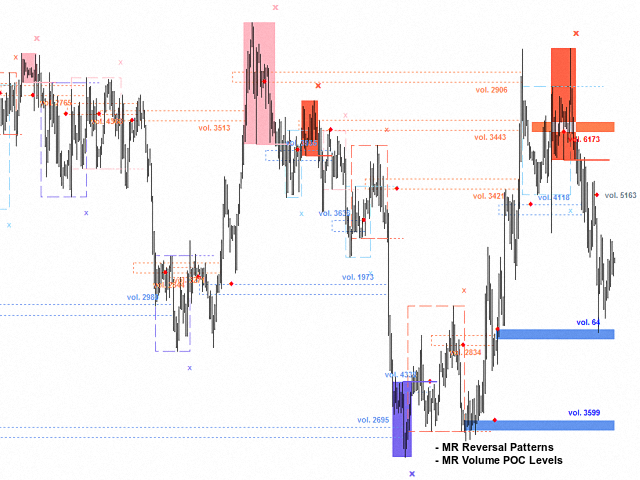
- In combination with the "MR Volume POC Levels" indicator, you can track key places where volumes are absorbed and then new volumes appear in the opposite direction.
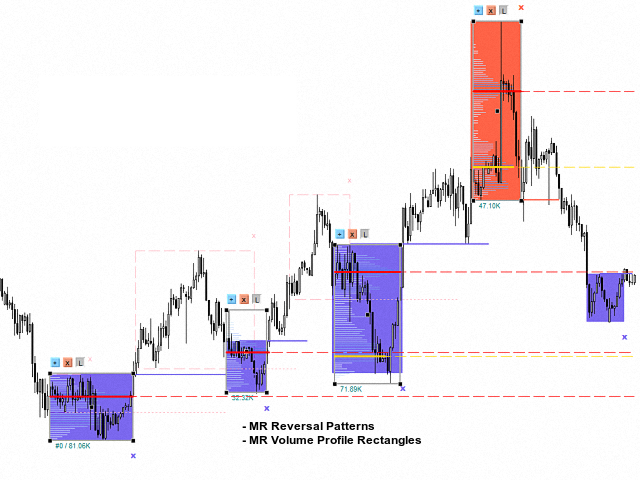
- In combination with the "MR Volume Profile Rectangles" indicator, you can see how the volumes are distributed in the "Reversal Patterns". Volumes in the "Reversal Patterns" structure are like fingerprints.
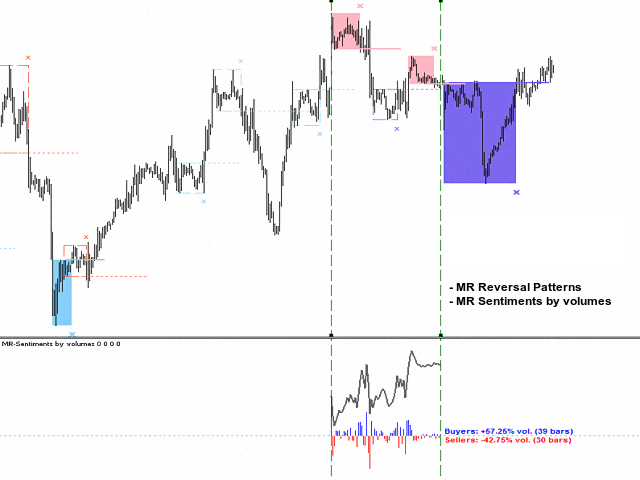
- In combination with the "MR Sentiments by volumes" indicator, you can see when the imbalance of volumes have weight when "Reversal patterns" appear and their combinations between them.
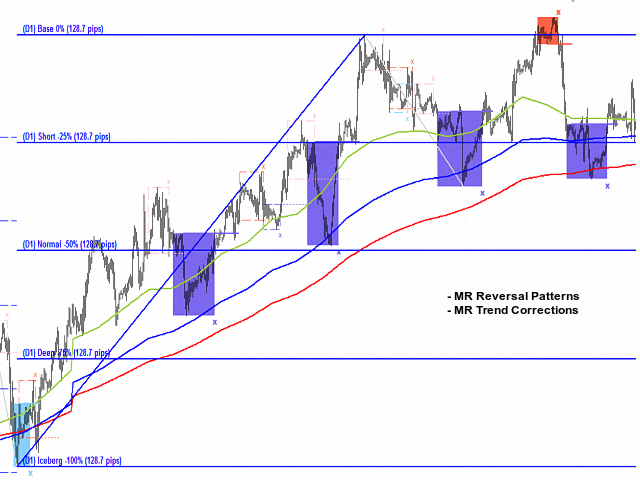
- In combination with the "MR Trend Corrections" indicator, you can track how the price moves in "Impulse" and where the price ends its corrections.
Note:
In the new version of the indicator, we use a formula to determine "Reversal Patterns" based on updating the extremes of the price movement. This gives us several advantages, such as more accurate determination of "Reversal Patterns", smaller stop losses and better entries along the price movement. For people who are used to the old scale of the patterns, you should select a higher time frame in the indicator settings. For example, an old formula for determining "Reversal Patterns" on the H1 time frame displayed patterns that you can now see if you select the H4 time frame in the indicator settings. It takes a little time to get used to the new way of defining "Reversal Patterns", but in time you will appreciate the new advantages!!!
If you liked the indicator, please support our work by giving 5 stars!!!
For MetaTrader 4 https://www.mql5.com/en/market/product/63854
How to use indicators - Article
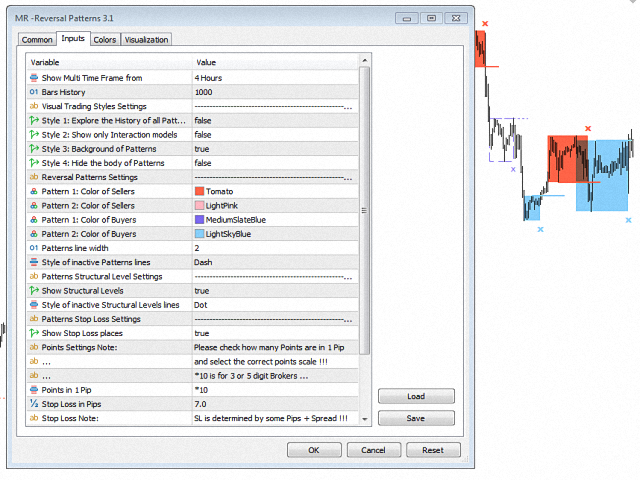
Indicator settings:
Show Multi Time Frame from - Multi time frame on which to calculate the indicator.By default, the indicator works with data from time frame H1.
Bars History - Number of bars on which the indicator works from multi time frame H1.
Section "Visual Trading Styles Settings"
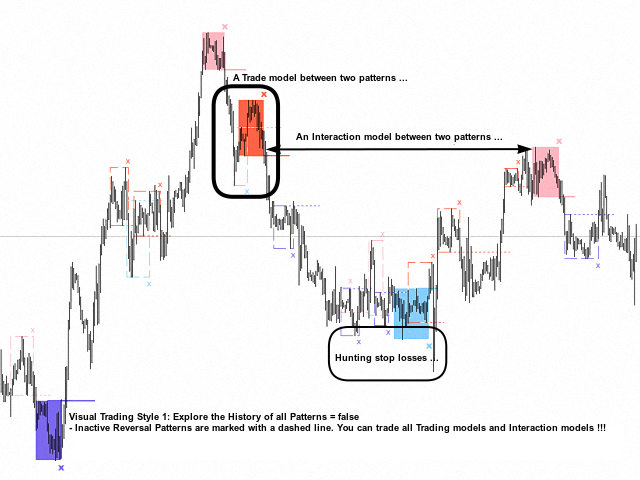
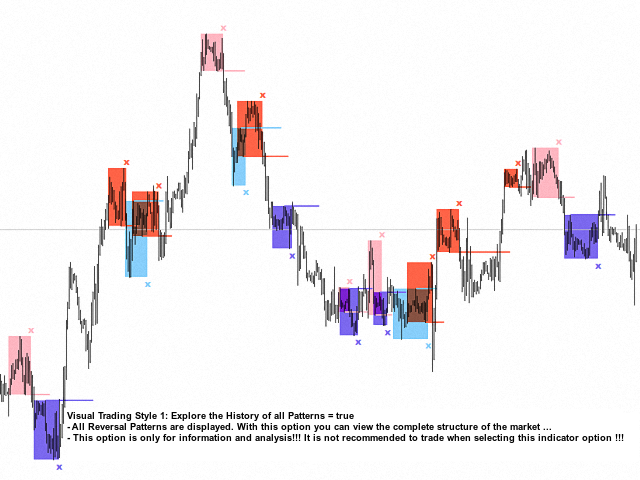
Style 1: Explore the History of all Patterns - Shows or not patterns closed by the price, with a dashed line and no background. If you have chosen "false", inactive "Reversal Patterns" are marked with a dashed line and you can trade all "Trading models" and "Interaction models". If you have chosen "true", all "Reversal Patterns" are displayed and you can view the complete structure of the market. This option is only for information and analysis!!!
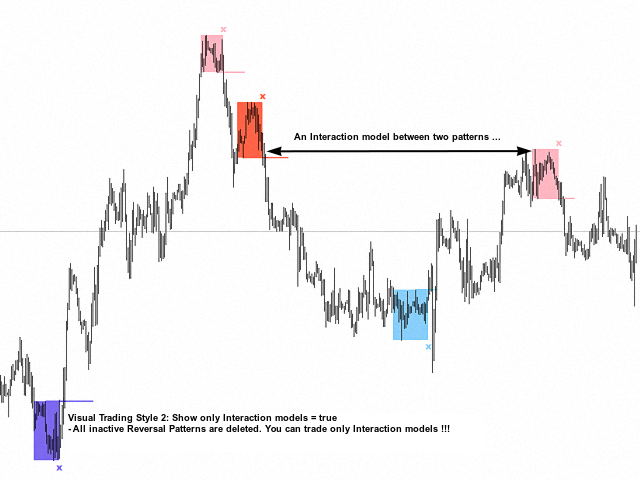
Style 2: Show only Interaction models - All inactive "Reversal Patterns" are deleted and you can trade only "Interaction models"!!!
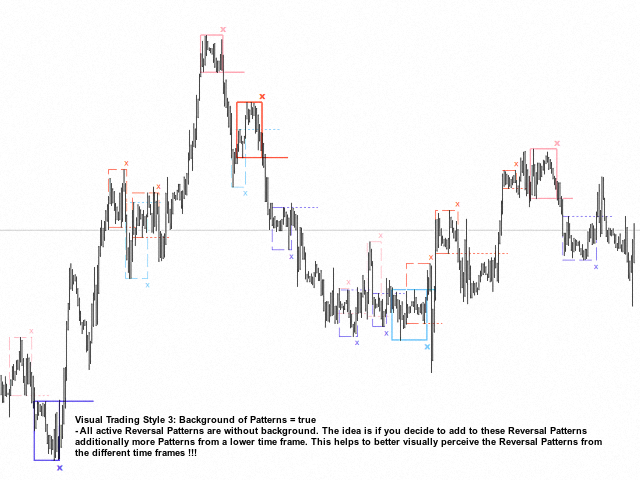
Style 3: Background of Patterns - Shows or not the background of the Reversal Patterns.
Style 4: Hide the body of Patterns - Shows or hide the body of Reversal Patterns. The body of the Patterns will become colorless to keep the alerts working. The Stop Loss changes its place from the end of the Patterns body to the extreme point where it should be set.
Section "Reversal Patterns Settings"
Pattern 1: Color of Sellers - Background color for Sellers Pattern 1. It also defines the color for displaying Structural Levels and Stop Losses.
Pattern 2: Color of Sellers - Background color for Sellers Pattern 2. It also defines the color for displaying Structural Levels and Stop Losses.
Pattern 1: Color of Buyers - Background color for Buyers Pattern 1 for Buy. It also defines the color for displaying Structural Levels and Stop Losses.
Pattern 2: Color of Buyers - Background color for Buyers Pattern 2. It also defines the color for displaying Structural Levels and Stop Losses.
Patterns line width - Shows the line width for Patterns and Structural Levels.
Style of inactive Patterns lines - You can choose how to display the body of the inactive Patterns.
Section "Patterns Structural Level Settings"
Show Structural Levels - Shows or not Structural Levels of Patterns.
Style of inactive Structural Levels lines - You can choose how to display the Structural Levels of Patterns.
Section "Patterns Stop Loss Settings"
Points in 1 Pip - Offers you a choice of the number of Points in 1 Pip.
Stop Loss in Pips - You choose the size of the stop loss. For example, a stop loss of 5 pips + a spread of 2 pips form a size of 7 pips for the total stop loss.
Stop Loss font size - You can choose the size of the stop loss symbol "x".
Section "Alert settings for Reversal Patterns"
Alert when created Reversal Pattern - Displays an alarm when a new Pattern is drawn.
Alert when Reversal Pattern is closed - Displays an alarm when a Pattern is closed by the price movement and it is shown with a dashed line.








отличный индикатор