Market Thermometer in Candle Jr
- Indicadores
- Edson Cavalca Junior
- Versión: 1.20
- Actualizado: 19 enero 2021
- Activaciones: 5
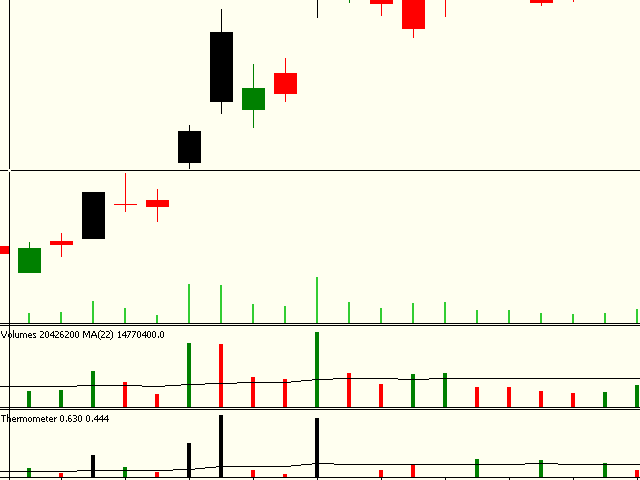
The Market Thermometer can be used to help traders identify sleepy or turbulent periods.
It helps beginners to check when is the ideal time to enter operations, that is, when the value of the thermometer is below its average for several periods, identifying a peaceful market.
When the market is heated, that is, the thermometer is above three times its average, it is time to make profits.
The Thermometer measures the extent to which the end of a period, maximum or minimum price, projects outside the range of the previous period.
The candle can have the following coloring:
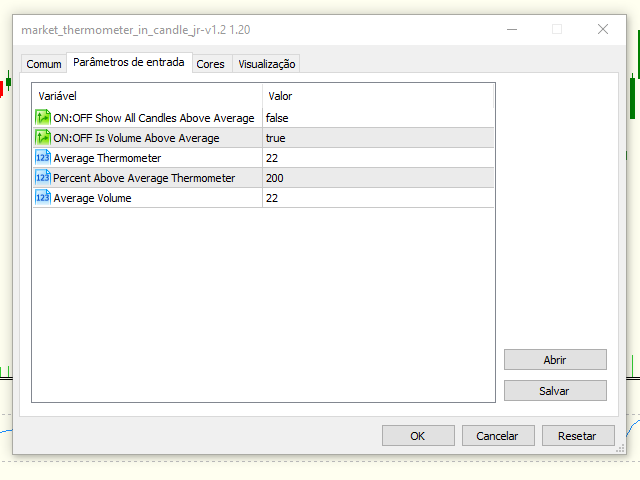
Input parameters:
- Green: candle with a closing price higher than the opening;
- Red: candle with closing price less than the opening;
- Lima Green: candle with a closing price higher than the opening price and a thermometer value higher than its average;
- Salmon: candle with a closing price lower than the opening price and a thermometer value higher than its average;
- Black: candle above the parameter "Percentage above the average of the Thermometer" or above the average volume and also the configured percentage of the thermometer;
- ON: OFF Show All Candles Above Average: to indicate whether candles will be activated simply because they are above the average of the thermometer;
- ON: OFF Is Volume Above Average: to indicate whether Black candle will be activated only if actual volume is above average.
- Average Thermometer: Arithmetic Average of the Thermometer (Standard 22);
- Percent Above Average Thermometer: Percent above the average of the Thermometer to activate the Black candle (Standard 200%, that is, 3 times the average) and;
- Average Volume: period for calculating the average volume;
Follow us on our website to check the next news.
Hugs,
Edson Cavalca Junior
System Analyst