Growing Bands
- Indicadores
- Nikolay Likhovid
- Versión: 1.21
- Actualizado: 18 noviembre 2021
- Activaciones: 5
Do you use dynamic ranges (like Bollinger Bands or Envelopes) in your trading? Usually such calculations use a fixed period, but does it reflect the nature of the market? In fact, the price chart consists of a series of successive processes - trends and flats. In this case, we can talk about the internal development logic inside a single process only. Accordingly, the dynamic ranges built for the process occurring "here and now" suit the nature of the market better.
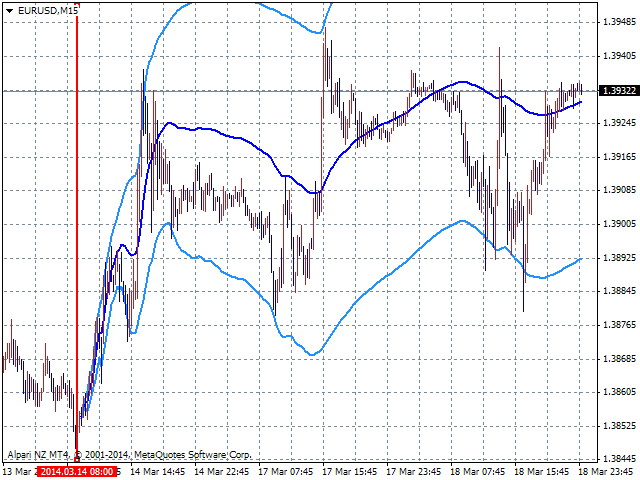
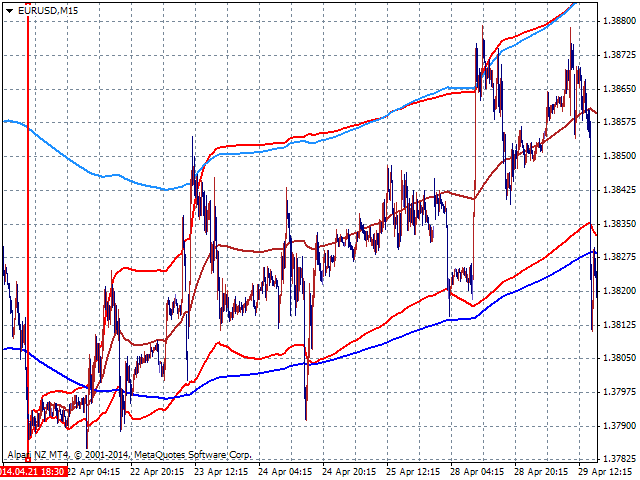
The Growing Bands indicator uses this approach. Instead of setting a period, you should set the beginning of the process currently occurring on the market. Since a trader can usually visually find this point on the chart, this approach is not only the most versatile, but also the most natural one.
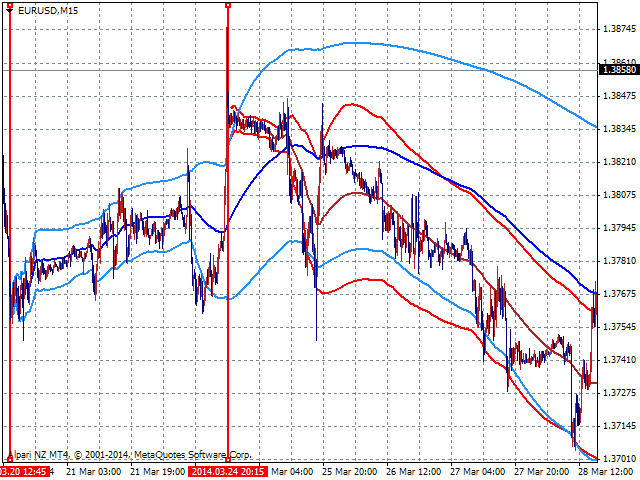
The usage of Growing Bands in trading are the same as for other similar indicators: both the range boundaries and the mean line can be significant. The long absence of touches of the range borders may indicate that it is time to select a different starting point.
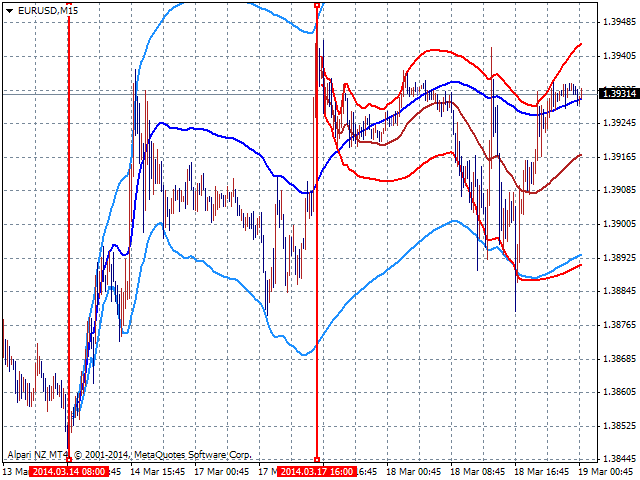
The calculation start time depends on the position of an object with a defined name on the chart. The default name is GB, but you can specify any other name using the appropriate indicator parameter. Different names allow you to simultaneously track different processes when several indicator copies are launched on the chart. For example, you may allocate "older" and "younger" processes.
If there is no required object on the chart during the launch, the indicator creates a vertical line with the necessary name near the chart's right edge. To change the starting point of calculation, double-click on the line to select it and drag it to the desire location. In fact, this can be any object, only the name and location on the chart matter.
The indicator is calculated at the opening of new bars - it is obvious that for this indicator calculations on each tick are meaningless and only load the terminal.
The indicator has 12 parameters:
- AlertAtLines - allow alerts when the price hits the area of one of the lines.
- AlertThr - sets the half-width of the line area (1 is equal to the distance between lines with the default position of borders).
- Top Band Border - sets the position of the upper border, three parameters allow you to set three different upper borders.
- Bottom Band Border - sets the position of the lower border, three parameters allow you to set three different lower borders.
- Object Name for Start Point Set - sets the name of the object indicating the start point.
- LineWidth - sets the width of indicator lines.
- MidColor - sets the color of the middle line.
- BorderColor - sets the color of borders.
You can use negative values for the position of borders. In this case the upper border will be below the middle line, and the lower one will be above it.
