MT4 high accuracy indicators19
- Indicadores
- Xue Hang Pan
- Versión: 1.0
- Activaciones: 5
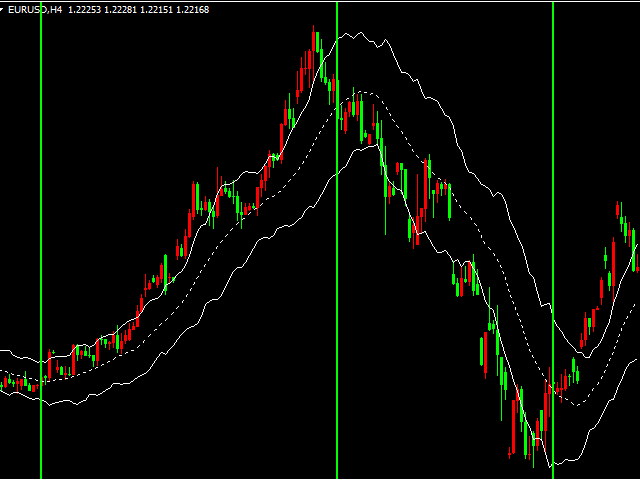
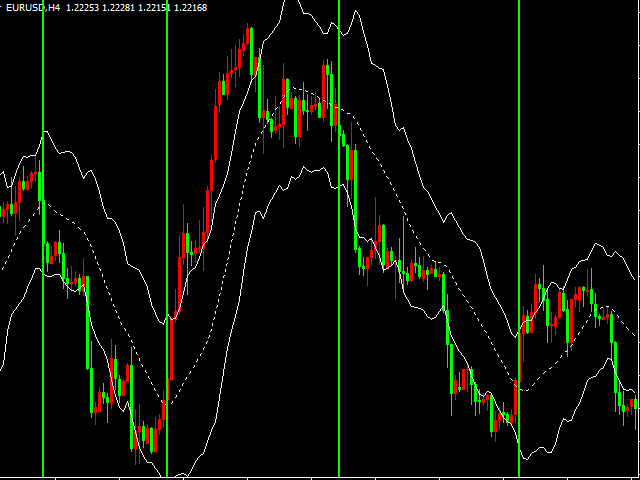
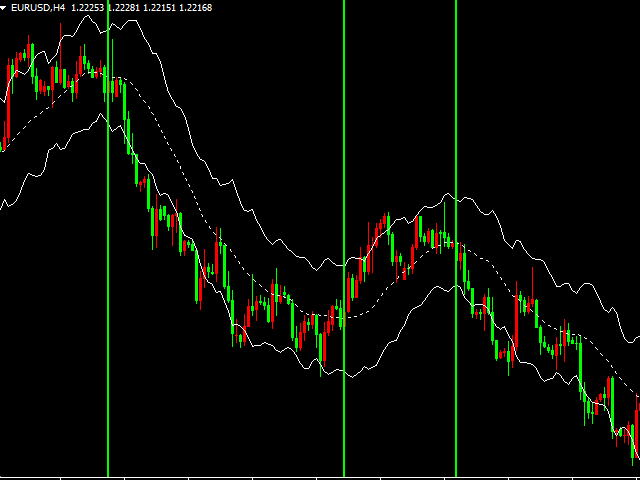
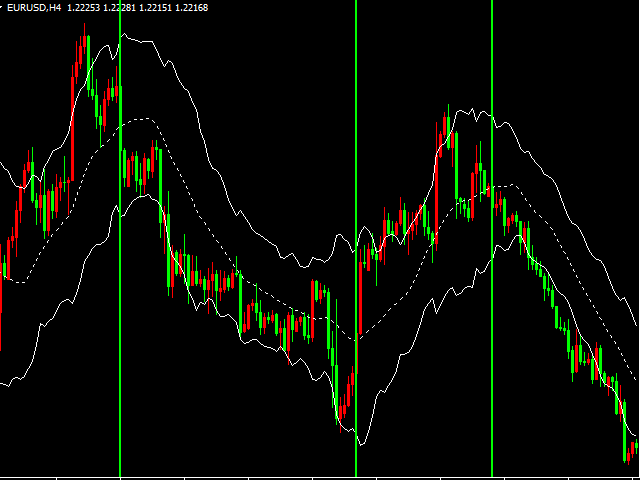
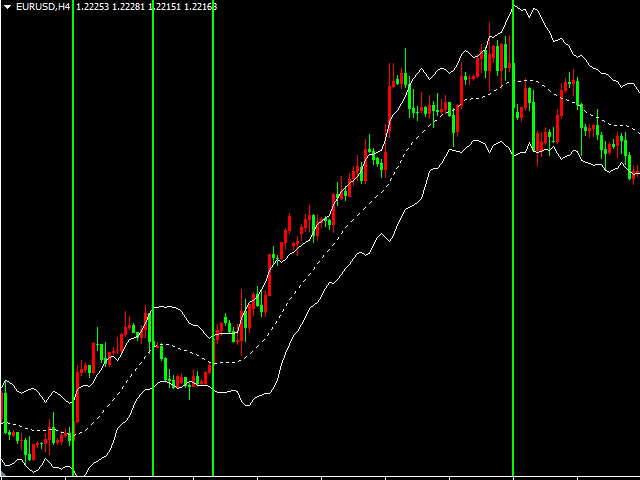
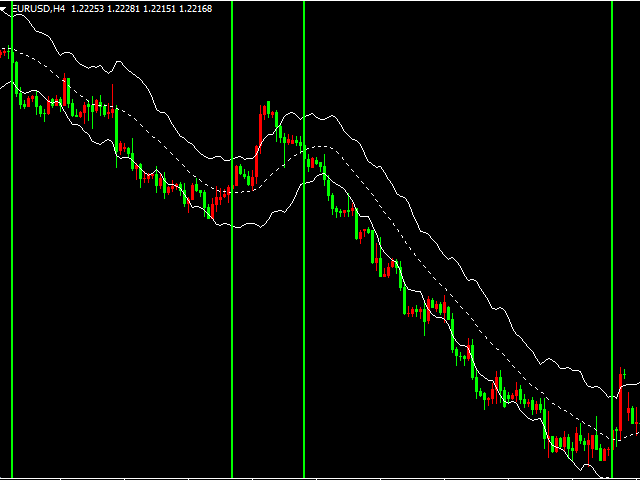
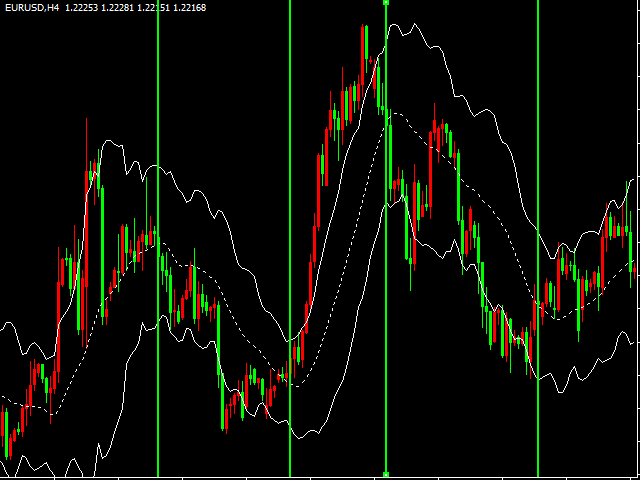
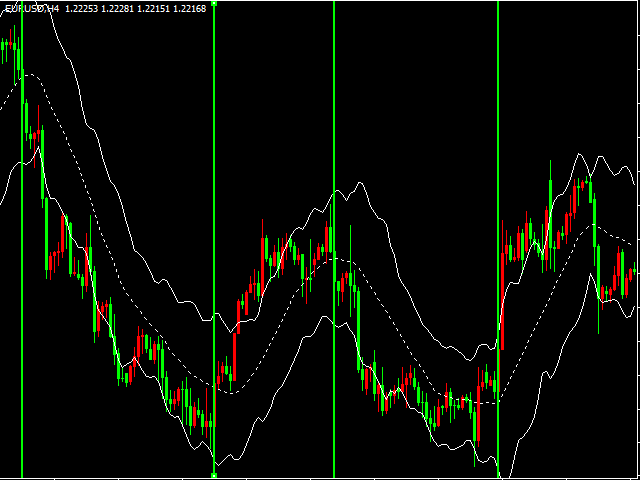
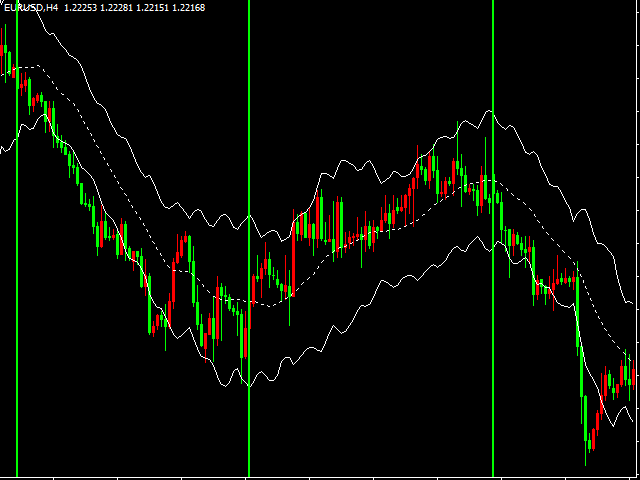
Indicator function
As shown in the figure, choosing to buy or sell at the dotted line of the indicator, and following the trend with the Angle of the channel up and down, are equally effective in bands and trends
It is best to use 1H for testing
About update questions
In order to be more suitable for market fluctuations, the company regularly updates the indicators
Product cycle and trading time applicable to indicators
Applicable mainstream currency pair
EUR/USD GBP/USD NZD/USD AUD/USD USD/JPY USD/CAD USD/CHF
Applicable mainstream cross currency pair
EUR/JPY EUR/GBP EUR/CHF EUR/CAD EUR/NZD
AUD/CAD AUD/NZD AUD/CHF AUD/JPY
GBP/JPY GBP/CHF
NZD/JPY
Applicable precious metal XAUUSD
Applicable crude oil XTIUSD XBRUSD
This indicator applies to transactions in any cycle and at any time

El usuario no ha dejado ningún comentario para su valoración