• Información general
  • Comentarios
  • Discusión

Long Short Pro

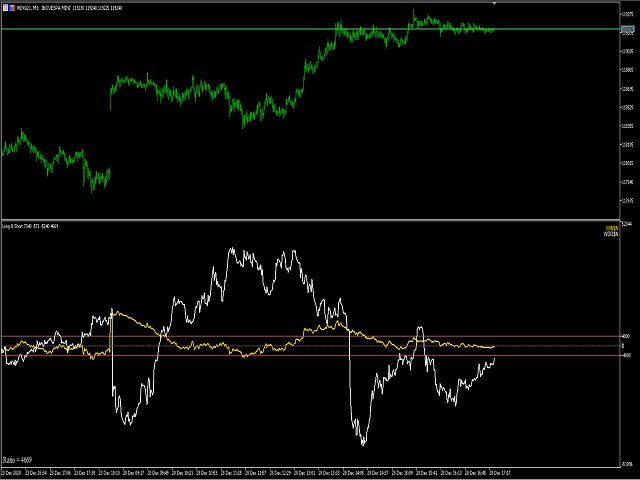
Para utilizar el indicador Long y Short de forma eficaz y aprovechar las correlaciones entre diferentes activos, es importante seguir algunos pasos fundamentales.

1. Comprende la base del indicador: Familiarízate con las métricas y cálculos subyacentes del indicador Long y Short. Entiende cómo correlaciona los pares de divisas, índices o criptomonedas e identifica las correlaciones positivas o negativas entre estos activos.

2. Analiza las correlaciones entre activos: Utiliza el indicador Long y Short para monitorear las correlaciones entre los activos de tu interés. Observa las relaciones entre los pares de divisas, índices o criptomonedas a lo largo del tiempo e identifica las tendencias de correlación positiva o negativa.

3. Identifica divergencias positivas: Busca divergencias positivas, donde un activo muestra un desempeño más fuerte que otro activo correlacionado. Esto puede indicar una oportunidad de negociación, ya que es posible que el activo más fuerte continúe apreciándose mientras que el otro puede tener un desempeño más débil.

4. Aprovecha las divergencias negativas: De manera similar, observa las divergencias negativas, donde un activo muestra un desempeño más débil que su activo correlacionado. Esto puede indicar una oportunidad de negociación, ya que es posible que el activo más débil continúe depreciándose mientras que el otro puede tener un desempeño más fuerte.

5. Realiza operaciones basadas en las divergencias: Con base en las divergencias positivas o negativas identificadas por el indicador Long y Short, toma decisiones de negociación. Por ejemplo, si hay una divergencia positiva, puedes considerar abrir una posición de compra en el activo más fuerte y una posición de venta en el activo más débil. Si hay una divergencia negativa, puedes considerar abrir una posición de venta en el activo más débil y una posición de compra en el activo más fuerte.

6. Gestiona tus riesgos: Recuerda siempre gestionar adecuadamente tus riesgos al realizar operaciones basadas en las divergencias identificadas. Utiliza órdenes de stop-loss para limitar las pérdidas en caso de movimientos desfavorables en el mercado y establece metas de ganancias realistas.

En resumen, el indicador Long y Short te brinda la capacidad de aprovechar las correlaciones entre diferentes activos e identificar divergencias positivas y negativas. Al comprender su base y seguir los pasos mencionados anteriormente, estarás preparado para tomar decisiones de negociación fundamentadas y potencialmente rentables.

Información para EA:

Buffer Symbol 1ª = 0;

Buffer Symbol 2ª = 2;
Productos recomendados
Snipeer2
Ignacio Agustin Mene Franco
Sniper2 ,  Cuenta con puntos  de lineas , con colores que te estan mostrando una entrada ,  que funcionan como soporte y resistencia !  las lineas de puntos verdes verde muestra entrada en venta ,  las lineas de puntos rojos muestra entrada en compra , fijarse en los soportes   que funcionan como roptura para agarrar velas largas en mayor temporalidad .  funciona para forex todo los pares  funciona para indices sinteticos todo los pares !  indicador en oferta ! 
Noize Absorption Index - is the manual trading system that measures the difference of pressure between bears forces and bulls forces. Green line - is a noize free index that showing curent situation. Zero value of index shows totally choppy/flat market.Values above zero level shows how powerfull bullish wave is and values below zero measures bearish forces.Up arrow appears on bearish market when it's ready to reverse, dn arrow appears on weak bullish market, as a result of reverse expectation.
- This is the exact conversion from TradingView: "Support/Resistance" By "BarsStallone". - This indicator lets you read the buffers for R/S values. - This is a non-repaint and light processing load indicator. - This is not a multi time frame indicator If you want the multi time frame version you should create a personal order and I deliver two files that you need them both to have the multi time frame indicator running on your system. - The MT4 version of the indicator is not light load from pr
Exclusive FOREX account HEDGE FuzzyLogicTrendEA is based on fuzzy logic strategy based on  analysis 5 indicators and filters. When the EA analysis all this indicators, it decides, based on its fuzzy strategy, which trade will be better: sell or buy. As additional functions, it´s possible defines spread maximum, stop loss and others. Recomm. Symbol: EURUSD, AUDUSD, GBPUSD, NZDUSD, USDCAD, AUDCAD, EURCAD e USDJPY Recomm. timeframe: H1. Backtest were done on EURUSD, H1, 01/07/2023 - 26/0
The new update makes this indicator a complete tool for studying, analyzing and operating probabilistic patterns. It includes: On-chart Multi-asset percentage monitor. Configurable martingales. Twenty-one pre-configured patterns, including Mhi patterns and C3. An advanced pattern editor to store up to 5 custom patterns. Backtest mode to test results with loss reports. Trend filter. Hit operational filter. Martingale Cycles option. Various types of strategies and alerts. Confluence between patter
Follow The Line MT5
Oliver Gideon Amofa Appiah
4.42 (31)
This indicator obeys the popular maxim that: "THE TREND IS YOUR FRIEND" It paints a GREEN line for BUY and also paints a RED line for SELL. (you can change the colors). It gives alarms and alerts of all kinds. IT DOES NOT REPAINT and can be used for all currency pairs and timeframes. Yes, as easy and simple as that. Even a newbie can use it to make great and reliable trades. NB: For best results, get my other premium indicators for more powerful and reliable signals. Get them here: https://www.m
FREE
This indicator obeys the popular maxim that: "THE TREND IS YOUR FRIEND" It paints a Blue line for BUY and also paints a RED line for SELL. (you can change the colors). It gives alarms and alerts of all kinds. IT DOES NOT REPAINT COLOR and can be used for all currency pairs and timeframes. Yes, as easy and simple as that. Even a newbie can use it to make great and reliable trades. https://www.mql5.com/en/market/product/115553
Este es un indicador MTF de niveles de soporte y resistencia basado en los   extremos del indicador Advanced ZigZag Dynamic   y / o   Extended Fractals   con etiquetas de precio (se puede deshabilitar). Se pueden seleccionar TF más altos para el modo MTF. De forma predeterminada, los niveles se generan en función de los puntos indicadores de ZigZag. Los puntos indicadores de fractales también se pueden usar junto con ZigZag o en su lugar. Para simplificar el uso y ahorrar tiempo de CPU, el cálcu
This is the famous Sunflower indicator for Metatrader5. This indicator marks possible tops and bottoms on price charts. The indicator identifies tops and bottoms in the asset's price history, keep in mind that the current sunflower of the last candle repaints, as it is not possible to identify a top until the market reverses and it is also not possible to identify a bottom without the market stop falling and start rising. If you are looking for a professional programmer for Metatrader5, please
Double HMA MTF for MT5
Pavel Zamoshnikov
3.67 (3)
This is an advanced multi-timeframe version of the popular Hull Moving Average (HMA) Features Two lines of the Hull indicator of different timeframes on the same chart. The HMA line of the higher timeframe defines the trend, and the HMA line of the current timeframe defines the short-term price movements. A graphical panel with HMA indicator data from all timeframes at the same time . If the HMA switched its direction on any timeframe, the panel displays a question or exclamation mark with a tex
The best time to trade Using this Indicator is when the time reach exactly hour,half,45 minutes,15 minutes and sometimes 5 minutes.. This indicators is helpful to those who trade boom and crash indecies.How to read this indicator first you'll see Blue allow and Red allow all these allows used to indicate or to detect the spike which will happen so the allow happens soon before the spike happen.This indicator works properly only in boom and crash trading thing which you have to consider when
Support & Resistance indicator is a modification of the standard Bill Williams' Fractals indicator. The indicator works on any timeframes. It displays support and resistance levels on the chart and allows setting stop loss and take profit levels (you can check the exact value by putting the mouse cursor over the level). Blue dashed lines are support level. Red dashed lines are resistance levels. If you want, you can change the style and color of these lines. If the price approaches a support lev
Before installing the HeatMap indicator make sure you are using a broker that gives you access to the Depth of market (DOM) !! This indicator creates a heatmap on your chart allowing you to see the buy or sell limit orders easily and in real time. You have the possibility to change the setting and the colors of the HeatMap in order to adapt to all markets and all charts. Here is an example of a setting you can use with the NASDAQ100 on the AMPGlobal broker :  https://www.youtube.com/watch?v=x0
Volality Index Scalper
Lesedi Oliver Seilane
5 (1)
Volality Index scalper indicator  Meant for Volality pairs such as Volality 10, 25, 50, 75 and 100 The indicator works on all timeframes from the 1 minute to the monthly timeframe the indicator is non repaint the indicator has 3 entry settings 1 color change on zero cross 2 color change on slope change 3 color change on signal line cross Orange line is your sell signal Blue line is your buy signal.
An indicator of pattern #31 ("Long Island") from Encyclopedia of Chart Patterns by Thomas N. Bulkowski. The second gap is in the opposite direction. Parameters: Alerts - show alert when an arrow appears   Push - send a push notification when an arrow appears (requires configuration in the terminal) GapSize - minimum gap size in points ArrowType - a symbol from 1 to 17 ArrowVShift - vertical shift of arrows in points   ShowLevels - show levels ColUp - color of an upward line ColDn - color of a
Alpha Trend Pro
Eslam Mohamed Abdelrady Shehata
Alpha Trend Pro: Your Ultimate Trading Companion Embark on a new era of trading with Alpha Trend Pro Indicator. Crafted with precision and innovation, Alpha Trend is designed to elevate your trading experience by seamlessly blending powerful elements to navigate various market conditions. **Key Features:** **1. Dynamic Adaptability:**    - In sideways market conditions, Alpha Trend acts as a dead indicator. Say goodbye to many false signals and welcome a tool that adapts seamlessly to mar
KT Renko Patterns MT5
KEENBASE SOFTWARE SOLUTIONS
KT Renko Patterns scans the Renko chart brick by brick to find some famous chart patterns that are frequently used by traders across the various financial markets. Compared to the time-based charts, patterns based trading is easier and more evident on Renko charts due to their uncluttered appearance. KT Renko Patterns features multiple Renko patterns, and many of these patterns are extensively explained in the book titled Profitable Trading with Renko Charts by Prashant Shah. A 100% automate
Key level wedge MT5
Presley Annais Tatenda Meck
The   Key level wedge MT5   indicator automatically draws rising wedge pattern and falling wedge pattern for you on the chart. This pattern is really good when used as a confirmation entry at key support & resistance, supply & demand and reversal zones. Advantages  The   Key level wedge MT5   block DOES NOT RE-PAINT, giving you confidence when a signal appears and also helps when looking back.  The   Key level wedge MT5   includes an on/off button on the chart to easily keep the charts cle
This indicator uses the metaquotes ZigZag indicator as base to plot fibonacci extension and fibonacci retracement based in the Elliot waves. A fibonacci retracement will be plotted on every wave draw by the ZigZag. A fibonacci extension will be plotted only after the 2nd wave. Both fibonacci will be updated over the same wave tendency. Supporting until 9 consecutive elliot waves. Parameters: Depth: How much the algorithm will iterate to find the lowest and highest candles Deviation: Amoun
Perfect Sniper
Ignacio Agustin Mene Franco
Perfect Sniper !  es un indicador triple con deteccion de soporte resistencia ,  canal de tendencia bajista,  canal de tendencia alcista Bandas incluidas !  donde caza los rebotes en las lineas rojas marca venta ,  en las lineas verdes marca compra ,  en las bandas de mas abajo que son los quiebres da otra segunda entrada  sea buy o sell ,  perfecto para aprobechar la doble entrada ,  se usa en cualquier temporalidad ,  sirve para hacer scalping y largos en h1 o h4 asta D1 .  Sirve para los merc
VR Cub MT 5
Vladimir Pastushak
VR Cub es un indicador para obtener puntos de entrada de alta calidad. El indicador fue desarrollado para facilitar los cálculos matemáticos y simplificar la búsqueda de puntos de entrada a una posición. La estrategia comercial para la cual se diseñó el indicador ha demostrado su eficacia durante muchos años. La simplicidad de la estrategia comercial es su gran ventaja, que permite que incluso los operadores novatos negocien con éxito con ella. VR Cub calcula los puntos de apertura de posiciones
Ante todo, vale la pena enfatizar que esta Herramienta de Trading es un Indicador No Repintado, No Redibujado y No Retrasado, lo que la hace ideal para el trading profesional. Curso en línea, manual del usuario y demostración. El Indicador de Conceptos de Acción del Precio Inteligente es una herramienta muy potente tanto para traders nuevos como experimentados. Combina más de 20 indicadores útiles en uno solo, combinando ideas avanzadas de trading como el Análisis del Trader del Círculo Inte
Este indicador le mostrará los valores TP y SL (en esa moneda) que ya configuró para cada pedido en los gráficos (cerrados a la línea de transacción/pedido) que lo ayudarán mucho a estimar sus ganancias y pérdidas para cada pedido. Y también te muestra los valores de PIP. el formato que se muestra es "Valores de moneda de nuestros valores de ganancias o pérdidas / PIP". El valor TP se mostrará en color verde y el valor SL se mostrará en color rojo. Para cualquier pregunta o más información, n
LT Donchian Channel
Thiago Duarte
4.75 (4)
Donchian Channel is an indicator created by Richard Donchian. It is formed by taking the highest high and the lowest low of the last specified period in candles. The area between high and low is the channel for the chosen period. Its configuration is simple. It is possible to have the average between the upper and lower lines, plus you have alerts when price hits one side. If you have any questions or find any bugs, please contact me. Enjoy!
FREE
Ultimate Supply Demand MT5
Ramon Sobrevals Arce
5 (4)
After working during many months, with the help of Neural Networks, we have perfected the ultimate tool you are going to need for identifying key price levels (Supports and Resistances) and Supply and Demand zones. Perfectly suitable to trigger your trades, set up your future actions, decide your Take Profit and Stop Loss levels, and confirm the market direction. Price will always move between those levels, bouncing or breaking; from one zone to another, all the remaining movements are just mark
To download MT4 version please click here . - This is the exact conversion from TradingView: "Trend Direction Force Index - TDFI [wm]" By "causecelebre". - This indicator uses multiple levels of averaging to detect trend strength. - You can optimize filter low and filter high levels to achieve best results. - You have access to buffers to use in EAs. - This is a light-load processing and non-repaint indicator. - You can message in private chat for further changes you need.
Green Power
Ignacio Agustin Mene Franco
Pack Black Card  indicador 5/3 Green power cuenta con la estrategia de ropturas high y low  dando la señal con el punto rojo o verde  el punto rojo para short y el punto verde para long ,  perfecto para los mercados de forex y los mercados de indices sinteticos ,  funciona para todas las temporalidades  sirve para hacer scalping y intradiario !  Ideal para los mercados Crash y boom !!
Was: $249  Now: $99   Market Profile defines a number of day types that can help the trader to determine market behaviour. A key feature is the Value Area, representing the range of price action where 70% of trading took place. Understanding the Value Area can give traders valuable insight into market direction and establish the higher odds trade. It is an excellent addition to any system you may be using. Inspired by Jim Dalton’s book “Mind Over Markets”, this indicator is designed to suit the
KT Horizontal Lines MT5
KEENBASE SOFTWARE SOLUTIONS
In MetaTrader, plotting multiple   horizontal lines   and then tracking their respective price levels can be a hassle. This indicator automatically plots multiple horizontal lines at equal intervals for setting price alerts, plotting support and resistance levels, and other manual purposes. This indicator is suitable for Forex traders who are new and looking for chances to make quick profits from buying and selling. Horizontal lines can help traders find possible areas to start trading when the
Los compradores de este producto también adquieren
Atomic Analyst MT5
Issam Kassas
5 (14)
En primer lugar, vale la pena enfatizar que este Indicador de Trading no repinta, no redibuja y no se retrasa, lo que lo hace ideal tanto para el trading manual como para el automatizado. Manual del usuario: configuraciones, entradas y estrategia. El Analista Atómico es un Indicador de Acción del Precio PA que utiliza la fuerza y el impulso del precio para encontrar una mejor ventaja en el mercado. Equipado con filtros avanzados que ayudan a eliminar ruidos y señales falsas, y aumentan el poten
Primero que todo, vale la pena enfatizar que este Sistema de Trading es un Indicador No Repintado, No Redibujado y No Retrasado, lo que lo hace ideal tanto para el trading manual como para el automatizado. Curso en línea, manual y descarga de ajustes preestablecidos. El "Sistema de Trading Inteligente MT5" es una solución completa de trading diseñada para traders nuevos y experimentados. Combina más de 10 indicadores premium y presenta más de 7 estrategias de trading robustas, lo que lo convie
Quantum Trend Sniper
Bogdan Ion Puscasu
4.91 (43)
Introduciendo       Indicador Quantum Trend Sniper   , el innovador indicador MQL5 que está transformando la forma en que identificas y negocias los cambios de tendencia. Desarrollado por un equipo de comerciantes experimentados con experiencia comercial de más de 13 años,       Indicador de francotirador de tendencia cuántica       está diseñado para impulsar su viaje comercial a nuevas alturas con su forma innovadora de identificar cambios de tendencia con una precisión extremadamente alta.
FX Power MT5 NG
Daniel Stein
5 (5)
Obtenga su actualización diaria del mercado con detalles y capturas de pantalla a través de nuestro Morning Briefing aquí en mql5 y en Telegram ! FX Power MT5 NG es la nueva generación de nuestro popular medidor de fuerza de divisas, FX Power. ¿Y qué ofrece este medidor de fuerza de nueva generación? Todo lo que le encantaba del FX Power original PLUS Análisis de fuerza de ORO/XAU Resultados de cálculo aún más precisos Períodos de análisis configurables individualmente Límite de cálculo persona
Reversal First Impulse levels (RFI)      INSTRUCTIONS        RUS       -       ENG              R ecommended to use with an indicator   -   TREND PRO -  Version MT4                 A key element in trading is zones or levels from which decisions to buy or sell a trading instrument are made. Despite attempts by major players to conceal their presence in the market, they inevitably leave traces. Our task was to learn how to identify these traces and interpret them correctly. Main functions:: Di
Trend Screener Pro MT5
STE S.S.COMPANY
4.88 (64)
Desbloquee el poder del comercio de tendencias con el indicador Trend Screener: ¡su solución definitiva para el comercio de tendencias impulsada por lógica difusa y un sistema multidivisa!Mejore su comercio de tendencias con Trend Screener, el revolucionario indicador de tendencias impulsado por lógica difusa. Es un poderoso indicador de seguimiento de tendencias que combina más de 13 herramientas y funciones premium y 3 estrategias comerciales, lo que lo convierte en una opción versátil para co
FX Volume MT5
Daniel Stein
4.94 (17)
Obtenga su actualización diaria del mercado con detalles y capturas de pantalla a través de nuestro Morning Briefing aquí en mql5 y en Telegram ! FX Volume es el PRIMER y ÚNICO indicador de volumen que proporciona una visión REAL del sentimiento del mercado desde el punto de vista de un bróker. Proporciona una visión impresionante de cómo los participantes institucionales del mercado, como los brokers, están posicionados en el mercado Forex, mucho más rápido que los informes COT. Ver esta info
TPSproTREND PrO MT5
Roman Podpora
4.88 (8)
TPSpro TRENDPRO  - is a trend indicator that automatically analyzes the market and provides information about the trend and each of its changes, as well as giving signals for entering trades without redrawing! The indicator uses each candle, analyzing them separately. referring to different impulses - up or down impulse. Exact entry points into transactions for currencies, crypto, metals, stocks, indices!  -  Version MT4               DETAILED DESCRIPTION               R ecommended to use with
Este es un genial indicador para MT5 que ofrece señales precisas para entrar en una transacción sin redibujar. Se puede aplicar a cualquier activo financiero: fórex, criptomonedas, metales, acciones, índices. Nos dará valoraciones bastante precisas y nos dirá cuándo es mejor abrir y cerra una transacción. Eche un vistazo  al vídeo  (6:22), ¡contiene un ejemplo de procesamiento de una sola señal que ha amortizado el indicador! La mayoría de los tráders mejoran sus resultados comerciales durante l
FxaccurateLS
Shiv Raj Kumawat
WHY IS OUR FXACCCURATE LS MT5 THE PROFITABLE ? PROTECT YOUR CAPITAL WITH RISK MANAGEMENT Gives entry, stop and target levels from time to time. It finds Trading opportunities by analyzing what the price is doing during established trends. POWERFUL INDICATOR FOR A RELIABLE STRATEGIES We have made these indicators with a lot of years of hard work. It is made at a very advanced level. Established trends provide dozens of trading opportunities, but most trend indicators completely ignore them!
AW Trend Predictor MT5
AW Trading Software Limited
4.78 (58)
La combinación de niveles de tendencia y ruptura en un sistema. Un algoritmo de indicador avanzado filtra el ruido del mercado, determina la tendencia, los puntos de entrada y los posibles niveles de salida. Las señales indicadoras se registran en un módulo estadístico, que le permite seleccionar las herramientas más adecuadas, mostrando la efectividad del historial de señales. El indicador calcula las marcas Take Profit y Stop Loss. Manual e instrucciones ->   AQUÍ   / Versión MT4 ->   AQUÍ Có
ICT, SMC, SMART MONEY CONCEPTS, SMART MONEY, Smart Money Concept, Support and Resistance, Trend Analysis, Price Action, Market Structure, Order Blocks, BOS/CHoCH,   Breaker Blocks ,  Momentum Shift,   Supply&Demand Zone/Order Blocks , Strong Imbalance,   HH/LL/HL/LH,    Fair Value Gap, FVG,  Premium  &   Discount   Zones, Fibonacci Retracement, OTE, Buy Side Liquidity, Sell Side Liquidity, BSL/SSL Taken, Equal Highs & Lows, MTF Dashboard, Multiple Time Frame, BigBar, HTF OB, HTF Market Structure
Bill Williams Advanced
Siarhei Vashchylka
5 (5)
Bill Williams Advanced is designed for automatic chart analysis using Bill Williams' "Profitunity" system. The indicator analyzes four timeframes at once. Manual (Be sure to read before purchasing) Advantages 1. Automatically analyzes the chart using the "Profitunity" system of Bill Williams. The found signals are placed in a table in the corner of the screen. 2. Equipped with a trend filter based on the Alligator indicator. Most of the system signals are recommended to be used only accordi
Conviértase en un Breaker Trader y obtenga beneficios de los cambios en la estructura del mercado a medida que se invierte el precio. El indicador de ruptura de bloque de órdenes identifica cuándo una tendencia o movimiento de precio se acerca al agotamiento y está listo para revertirse. Le alerta sobre cambios en la estructura del mercado que generalmente ocurren cuando una reversión o un retroceso importante están a punto de suceder. El indicador utiliza un cálculo patentado que identific
The Volume by Price Indicator for MetaTrader 5 features Volume Profile and Market Profile TPO (Time Price Opportunity). Volume and TPO histogram bar and line charts. Volume Footprint charts. TPO letter and block marker collapsed and split structure charts. Session filtering and grouping. Static, dynamic and flexible range segmentation and compositing methods with relative and absolute visualizations. Graphical layering, positioning and styling options to suit the user's analytic and aesthetic n
Easy By Sell is a market indicator for opening and closing positions. It becomes easy to track market entries with alerts. It indicates trend reversal points when a price reaches extreme values ​​and the most favorable time to enter the market. it is as effective as a Fibonacci to find a level but it uses different tools such as an algorithm based on ATR indicators and Stochastic Oscillator. You can modify these two parameters as you wish to adapt the settings to the desired period. My othe
Legacy of Gann for MT5
Pavel Zamoshnikov
5 (6)
The indicator very accurately determines the levels of the possible end of the trend and profit fixing. The method of determining levels is based on the ideas of W.D.Gann, using an algorithm developed by his follower Kirill Borovsky. Extremely high reliability of reaching levels (according to K. Borovsky  - 80-90%) Indispensable for any trading strategy – every trader needs to determine the exit point from the market! Precisely determines targets on any timeframes and any instruments (forex, met
"Piranha" - an autonomous trading system that determines overbought and oversold levels on the chart. Red and blue zones represent overbought and oversold levels respectively. Entry points are marked with arrows: a downward arrow in the red zone for "sell" and an upward arrow in the blue zone for "buy". The Take profit level is indicated by the green moving average. Key features: Adjusting the Take profit level as the green moving average changes position. Averaging ability when a new market e
Quantum Heiken Ashi PRO MT5
Bogdan Ion Puscasu
4.5 (8)
Presentamos el   Quantum Heiken Ashi PRO Diseñadas para brindar información clara sobre las tendencias del mercado, las velas Heiken Ashi son reconocidas por su capacidad para filtrar el ruido y eliminar las señales falsas. Diga adiós a las confusas fluctuaciones de precios y dé la bienvenida a una representación gráfica más fluida y confiable. Lo que hace que Quantum Heiken Ashi PRO sea realmente único es su fórmula innovadora, que transforma los datos de velas tradicionales en barras de colore
Advanced Supply Demand MT5
Bernhard Schweigert
4.53 (15)
¡Actualmente con 33% de descuento! ¡La mejor solución para cualquier tráder principiante o experto! Este indicador es una herramienta comercial única, de alta calidad y asequible, porque incorpora una serie de características patentadas y una nueva fórmula. Con esta actualización, podrá mostrar zonas de doble marco temporal. No solo podrá mostrar un marco temporal más alto, sino también mostrar ambos, el marco temporal del gráfico MÁS el marco temporal más alto: MOSTRANDO ZONAS ANIDADAS. A todos
IX Power MT5
Daniel Stein
5 (3)
IX Power   lleva por fin la insuperable precisión de FX Power a los símbolos que no son de Forex. Determina con exactitud la intensidad de las tendencias a corto, medio y largo plazo de tus índices, acciones, materias primas, ETF e incluso criptodivisas favoritas. Puede   analizar todo lo   que su terminal le ofrece. Pruébalo y experimenta cómo   tu timing mejora significativamente   a la hora de operar. Características principales de IX Power Resultados de cálculo 100% precisos y sin rep
El indicador de reversión de ADR le muestra de un vistazo dónde se cotiza actualmente el precio en relación con su rango diario promedio normal. Recibirá alertas instantáneas a través de una ventana emergente, correo electrónico o push cuando el precio exceda su rango promedio y los niveles por encima de su elección para que pueda saltar rápidamente a retrocesos y reversiones. El indicador dibuja líneas horizontales en el gráfico en los extremos del rango promedio diario y también extensiones p
Gartley Hunter Multi
Siarhei Vashchylka
5 (7)
Gartley Hunter Multi - An indicator for searching for harmonic patterns simultaneously on dozens of trading instruments and on all possible timeframes. Manual (Be sure to read before purchasing) | Version for MT4 Advantages 1. Patterns: Gartley, Butterfly, Shark, Crab. Bat, Alternate Bat, Deep Crab, Cypher 2. Simultaneous search for patterns on dozens of trading instruments and on all possible timeframes 3. Search for patterns of all possible sizes. From the smallest to the largest 4. A
TPA True Price Action indicator reveals the true price action of the market makers through 100% non-repainting signals strictly at the close of a candle! TPA shows entries and re-entries, every time the bulls are definitely stronger than the bears and vice versa. Not to confuse with red/green candles. The shift of power gets confirmed at the earliest stage and is ONE exit strategy of several. There are available now two free parts of the TPA User Guide for our customers. The first "The Basics"
** All Symbols x All Timeframes scan just by pressing scanner button ** ***Contact me after purchase to send you instructions and add you in "123 scanner group" for sharing or seeing experiences with other users. After 17 years of experience in the markets and programming, Winner indicator is ready. I would like to share with you! Introduction The 123 Pattern Scanner indicator with a special enhanced algorithm is a very repetitive common pattern finder with a high success rate . Interestingly,
¡La mejor solución para cualquier operador novato o experto! Este indicador es una herramienta única, de alta calidad y asequible porque hemos incorporado una serie de características propias y una nueva fórmula. ¡Con sólo UN gráfico puede leer la Fuerza de la Divisa para 28 pares de Divisas! Imagínese cómo mejorará su operativa porque podrá señalar el punto exacto de activación de una nueva tendencia o de una oportunidad de scalping. Manual del usuario: haga   clic aquí Ese es el primero
**   All Symbols   x   All Timeframes   scan just by pressing scanner button ** *** Contact me after the purchase to send you instructions and add you in "Trend Reversal group" for sharing or seeing experiences with other users. Introduction: Trendlines are the most famous technical analysis in trading . Trendlines continually form on the charts of markets across all the different timeframes providing huge opportunities for traders to jump in and profit on the action. In the other hand,  The tre
Este tablero muestra los últimos   patrones armónicos   disponibles para los símbolos seleccionados, por lo que ahorrará tiempo y será más eficiente /   versión MT4 . Indicador gratuito:   Basic Harmonic Pattern Columnas del indicador Symbol:   aparecerán los símbolos seleccionados Trend :   alcista o bajista Pattern :   tipo de patrón (gartley, mariposa, murciélago, cangrejo, tiburón, cifrado o ABCD) Entry :   precio de entrada SL:   precio de stop loss TP1:   1er precio de toma de benefici
Próxima generación de zonas de oferta y demanda automatizadas. Algoritmo nuevo e innovador que funciona en cualquier gráfico. Todas las zonas se crean dinámicamente de acuerdo con la acción del precio del mercado. DOS TIPOS DE ALERTAS --> 1)CUANDO EL PRECIO LLEGA A UNA ZONA 2)CUANDO SE FORMA UNA NUEVA ZONA No obtienes un indicador inútil más. Obtiene una estrategia comercial completa con resultados probados.     Nuevas características:     Alertas cuando el precio llega a la z
AW Prime Oscillator MT5
AW Trading Software Limited
Una combinación de dos osciladores. El primero muestra los puntos de entrada, el segundo muestra la tendencia actual. El indicador puede mostrar señales de oscilador mediante flechas en dos modos, todas señales de oscilador rápido o señales solo en la dirección de la tendencia actual. Tiene un panel de múltiples períodos de tiempo y tres tipos de notificaciones de señales. Beneficios: Adecuado para operaciones intradía y especulación. Filtrado de tendencias Configuración sencilla y sensible Pane
Otros productos de este autor
AI Channel
Thalles Nascimento De Carvalho
4 (4)
Welcome to the presentation of the AI Channel indicator, a powerful tool that uses artificial intelligence for price channel analysis in the financial market. In this session, we will explore how this revolutionary indicator can assist investors and traders in making more informed and strategic decisions. Let's get started! I. What is the AI Channel indicator? AI Channel is an indicator developed based on advanced artificial intelligence algorithms. It utilizes historical price data of financial
FREE
Master OBV FX
Thalles Nascimento De Carvalho
5 (1)
The MasterOBV indicator is a powerful technical analysis tool that utilizes volume, positive correlation, and a Moving Average (MA) to enhance trend identification in financial markets. By incorporating assets with positive correlation through the indicator menu, MasterOBV provides a refined approach to assessing the strength and direction of trends. The inclusion of the Moving Average adds additional smoothing to price movements, aiding in a more accurate tracking of the underlying trend over
FREE
Long Short
Thalles Nascimento De Carvalho
4.67 (3)
Long & Short Indicator, tracks the movements of assets that have positive or negative correlation allowing to explore displacement in advance. - High Hit Rate With Real Time Information. - More Safe Entries in Operations. - Facilitates Short and Long Term Reading. - Option to trigger alert for the Levels. Information for Ea Buffer Symbol 1ª = 0 ;  Buffer Symbol 2ª = 2 ; * Free version only EURUSD! 
FREE
Swing Point Volume
Thalles Nascimento De Carvalho
Swing Point Volume, the indicator that signals weakness and strength at the tops and bottoms. This indicador can be for used the Wyckoff Method. Information provided; - Swing on customized ticks. - Volume and points in each balance sheet. - Percentage of Displacement. - Sound alert option on top and bottom breaks. - Volume in ticks and Real Volume. - Volume HL (extreme) or (opening and closing) - Customized volume shapes.
Atr Projection
Thalles Nascimento De Carvalho
El Indicador ATR Projeção destaca como una herramienta robusta en el análisis técnico, diseñada para proporcionar información precisa sobre los límites potenciales de movimiento de precios en el mercado financiero. Su enfoque flexible permite a los usuarios personalizar las métricas de análisis de manera intuitiva, adaptándose a las necesidades específicas de cada activo operado. Funcionamiento Personalizable: Por defecto, el ATR Projeção opera considerando el 30% de la media de los último
Box Weis Wave
Thalles Nascimento De Carvalho
5 (1)
Si eres un trader activo y estás buscando una forma efectiva de interpretar los movimientos del mercado financiero, te encantará conocer Weis Wave Box. Este increíble indicador ha sido diseñado para ofrecer un análisis visual claro y preciso de las ondas de volumen, junto con la representación de los puntos de giro correspondientes. Con sus cinco formas de giro personalizables y otras características únicas, Weis Wave Box destaca como una herramienta indispensable tanto para traders experimentad
Reversal Vol Propagation
Thalles Nascimento De Carvalho
¿Estás cansado de perder oportunidades de trading por no poder identificar las inversiones de precios a tiempo? ¿Quieres maximizar tus ganancias y tomar decisiones informadas en tus operaciones? Te presentamos el Indicador Reversal Vol Propagation, la herramienta revolucionaria que utiliza redes neuronales y datos de volumen para predecir posibles inversiones de precios. Basado en una poderosa combinación de algoritmos avanzados y tecnología de vanguardia, el Reversal Vol Propagation analiza met
Didi Index Volume
Thalles Nascimento De Carvalho
Presentamos el Didi Index Volume, un indicador de análisis técnico desarrollado por el trader brasileño Odir Aguiar, que destaca por su enfoque avanzado y poderoso en la identificación de oportunidades en el mercado financiero. Disponible en diversas plataformas, el Didi Index Volume se ha convertido en una herramienta esencial para los traders que buscan información precisa y valiosa para sus estrategias de negociación. El indicador combina el reconocido Didi Index, creado por Odir Aguiar, c
Smart Binary Volume
Thalles Nascimento De Carvalho
El indicador Smart Binary Volume es una herramienta versátil que combina el análisis del volumen de negociación con el aprendizaje automático (machine learning). Puede aplicarse en diversos mercados y estrategias, incluyendo el scalping y otros tipos de operaciones a corto plazo. Utilizando algoritmos avanzados de aprendizaje automático, el indicador identifica patrones complejos, generando señales de compra y venta con mayor precisión. Buffer to Create EA. Buffer Line Gold = 0. Buffer Line R
TimeChannel
Thalles Nascimento De Carvalho
El "Timechannel" es una poderosa herramienta de análisis técnico diseñada específicamente para traders que desean obtener una comprensión más profunda y precisa de los movimientos de precios en múltiples marcos de tiempo (multi-timeframe). Este indicador es una adición esencial al conjunto de herramientas de cualquier trader serio que busca tomar decisiones comerciales informadas y basadas en datos. Características clave: - Análisis Avanzado de Múltiples Timeframes: Timechannel permite a l
DeltaBook
Thalles Nascimento De Carvalho
El indicador Delta Book es una poderosa herramienta de análisis de mercado que combina el uso del delta de volumen con información del libro de órdenes para detectar el flujo de precios en los mercados financieros, como acciones, futuros y criptomonedas. Es importante tener en cuenta que el Delta Book requiere acceso a datos de volumen en tiempo real e información del libro de órdenes para aprovechar su máximo potencial. La característica principal del Delta Book es su estrategia avanzada de aná
Big Player Range
Thalles Nascimento De Carvalho
5 (2)
Bienvenido al indicador "BigPlayerRange", una herramienta de análisis técnico desarrollada para identificar áreas de interés significativas por parte de las instituciones financieras en los mercados. Este indicador proporciona un análisis preciso de los rangos de precios donde los principales participantes del mercado muestran una actividad e interés considerable. Principales características: 1. Mapeo de Áreas de Interés Institucional: "BigPlayerRange" destaca con precisión las áreas del g
Master OBV
Thalles Nascimento De Carvalho
The MasterOBV indicator is a powerful technical analysis tool that utilizes volume, positive correlation, and a Moving Average (MA) to enhance trend identification in financial markets. By incorporating assets with positive correlation through the indicator menu, MasterOBV provides a refined approach to assessing the strength and direction of trends. The inclusion of the Moving Average adds additional smoothing to price movements, aiding in a more accurate tracking of the underlying trend over
Smart Delta Volume
Thalles Nascimento De Carvalho
El Smart Delta Volume utiliza niveles dinámicos que se ajustan automáticamente según la volatilidad del mercado. Esta característica garantiza un análisis más preciso y adaptable a los cambios en las condiciones del mercado en tiempo real. Con la capacidad de ajustarse dinámicamente, el Smart Delta Volume ofrece una visión más amplia y confiable del flujo de volumen y la acción del precio. Además, el Smart Delta Volume presenta un validador de pullback, que se activa cuando el precio supera dos
Filtro:
No hay comentarios
Respuesta al comentario