Yearly Levels
- Indicadores
- Kristmundur Roman Zakharii
- Versión: 1.0
- Activaciones: 15
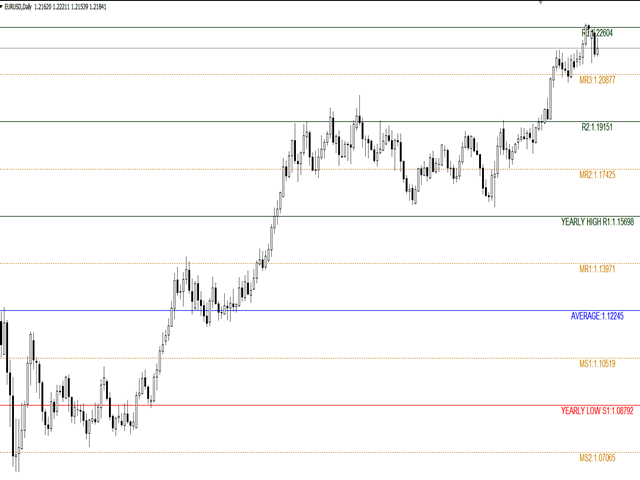
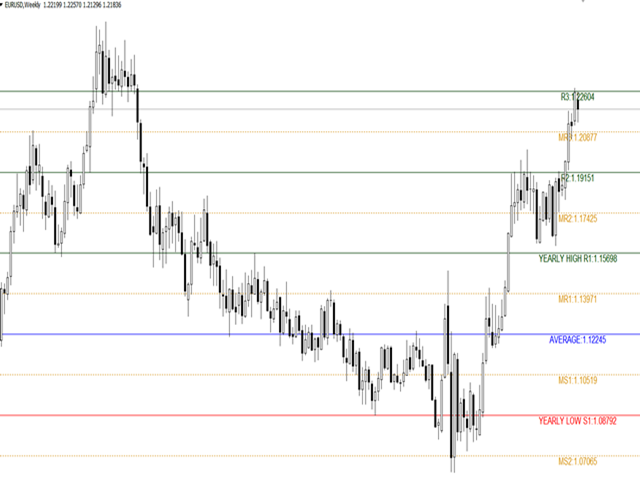
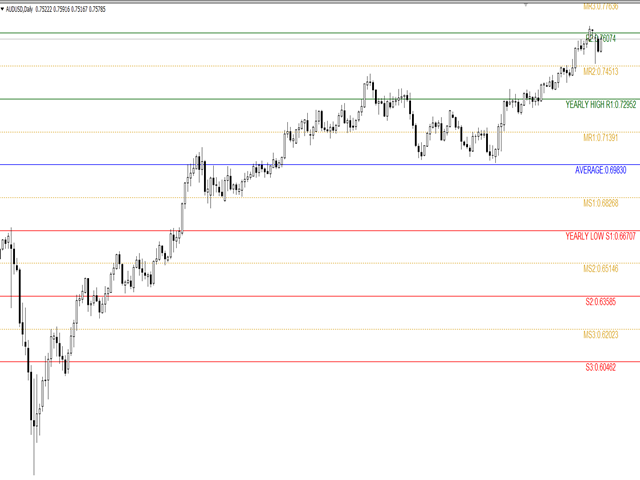
This indicator automatically plots Yearly High, Yearly Low and Yearly Average price levels from the previous year.
It also builds two additional equidistant parallel levels (Extended Highs R2, R3 /Extended Lows S2, R3) extended from previous Year High / Low.
Extended High R3 / Low S3 is 100 percent Low-to-High extension (as in Fibonacci 100 % extensions) above / below the previous Year H/L and is the final reversal level with a sure reaction.
Extended High/Low R3/S3 represent the ultimate yearly Resistance/Support.
The tool also plots Middle Yearly levels (MS1 and MR1) between the Yearly Average and the Yearly High / Low, as well as the Middles (MR2, MR3, MS2, MS3) between the Extended HL levels.
Typically, price stalls at the Middle Yearly Levels or does their retest as the break. Yearly Extended MS2 became the ultimate bottom of EURUSD 2020 March drop.
Monthly Close above the Yearly High / below the Yearly Low confirms yearly breakout / breakdown and sets the yearly trend.
At each Yearly level we observe major price reactions that last for days. After the break of the Yearly level price usually goes for its retest.
USAGE AND ADVANTAGES:
I believe "Yearly Highs and Lows" along with the average yeary price is a must-have tool of any trader as those reprsent crucial support and resistance where we see reversals, stalls, congestions, or retests.
To avoid key reversals, any trend trader must be aware of Yearly Lows and Highs, which one can not detect with a naked eye.
Trading the Yearly Levels removes all subjectivity, as they stay the same across all timeframes.
Use Yearly Levels as Targets and Exits as typically price surely reaches them or as Reversals (after a retest or rejection) for Entries.
Use the Yearly Levels aong with the static MTF moving averages (that do not change when you flip charts) or other trend detecting tools (i.e. Ichimoku, MACD).
For trend detection, I prefer adding "multitimeframe 8 EMA (Trigger Line)" - 8 EMA 4hrs, 8 EMA daily, 8 EMA weekly and 8 EMA monthly. This is an effective and non-subjective trading system alltogether.
Its is possible to change the levels' colour to silver or gray not to clutter the chart.
EXAMPLES:
- 2020 CRUDE OIL: After UKOIL broke 2019 low, it reversed at extended low S3 returning to the 2019 Low at 52.28 (with immediate reaction when hitting it) in December - SEE SCREENSHOT.
- 2020 EURUSD: Yearly extended high R3 (100 percent Low to High extension from 2019 High) became the top in EURUSD bullish rally of 2020 (the rally started after the break and retest of 2019 low to the upside) - SEE SCREENSHOT.
- 2020 EURUSD: March candle failed to close below 2019 low - devalidating the breakdown (multiple piercing on lower timeframes).
- 2020 SP500: US500 did a double retest of 2019 high after breaking it to the upside - SEE SCREENSHOT.
- 2020 AUDUSD: AUDUSD showed major reactions at every yearly level. March bearish run started from 2019 low. Price made a swing below extended yearly low S3 returning back to 2019 low (S1) with a stall below it. After AUD was rejected from the 2019 high it returned back to 2019 average price, from where it went for another breakout attempt - SEE SCREENSHOT.
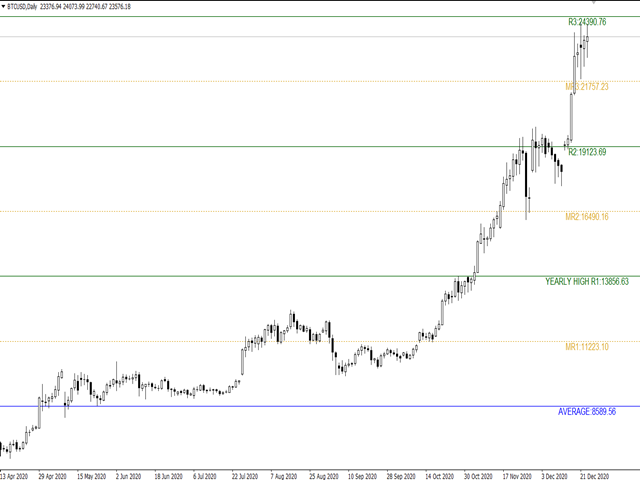
- 2020 BTCUSD: Bitcoin saw a congestion along 2019 the average price. The bullish rally started from 2019 high and stalled at Yearly extended high R2. After congestion and break of R2 the second bullish rally was again from R2 stalling at R3 (maximal bitcoin price in 2020) - SEE SCREENSHOT.
