• Información general
  • Comentarios
  • Discusión

Candle Size with MA

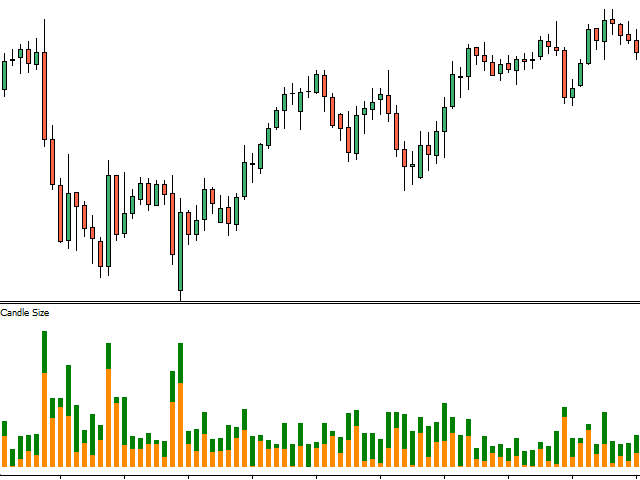
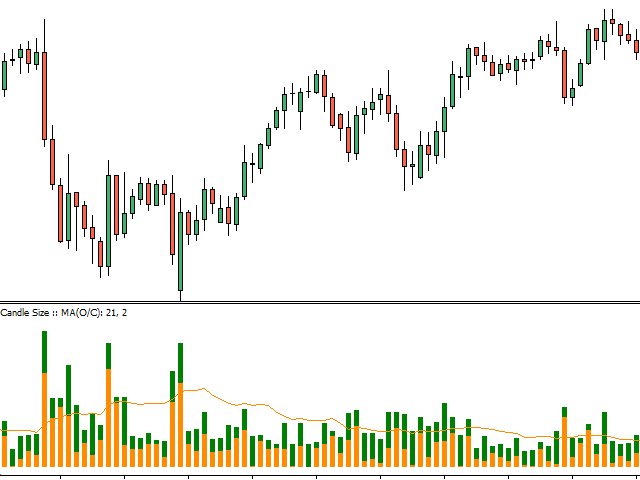
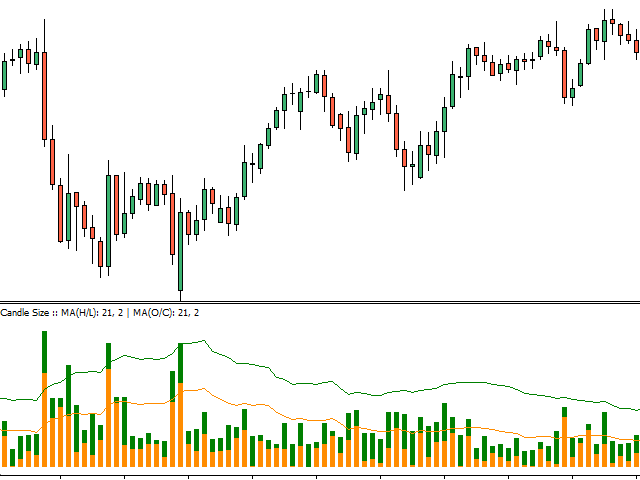
Индикатор отображает High-Low и Open-Close размеры свечей. Также по этим размерам можно построить простые скользящие средние. Линия скользящей средней строится по формуле: Линия MA = MA(Period) * Delta. Чтобы скрыть скользящую среднюю, достаточно установить ее период равным 0.


Чтобы собрать статистику по размерам свечей, используйте скрипт Candle Size Stats.


ПАРАМЕТРЫ

  • Period_MA_HL: период усреднения скользящей средней, построенной по размерам High-Low свечей
  • Delta_MA_HL: множитель для High-Low скользящей средней
  • Period_MA_OC: период усреднения скользящей средней, построенной по размерам Open-Close свечей
  • Delta_MA_OC: множитель для Open-Close скользящей средней

Productos recomendados
Un indicador técnico que calcula sus lecturas sobre los volúmenes de negociación. En forma de histograma, muestra la acumulación de la fuerza del movimiento del instrumento comercial. Dispone de sistemas de cálculo independientes para direcciones alcistas y bajistas. Funciona en cualquier instrumento comercial y marco de tiempo. Puede complementar cualquier sistema comercial. El indicador no vuelve a dibujar sus valores, las señales aparecen en la vela actual. Es fácil de usar y no carga el gr
UPD1 Profile Levels
Vitaliy Kuznetsov
5 (6)
El indicador encuentra los niveles de volumen de precio máximo y mínimo (perfil de mercado) en el gráfico de barras de trabajo para el número especificado de barras.   Perfil compuesto. La altura del histograma es completamente automática y se adapta a cualquier instrumento y marco de tiempo. Se utiliza un algoritmo de autor y no repite análogos conocidos. La altura de los dos histogramas es aproximadamente igual a la altura promedio de la vela. La alerta inteligente le ayudará a informar sobre
La singularidad de este indicador radica en el algoritmo de contabilidad de volumen: la acumulación se produce directamente para el período seleccionado sin referencia al comienzo del día. Las últimas barras se pueden excluir del cálculo, entonces los datos actuales tendrán menos influencia en los niveles significativos (volúmenes) formados anteriormente. Para un cálculo más preciso, los datos del gráfico M1 se utilizan de forma predeterminada. El paso de distribución de los volúmenes de precios
Blahtech Market Profile
Blahtech Limited
4.61 (18)
Was: $249  Now: $99   Market Profile defines a number of day types that can help the trader to determine market behaviour. A key feature is the Value Area, representing the range of price action where 70% of trading took place. Understanding the Value Area can give traders valuable insight into market direction and establish the higher odds trade. It is an excellent addition to any system you may be using. Blahtech Limited presents their Market Profile indicator for the MetaTrader community. Ins
BoxChart MT4
Evgeny Shevtsov
4.57 (7)
The market is unfair if only because 10% of participants manage 90% of funds. An ordinary trader has slim changes to stand against these "vultures". This problem can be solved. You just need to be among these 10%, learn to predict their intentions and move with them. Volume is the only preemptive factor that faultlessly works on any timeframe and symbol. First, the volume appears and is accumulated, and only then the price moves. The price moves from one volume to another. Areas of volume accumu
The   VWAP indicator   is our version of the popular Volume-Weighted Average Price indicator. The VWAP is the ratio between the value traded (price multiplied by the number of volume traded) and the total volume traded over a specific time period. As a result, it measures the average price of the instrument much better than the simple moving average. Although there are many ways to use the VWAP, most investors use it to calculate the daily average.  The indicator works in five modes: Moving  
Time Bubble ***Specialized for GBPJPY 1H time frame*** (tested for two years with success rates about 82%) Time Circle's smart algorithm detects the price circles with time . give strong signals at the right time as result of combine the price and time. our team spent months to develop this indicator specially for GBPJPY ..with high success rates about 82% win trades over two years .tested from December 2016 to November 2018. *** in last two years total signals 1012 with 829 Wins and
Le presentamos el indicador "Candle closing counter", que se convertirá en su asistente indispensable en el mundo del trading. Es por eso que saber cuándo se cerrará la vela puede ayudar: Si usted tiene gusto de negociar usando patrones de la vela, usted sabrá cuando la vela será cerrada. Este indicador le permitirá comprobar si se ha formado un patrón conocido y si hay una posibilidad de negociación. El indicador le ayudará a prepararse para la apertura del mercado y el cierre del mercado.
Simply The Best Pro
Szymon Palczynski
5 (1)
This indicator displays the histogram and arrows on chart. When Simple The Best Pro are placed on a chart, they identify the trend.  The color of may be blue or red. The blue color stands for upside moves and the red color stands for downside trends. The indicator offers to set Stop Loss (SL) and  Take Profit (TP)  setting. The default value is ATR. Indicator has automatic optimization. The STB is a unique indicator that shows the tendency (button Bars) of a particular signals. The STB tells us
Displays the local time with the time difference you set. (It does not correspond to the time difference in 30-minute increments.) It also displays a price line with a good price, such as 100.000 .100 or .200. The standard gridlines are displayed with the time and price by MT4, but they are very confusing as they become the broker's time and are displayed at the halfway point along with the price. It hides them and displays gridlines at user-defined time differences and prices in easy-to-und
Market Marker MT4
Evgeny Shevtsov
4.5 (8)
The indicator displays peak levels of activity formed by the maximum volume, tracks the correlation of the candles on all timeframes (from the highest to the lowest one). Each volume level is a kind of key trading activity. The most important cluster is inside a month, week, day, hour, etc. Indicator operation features A volume level receives Demand status if the nearest volume level located to the left and above has been broken upwards. A volume level receives Supply status if the nearest vol
Daily Candle Predictor es un indicador que predice el precio de cierre de una vela. El indicador está destinado principalmente para su uso en gráficos D1. Este indicador es adecuado tanto para el comercio de divisas tradicional como para el comercio de opciones binarias. El indicador se puede utilizar como un sistema de negociación independiente o puede actuar como una adición a su sistema de negociación existente. Este indicador analiza la vela actual, calculando ciertos factores de fuerza dent
Ante todo, vale la pena enfatizar que esta Herramienta de Trading es un Indicador No Repintado, No Redibujado y No Retrasado, lo que la hace ideal para el trading profesional. Curso en línea, manual del usuario y demostración. El Indicador de Conceptos de Acción del Precio Inteligente es una herramienta muy potente tanto para traders nuevos como experimentados. Combina más de 20 indicadores útiles en uno solo, combinando ideas avanzadas de trading como el Análisis del Trader del Círculo Interio
This is a new strategy for SUPPLY DEMAND areas It is based on a calculation using the tick volume to detect the big price action in market for both bear /bull actions this smart volume action candles are used to determine the supply and demand areas prices in between main supply and demand lines indicate sideway market  up arrows will be shown when prices moves above the main supply and the secondary supply lines Down arrows will be shown when prices moves below the main demand and the secondary
GND Tail Candle
Nguyen Dang Giang
A tall upper shadow occurs when the price moves during the period, but goes back down, which is a bearish signal. A tall lower shadow forms when bears push the price down, but bulls pull it back up, which leaves a long line or shadow. This is considered a bullish signal. Some technical analysts believe a tall or long shadow means the stock will turn or reverse. Some believe a short or lower shadow means a price rise is coming. In other words, a tall upper shadow means a downturn is coming, whil
This indicator is a conventional analytical tool for tick volumes changes. It calculates tick volumes for buys and sells separately, and their delta on every bar, and displays volumes by price clusters (cells) within a specified bar (usually the latest one). The algorithm used internally is the same as in the indicator VolumeDelta , but results are shown as cumulative volume delta bars (candlesticks). Analogous indicator for MetaTrader 5 exists - VolumeDeltaBars . This is a limited substitution
The Best One Scalping Trade Panel functional manual trade panel with risk reward, auto SL by candle ( original solution), lot size calculation, one-click trading, scale in and out of trades (partial close),  Works with all symbols not just currency pairs, perfect works on DAX, NASDAQ, GOLD, ...... I earn every day during live stream on ZakopiecFX - join Me Risk by lot Risk by percent SL by points SL by Candle, Renko, RangeBar ( original solution) TP by point TP by Risk/Reward Auto Trailing b
VolumeProfile
Robert Hess
3.8 (5)
Descption: The Volume Profile displays detailed informations of historical trading activities at certain price levels (Market Profile). So you can locate the areas with the best prices in the market and get an advantage about other market participants. Features: Customizable Volume Profile / Market Profile Shows the "fair" Value Area with 70% of all Volume Shows critical low volume zones Shows VPOC, VAL and VAH Points Works on all timeframes Also available for MT5 ( https://www.mql5.com/en/m
TWO PAIRS SQUARE HEDGE METER INDICATOR Try this brilliant 2 pairs square indicator It draws a square wave of the relation between your two inputs symbols when square wave indicates -1 then it is very great opportunity to SELL pair1 and BUY Pair2 when square wave indicates +1 then it is very great opportunity to BUY pair1 and SELL Pair2 the inputs are : 2 pairs of symbols         then index value : i use 20 for M30 charts ( you can try other values : 40/50 for M15 , : 30 for M30 , : 10 for H1 ,
UPD1 Volume Pixel
Vitaliy Kuznetsov
5 (3)
El indicador encuentra un volumen bajo, alto y extremo basado en los coeficientes dados y los colorea en los colores especificados. Reemplaza la función estándar de dibujo de volúmenes en el terminal metatrader. Las velas también se pueden pintar en el color del volumen. En las velas con un volumen extremo, se determina el volumen horizontal máximo (cluster/POC). Dependiendo de su ubicación (empujar, neutral, detener), el clúster también tiene su propio color. Si el clúster está en la sombra y
Volume solution
Mikhail Bilan
5 (1)
Volume, momentum, and market strength are key indications that price is about to move in a certain direction. The Volume-solution indicator is one indicator which can help traders objectively classify a momentum type of trade setup as one having volume and strength or not. What is the Volume-solution Indicator? The Trading Volume indicator is a custom technical indicator which works somewhat like a market sentiment indicator. It indicates the strength of the bulls and the bears of the market. Wh
Master Scalping M1 es un indicador innovador que utiliza un algoritmo para determinar la tendencia de forma rápida y precisa. El indicador calcula el tiempo de apertura y cierre de posiciones, los algoritmos del indicador le permiten encontrar los momentos ideales para ingresar a una operación (comprar o vender un activo), lo que aumenta el éxito de las transacciones para la mayoría de los comerciantes. Beneficios del indicador: Fácil de usar, no sobrecarga el gráfico con información innecesari
AV Grid
Anja Vivia Vogel
"AV Grid" is an indicator for MetaTrader 4, which automatically displays round numbers as horizontal lines and a sensible period separation . Round prices can be used as support and resistance in trading. It is an improvement on the "Grid" setting, which also draws a grid on the chart. Improvements : - Round levels instead of arbitrary positioning of the horizontals - Structure by highlighting all x lines (main lines, 2 or 5 makes sense) - Vertical lines are each in two periods (
TS krachobor
Magomed Zakaryaev
Всем привет! Выставляю свою торговую стратегию для форекс (далее - ТС). После покупки или аренды ТС пишете мне, я вас добавляют в закрытый чат телеграм, где дам все индикаторы и поддержку по торговле, и мы вместе будем торговать. Статистику по торговле в ТС я добавлю чуть позже, так как открыл новый счет по ТС, что бы было наглядно как проходит торговля. Кроме этого  я дам счет и пароль инвестора, можете сами смотреть в живую торговлю и решить для себя подходит ли она для вас. Два режима, 1) Сре
Volume by Price MT4
Brian Collard
4.71 (14)
The Volume by Price Indicator for MetaTrader 4 features Volume Profile and Market Profile TPO (Time Price Opportunity). Volume and TPO histogram bar and line charts. Volume Footprint charts. TPO letter and block marker collapsed and split structure charts. Session filtering and grouping. Static, dynamic and flexible range segmentation and compositing methods with relative and absolute visualizations. Graphical layering, positioning and styling options to suit the user's analytic and aesthetic n
Blahtech Supply Demand
Blahtech Limited
4.63 (35)
Was: $299  Now: $99   Supply Demand uses previous price action to identify potential imbalances between buyers and sellers. The key is to identify the better odds zones, not just the untouched ones. Blahtech Supply Demand indicator delivers functionality previously unavailable on any trading platform. This 4-in-1 indicator not only highlights the higher probability zones using a multi-criteria strength engine, but also combines it with multi-timeframe trend analysis, previously confirmed swings
Lisek Weis Wave
Darius Hans Lischka
5 (4)
This Weis Wave Volume indicator is a tool to help traders identify the current price trend.  Understanding volume can provide insight into a market's behavior to help you determine its overall health. The most important rule is this: volume precedes price. Typically, before a market price moves, volume comes into play. It has 2 main colors histogram which are green and red. – Green indicates an upward wave. The more the price increases, the bigger the green volume gets. – The red color shows a d
FREE
This is a Halftrend Scalper for MT4. Meant for Swinging markets with good volatility. Not suitable during low volatility.   Features: Wait for Price to cross Halftrend line. Select which HTF halftrend(Main Signal) Check Halftrend alignment between Higher Timeframes Check High Volume Bar (Optional) Halftrend Trends stacked (Optional)   What's in the Downloads Package Extras: - HT Scalper Scanner Dashboard (Keep in same directory as your Arrows indicator - or else won't work) - Modified MTF Ha
El indicador construye cotizaciones actuales, que se pueden comparar con las históricas y, sobre esta base, hacer un pronóstico de movimiento de precios. El indicador tiene un campo de texto para una navegación rápida a la fecha deseada. Opciones: Símbolo - selección del símbolo que mostrará el indicador; SymbolPeriod - selección del período del cual el indicador tomará datos; IndicatorColor - color del indicador; HorisontalShift: cambio de cotizaciones dibujadas por el indicador
Signal Dream
Yaroslav Varankin
The indicator for binary options without repainting is a powerful tool for traders. It ensures signal reliability without altering them after their appearance. Features: Non-repainting signals: The indicator provides stable and reliable signals that do not change after formation. Expiration time: Signals appear at the candlestick opening and expire within one candlestick of the current timeframe. Overlay method: In the event of a losing trade, it is recommended to use the overlay method with an
Los compradores de este producto también adquieren
Gann Made Easy
Oleg Rodin
4.93 (85)
Gann Made Easy es un sistema de comercio de Forex profesional y fácil de usar que se basa en los mejores principios de comercio utilizando la teoría del Sr. W. D. Gann. El indicador proporciona señales precisas de COMPRA y VENTA, incluidos los niveles de Stop Loss y Take Profit. Puede comerciar incluso sobre la marcha utilizando notificaciones PUSH. ¡Por favor, póngase en contacto conmigo después de la compra! ¡Compartiré mis consejos comerciales con usted y excelentes indicadores de bonificació
TPSpro RFI Levels
Roman Podpora
4.86 (21)
Reversal First Impulse levels (RFI)    INSTRUCTIONS        RUS       -       ENG              R ecommended to use with an indicator   -   TREND PRO -  Version MT5 A key element in trading is zones or levels from which decisions to buy or sell a trading instrument are made. Despite attempts by major players to conceal their presence in the market, they inevitably leave traces. Our task was to learn how to identify these traces and interpret them correctly. Main functions: Displaying active zones
¡Actualmente 20% OFF ! ¡La mejor solución para cualquier novato o trader experto! Este software funciona con 28 pares de divisas. Se basa en 2 de nuestros principales indicadores (Advanced Currency Strength 28 y Advanced Currency Impulse). Proporciona una gran visión general de todo el mercado de divisas. Muestra los valores de Advanced Currency Strength, la velocidad de movimiento de las divisas y las señales para 28 pares de divisas en todos los (9) marcos temporales. Imagine cómo mejorar
Gold Stuff
Vasiliy Strukov
4.89 (263)
Gold Stuff: un indicador de tendencia diseñado específicamente para el oro, también se puede usar en cualquier instrumento financiero. El indicador no se vuelve a dibujar ni se retrasa. El marco de tiempo recomendado es H1. Este indicador está escrito por EA Gold Stuff Advisor, puede encontrarlo en mi perfil.  Puede obtener una copia gratuita de nuestro indicador Strong Support y Trend Scanner, por favor envíe un mensaje privado. ¡a mí! IMPORTANTE! Póngase en contacto conmigo inmediatamente d
AT Forex Indicator MT4
Marzena Maria Szmit
5 (2)
The AT Forex Indicator MT4 is a sophisticated trading tool designed to provide traders with a comprehensive analysis of multiple currency pairs. This   powerful indicator   simplifies the complex nature of the forex market, making it accessible for both novice and experienced traders. AT Forex Indicator uses   advanced algorithms   to detect trends, patterns and is an essential tool for traders aiming to enhance their forex trading performance. With its robust features, ease of use, and reliabl
Scalper Inside PRO
Alexey Minkov
4.75 (59)
An exclusive indicator that utilizes an innovative algorithm to swiftly and accurately determine the market trend. The indicator automatically calculates opening, closing, and profit levels, providing detailed trading statistics. With these features, you can choose the most appropriate trading instrument for the current market conditions. Additionally, you can easily integrate your own arrow indicators into Scalper Inside Pro to quickly evaluate their statistics and profitability. Scalper Inside
TPSproTREND PrO
Roman Podpora
4.78 (18)
TPSpro TRENDPRO  - is a trend indicator that automatically analyzes the market and provides information about the trend and each of its changes, as well as giving signals for entering trades without redrawing! The indicator uses each candle, analyzing them separately. referring to different impulses - up or down impulse. Exact entry points into transactions for currencies, crypto, metals, stocks, indices!  -  Version MT5               DETAILED DESCRIPTION                R ecommended to use with
TrendMaestro
Stefano Frisetti
5 (3)
note: this indicator is for METATRADER4, if you want the version for METATRADER5 this is the link:  https://www.mql5.com/it/market/product/108106 TRENDMAESTRO ver 2.4 TRENDMAESTRO recognizes a new TREND in the bud, he never makes mistakes. The certainty of identifying a new TREND is priceless. DESCRIPTION TRENDMAESTRO identifies a new TREND in the bud, this indicator examines the volatility, volumes and momentum to identify the moment in which there is an explosion of one or more of these data a
FX Power MT4 NG
Daniel Stein
5 (11)
Obtenga su actualización diaria del mercado con detalles y capturas de pantalla a través de nuestro Morning Briefing aquí en mql5 y en Telegram ! FX Power MT4 NG es la nueva generación de nuestro popular medidor de fuerza de divisas, FX Power. ¿Y qué ofrece este medidor de fuerza de nueva generación? Todo lo que le encantaba del FX Power original PLUS Análisis de fuerza de ORO/XAU Resultados de cálculo aún más precisos Períodos de análisis configurables individualmente Límite de cálculo persona
Trend Punch
Mohamed Hassan
5 (16)
Manual guide:   Click here WEEK SALE PROMO:   $59 ONLY!  -- Next price is  $120 .  This indicator is unstoppable when combined with our other indicator called  Support & Resistance . After purchase, send us a message and you will get it   for  FREE as a BONUS! I like to use Trend Punch on XAUUSD on the M1 timeframe & higher ones!  Introducing Trend Punch , the revolutionary forex trend indicator that will transform the way you trade! Trend Punch is uniquely designed to provide pre
FX Volume
Daniel Stein
4.61 (36)
Obtenga su actualización diaria del mercado con detalles y capturas de pantalla a través de nuestro Morning Briefing aquí en mql5 y en Telegram ! FX Volume es el PRIMER y ÚNICO indicador de volumen que proporciona una visión REAL del sentimiento del mercado desde el punto de vista de un bróker. Proporciona una visión impresionante de cómo los participantes institucionales del mercado, como los brokers, están posicionados en el mercado Forex, mucho más rápido que los informes COT. Ver esta info
Advanced Supply Demand
Bernhard Schweigert
4.92 (313)
¡Actualmente con 33% de descuento! ¡La mejor solución para cualquier tráder principiante o experto! Este indicador es una herramienta comercial única, de alta calidad y asequible, porque incorpora una serie de características patentadas y una nueva fórmula. Con esta actualización, podrá mostrar zonas de doble marco temporal. No solo podrá mostrar un marco temporal más alto, sino también mostrar ambos, el marco temporal del gráfico MÁS el marco temporal más alto: MOSTRANDO ZONAS ANIDADAS. A todos
Atomic Analyst
Issam Kassas
5 (3)
En primer lugar, vale la pena enfatizar que este Indicador de Trading no repinta, no redibuja y no se retrasa, lo que lo hace ideal tanto para el trading manual como para el automatizado. Manual del usuario: configuraciones, entradas y estrategia. El Analista Atómico es un Indicador de Acción del Precio PA que utiliza la fuerza y el impulso del precio para encontrar una mejor ventaja en el mercado. Equipado con filtros avanzados que ayudan a eliminar ruidos y señales falsas, y aumentan el poten
Legacy of Gann
Pavel Zamoshnikov
4.85 (13)
The indicator very accurately determines the levels of the possible end of the trend and profit fixing. The method of determining levels is based on the ideas of W.D.Gann, using an algorithm developed by his follower Kirill Borovsky. Extremely high reliability of reaching levels (according to K. Borovsky  - 80-90%) Indispensable for any trading strategy – every trader needs to determine the exit point from the market! Precisely determines targets on any timeframes and any instruments (forex, met
Indicator : RealValueIndicator Description : RealValueIndicator is a powerful tool designed specifically for trading on the EURUSD pair. This indicator analyzes all EUR and USD pairs, calculates their real currency strength values, and displays them as a single realistic value to give you a head start on price. This indicator will tell you moves before they happen if you use it right. RealValueIndicator allows you to get a quick and accurate overview of the EURUSD currency pair tops and bottoms,
ACTUALMENTE 26% DE DESCUENTO ¡La mejor solución para cualquier operador novato o experto! Este indicador es una herramienta única, de alta calidad y asequible porque hemos incorporado una serie de características propias y una nueva fórmula. ¡Con sólo UN gráfico puede leer la Fuerza de la Divisa para 28 pares de Divisas! Imagínese cómo mejorará su operativa porque podrá señalar el punto exacto de activación de una nueva tendencia o de una oportunidad de scalping. Manual del usuario: haga
Trend Screener
STE S.S.COMPANY
4.83 (89)
Indicador de tendencia, solución única e innovadora para el comercio y filtrado de tendencias con todas las funciones de tendencias importantes integradas en una sola herramienta. Es un indicador 100% sin repintar de marcos temporales y monedas múltiples que se puede usar en todos los símbolos/instrumentos: divisas, materias primas, criptomonedas, índices y acciones. Trend Screener es un indicador de seguimiento de tendencia eficiente que proporciona señales de tendencia de flecha con puntos en
Currency Strength Wizard es un indicador muy poderoso que le proporciona una solución todo en uno para operar con éxito. El indicador calcula el poder de este o aquel par de divisas utilizando los datos de todas las monedas en múltiples marcos de tiempo. Estos datos se representan en forma de índice de moneda fácil de usar y líneas eléctricas de moneda que puede usar para ver el poder de esta o aquella moneda. Todo lo que necesita es adjuntar el indicador al gráfico que desea operar y el indicad
Entry Points Pro
Yury Orlov
4.7 (226)
Este es un genial indicador para MT4 que ofrece señales precisas para entrar en una transacción sin redibujar. Se puede aplicar a cualquier activo financiero: fórex, criptomonedas, metales, acciones, índices. Nos dará valoraciones bastante precisas y nos dirá cuándo es mejor abrir y cerra una transacción. Eche un vistazo  al vídeo  (6:22), ¡contiene un ejemplo de procesamiento de una sola señal que ha amortizado el indicador! La mayoría de los tráders mejoran sus resultados comerciales durante l
Enigmera
Ivan Stefanov
5 (4)
ENIGMERA: El núcleo del mercado https://www.enigmera.com Introducción Este indicador y sistema de negociación es un enfoque extraordinario de los mercados financieros. ENIGMERA utiliza los ciclos fractales para calcular con precisión los niveles de soporte y resistencia. Muestra la auténtica fase de acumulación y proporciona dirección y objetivos.  Un sistema que funciona tanto si estamos en una tendencia como en una corrección.  ¿Cómo funciona? ENIGMERA consta de tres líneas: la línea de s
NAM Order Blocks
NAM TECH GROUP, CORP.
5 (1)
Indicador de detección de Order Blocks multitimeframe para MT4. Características - Panel de control totalmente personalizable, proporciona una interacción completa. - Oculta y muestra el panel de control donde quieras. - Detecta OB en múltiples marcos de tiempo. - Permite seleccionar la cantidad de OB para mostrar. - Interfaz de usuario de diferentes OBs. - Diferentes filtros de OBs (regulares, rejection y sin capitalizar). - Alerta de proximidad de OBs. - Líneas ADR High y Low. - Servicio de not
M1 Arrow
Oleg Rodin
5 (14)
Una estrategia intradía basada en dos principios fundamentales del mercado. El algoritmo se basa en el análisis de volúmenes y ondas de precios utilizando filtros adicionales. El algoritmo inteligente del indicador da una señal solo cuando dos factores de mercado se combinan en uno. El indicador calcula ondas de cierto rango en el gráfico M1 utilizando los datos del marco de tiempo más alto. Y para confirmar la onda, el indicador utiliza el análisis por volumen. Este indicador es un sistema come
TakePropips Donchian Trend Pro
Eric John Pajarillaga Aldana
4.61 (18)
¡TakePropips Donchian Trend Pro   (MT4) es una herramienta poderosa y efectiva que detecta automáticamente la dirección de la tendencia utilizando el Canal Donchian y le proporciona señales comerciales de entrada y salida! Este indicador multifunción incluye un escáner de tendencias, señales comerciales, panel estadístico, filtro, sesiones comerciales y panel de historial de alertas. ¡Está diseñado para proporcionarle señales comerciales y ahorrarle horas analizando los gráficos! Puede descargar
All in One Trade
Alexey Minkov
4.48 (27)
The All-in-One Trade Indicator (AOTI) determines daily targets for EURUSD, EURJPY, GBPUSD, USDCHF, EURGBP, EURCAD, EURAUD, AUDJPY, GBPAUD, GBPCAD, GBPCHF, GBPJPY, AUDUSD, and USDJPY. All other modules work with any trading instruments. The indicator includes various features, such as Double Channel trend direction, Price channel, MA Bands, Fibo levels, Climax Bar detection, and others. The AOTI indicator is based on several trading strategies, and created to simplify market analysis. All-in-One
Conviértase en un Breaker Trader y obtenga beneficios de los cambios en la estructura del mercado a medida que se invierte el precio. El indicador de ruptura de bloque de órdenes identifica cuándo una tendencia o movimiento de precio se acerca al agotamiento y está listo para revertirse. Le alerta sobre cambios en la estructura del mercado que generalmente ocurren cuando una reversión o un retroceso importante están a punto de suceder. El indicador utiliza un cálculo patentado que identific
ACTUALMENTE 31% DE DESCUENTO Este indicador es una herramienta de transacción única, de alta calidad y asequible porque hemos incorporado una serie de características propias y una fórmula secreta. Con solo un gráfico, da Alertas para los 28 pares de divisas. ¡Imagina cómo mejorarás porque puedes identificar el punto de activación exacto de una nueva tendencia u oportunidad de crecimiento! Basado en nuevos algoritmos subyacentes , hace que sea aún más fácil identificar y confirmar operaciones po
El sistema PRO Renko es un sistema de trading de alta precisión especialmente diseñado para operar gráficos RENKO. Se trata de un sistema universal que se puede aplicar a diversos instrumentos de negociación. El sistema neutraliza eficazmente el llamado ruido de mercado, lo que le brinda acceso a señales de reversión precisas. El indicador es muy fácil de usar y solo tiene un parámetro responsable de la generación de señales. Puede adaptar fácilmente la herramienta a cualquier instrumento com
IX Power MT4
Daniel Stein
5 (6)
IX Power lleva por fin la insuperable precisión de FX Power a los símbolos que no son de Forex. Determina con exactitud la intensidad de las tendencias a corto, medio y largo plazo de tus índices, acciones, materias primas, ETF e incluso criptodivisas favoritas. Puede analizar todo lo que su terminal le ofrece. Pruébalo y experimenta cómo tu timing mejora significativamente a la hora de operar. Características principales de IX Power Resultados de cálculo 100% precisos y sin repintado -
El indicador de reversión de ADR le muestra de un vistazo dónde se cotiza actualmente el precio en relación con su rango diario promedio normal. Recibirá alertas instantáneas a través de una ventana emergente, correo electrónico o push cuando el precio exceda su rango promedio y los niveles por encima de su elección para que pueda saltar rápidamente a retrocesos y reversiones. El indicador dibuja líneas horizontales en el gráfico en los extremos del rango promedio diario y también extensiones p
Shepherd Gann Squares
Abdullah Alrai
4.9 (10)
Este indicador es un método de análisis de mercado basado en el artículo "Fórmula matemática para predicciones de mercado" escrito por W.D. Gann según los métodos del cuadrado de nueve y el cuadrado de 144. Manual de usuario: Add Your review And contact us to get it Puede comprar la versión MT5 completa en: https://www.mql5.com/en/market/product/28669 Puede probar en MT4 gratis: https://www.mql5.com/en/market/product/15320?source=Site +Profile+Seller#!tab=reviews Este producto
Otros productos de este autor
The script is created to save all graphic objects to a file, restore them from a file and delete all objects on the chart. Data is saved in the .csv file in the client terminal folder in the MQL4\files subfolder. If you do not specify a file name when saving or restoring objects, then the name of the current trading instrument, for example, EURUSD or USDJPY, will be used as it. To use a script, just drag and drop it onto the chart.
Скользящее среднее с уровнями, построенными на основе индикатора ATR. В отличие от обычных уровней с постоянным отклонением, которые можно добавить к Moving Average, в уровнях MA with ATR bands учитывается волатильность рынка. Основной вариант использования индикатора: покупать при пробое верхнего уровня, продавать - при пробое нижнего. ПАРАМЕТРЫ MA_Period : п ериод усреднения скользящей средней MA_Method : м етод усреднения   скользящей средней MA_Price : и спользуемая цена для скользящей сре
ZZ Histogram отображает длину и направление волны на ценовом графике. Минимальный размер волны задается в настройках. По своей сути данный индикатор - тот же зигзаг (можете скачать здесь ), который определяет ценовые волны не меньше определенной длины, но только в виде гистограммы. Это можно увидеть на скриншотах. Для сбора статистики по размерам ценовых волн используйте идикатор   Wave Size Stats . ПАРАМЕТРЫ MinWaveSize: минимальная длина волны, на которую реагирует индикатор. Для маленьк
Индикатор показывает количество и направление переходов цены между уровнями сетки. Шаг сетки устанавливается в настройках. Индикатор будет особенно полезен трейдерам, торгующим по Мартингейлу, как инструмент для определения оптимальной точки входа. ПАРАМЕТРЫ Step: размер шага сетки (например: step = 50, shift = 0, тогда уровни будут иметь значения ...1.1050, 1.1100, 1.1150...) Shift: сдвиг сетки (например: step = 50, shift = 25, тогда уровни будут иметь значения ...1.1075, 1.1125, 1.1175...)
Зигзаг строится по ценовым волнам, размер которых не меньше заданного в настройках. Индикатор не способен нарисовать две вершины (максимум и минимум) на одной свече, поэтому для определения волн небольших размеров следует использовать меньшие таймфреймы графика. Зигзаг в виде гистограммы можете скачать здесь . Для сбора статистики по размерам ценовых волн используйте идикатор   Wave Size Stats . ПАРАМЕТРЫ MinWaveSize: минимальный размер волны, на котором будет построено очередное плечо зиг
Гистограмма отображает длину ценовых волн, которые не меньше заданного размера. Индикатор наглядно показывает  направление коротких/длинных ценовых движений и динамику волатильности. Также Wave Size Histogram подойдет для поиска закономерностей в ценовых движениях. Например, после крупной волны (большое значение гистограммы) зачастую идет слабое движение цены в противоположную сторону (небольшое значение гистограммы), которое идеально пододит для торговли по Мартингейлу. Для сбора статистики п
Скрипт собирает статистику по размерам свечей и сохраняет данные в файл CSV. Каждая строка таблицы - это отдельная свеча с ее характеристиками: время, направление (1 - бычья/доджи, -1 - медвежья), размер верхней и нижней тени, размер тела и полный размер свечи. Индикатор, который отбражает размеры свечей, а также построенные по этим размерам скользящие средние, можно скачать здесь . ПАРАМЕТРЫ FileName:  имя файла, в который экспортируются данные. Если оставить поле пустым, то имя файла - "Ca
Скрипт собирает размеры всех ценовых волн на текущем графике, которые не меньше заданной величины, и сохраняет их в CSV файл. Каждая строка таблицы будет содержать дату/время окончания волны и ее размер. Если вам нужно знать размеры волн в реальном времени, то воспользуйтесь индикатором Wave Size into ZigZag , Wave Size Histogram  или ZZ Histogram . ПАРАМЕТРЫ MinWaveSize:  минимальный размер дял волн, которые попадут в статистику PositiveValues:   true  - в файл сохраняется только размер вол
Скрипт используется для сбора статистики по переходам цены между уровнями сетки, размер которой задается в настройках (смотрите индикатор Transitions between levels ). Данные записываются в CSV файл. Есть два режима сбора статистики: SeparateTransition - учитывается каждый отдельный переход (смотрите скриншот 2). Время перехода - время, когда цена коснулась нового уровня. Accumulation - в файл записывается количество однонаправленных переходов  (смотрите скриншот 4). Например, -7 - семь пеерех
Индикатор присваивает каждой свече уникальный код, который зависит от ее параметров - направления, размеров верхней и нижней тени и размера тела. Алгоритм расчета кода свечи следующий: строится семизначный двоичный код, первое место в котором обозначает направление свечи, 2-е и 3-е места - размер тела, 3-е и 4-е - размер верхней тени, 5-е и 6-е - размер нижней тени (см. скриншот 7). На эти позиции ставится 0 или 1 в зависимости от параметров свечи: Направление свечи (цвет тела) 1 – бычья св
Скрипт вычисляет коды свечей на текущем графике и сохраняет их в CSV файл. Таблица в файле состоит из двух колонок: дата/время свечи и ее код. Подробнее о коде свечи и об алгоритме его расчета читайте в описании к индикатору Candle Code . ПАРАМЕТРЫ FileName:   имя файла, в который экспортируются данные. Если оставить поле пустым, то имя файла - "Candle Code. ' ВАЛЮТНАЯ ПАРА' 'ТАЙМФРЕЙМ' "
Filtro:
No hay comentarios
Respuesta al comentario