Time Range Pivot Points
- Indicadores
- Nikolay Georgiev
- Versión: 1.0
- Activaciones: 10
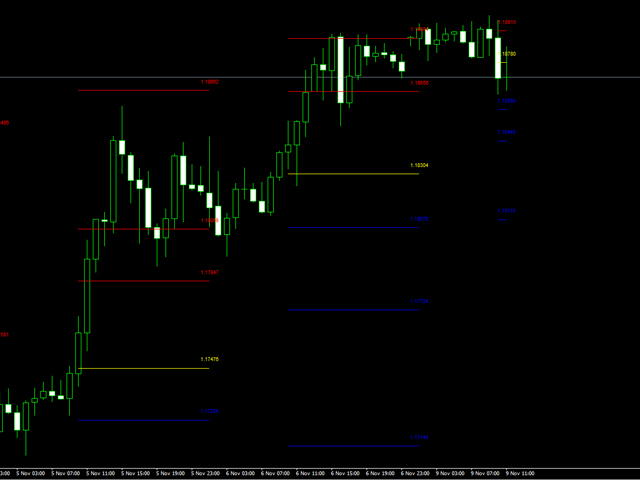
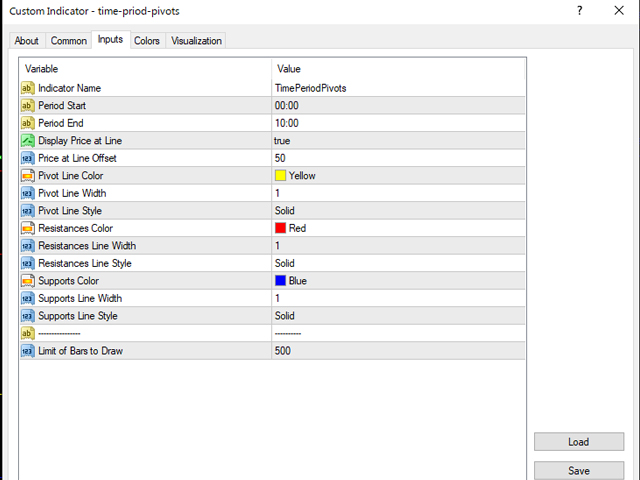
Time Range Pivot Points is an indicator that will plot Pivot Point + Support and Resistance levels on the chart, but it will calculate the formula based on a specific time range, that can be defined in the settings.
If you want to successfully trade the European and US sessions it will be smart to check all levels generated by the Asian session time range. This indicator will allow you to do that.
Everything is designed to get you an advantage of the potential support and resistance levels for the upcoming session based on the range of the previous session.
The indicator has a lot of settings to allow everyone to choose the style and color of the lines.
The indicator of the formula is the regular one:
Pivot = (H + L + C) / 3
R 1 = P + (P − L) = 2×P − L
S 1 = P − (H − P) = 2×P − H
R 2 = P + (H − L)
S 2 = P − (H − L)
R 3 = H + 2×(P − L) = R 1 + (H − L)
S 3 = L − 2×(H − P) = S 1 − (H − L)

