• Información general
  • Comentarios (1)
  • Discusión (8)

Vertical Line Repetition On Time

5
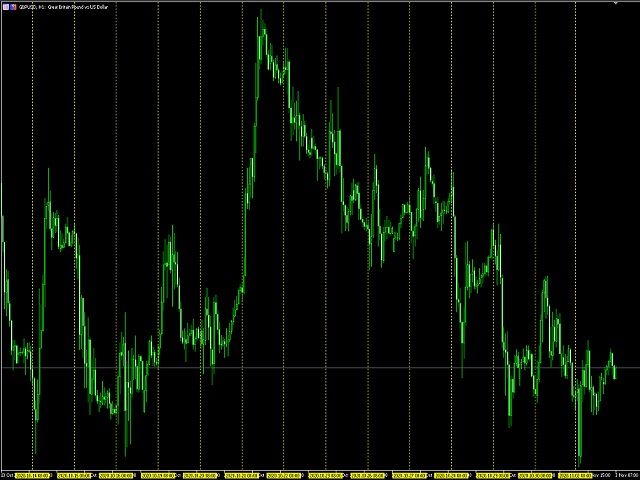
This indicator draws a vertical line repeatedly at the set time.
The number of lines that can be set can be set arbitrarily.
In addition, it is possible to set 4 types of lines.
It is possible to change different times, colors, line types, etc.
The time can be set to any time in minutes.


In the next version, we plan to display the high and low prices within the setting range.


Comentarios 1
Mary Gomes
277
Mary Gomes 2022.06.05 06:36 
 

Very useful tool to me.

Productos recomendados
Curver Arrows
Francis Dube
4 (9)
Es un indicador muy bien conocido. Ha sido portado directamente desde la versión para MetaTrader 4 que está disponible libremente en Internet. No se redibuja en absoluto. El indicador implementa la estrategia de la ruptura. Las flechas indican la dirección del mercado. Utilice este indicador en los períodos de M15 y superiores.
FREE
Just another   Auto Fibonacci Retracement indicator . However, this is the most   Flexible   &   Reliable   one you can find for FREE. If you use this indicator and you like it, please leave a review/comment. If you are looking for a more advanced Fibo indicator, check this Free  Trend-Based Fibo indicator . ### FEATURES ### Auto-calculate up to 7 Fibonacci levels on your customized frame. Adjust levels as your need. Use High/Low price or  Open/Close price to calculate. Freeze the levels and don
FREE
Important Lines
Terence Gronowski
4.88 (26)
Indicador de líneas importantes (M1 - M15) Este indicador muestra Líneas pivote, Día anterior alta y baja, Cierre día anterior y el mínimo y máximo de la hora anterior. Simplemente tiene que arrastrar ese único indicador al diagrama para tener todas esas líneas importantes. Puede evitar cargar muchos indicadores individuales. ¿Por qué ciertas líneas son tan importantes cuando se comercia? El día a día, alto y bajo: estos son observados por los comerciantes que comercian en un gráfico dia
FREE
Automatic Trendlines
Pasi Hakamaki
4.65 (51)
El indicador dibuja líneas de tendencia en el gráfico. Este indicador tiene seis entradas. El usuario puede especificar etiquetas alternativas para ambas líneas. Si se utilizan varias instancias del indicador, las etiquetas deben ser diferentes. El usuario puede establecer el ancho y el color de las líneas y la profundidad, lo que especifica qué picos significativos deben usarse. Por ejemplo, Depth = 10 establece líneas de tendencia utilizando los picos y valles actuales que tienen al menos 10 b
FREE
This indicator is an automated version of the Fibonacci retracement (Fib) indicator. Deciding the best areas to use when drawing the fib can be tricky and this  indicator was made with that in mind. When you drop it on the chart it will automatically choose the best points to draw the fib with, but in case you aren't satisfied with those regions, you can adjust it as you wish.
FREE
PZ The Zone MT5
PZ TRADING SLU
5 (1)
This indicator displays buy or sell signals according to Bill Williams' definition of the Trading Zone. [ Installation Guide | Update Guide | Troubleshooting | FAQ | All Products ] Easy to use and understand Avoid trading flat markets Deterministic indicator with clear rules The indicator is non-repainting It implements alerts of all kinds It has straightforward trading implications. A blue arrow is a buy signal A red arrow is a sell signal According to Bill Williams trading in the zone helps t
FREE
Free automatic Fibonacci is an indicator that automatically plots a Fibonacci retracement based on the number of bars you select on the BarsToScan setting in the indicator. The Fibonacci is automatically updated in real time as new highest and lowest values appears amongst the selected bars. You can select which level values to be displayed in the indicator settings. You can also select the color of the levels thus enabling the trader to be able to attach the indicator several times with differe
FREE
El Capturador de Tendencias: La Estrategia del Capturador de Tendencias con Indicador de Alerta es una herramienta versátil de análisis técnico que ayuda a los traders a identificar las tendencias del mercado y los posibles puntos de entrada y salida. Presenta una Estrategia dinámica del Capturador de Tendencias, adaptándose a las condiciones del mercado para una clara representación visual de la dirección de la tendencia. Los traders pueden personalizar los parámetros para que se ajusten a s
FREE
Follow The Line MT5
Oliver Gideon Amofa Appiah
4.42 (31)
This indicator obeys the popular maxim that: "THE TREND IS YOUR FRIEND" It paints a GREEN line for BUY and also paints a RED line for SELL. (you can change the colors). It gives alarms and alerts of all kinds. IT DOES NOT REPAINT and can be used for all currency pairs and timeframes. Yes, as easy and simple as that. Even a newbie can use it to make great and reliable trades. NB: For best results, get my other premium indicators for more powerful and reliable signals. Get them here: https://www.m
FREE
El indicador identifica cuando ocurre una divergencia entre el precio y un indicador u oscilador. Identifica divergencias tanto regulares como ocultas. Combinado con sus propias reglas y técnicas, este indicador le permitirá crear (o mejorar) su propio sistema poderoso. Características Puede detectar divergencias para los siguientes osciladores / indicadores:       MACD, OsMA, estocásticos, RSI, CCI, RVI, Awesome, ADX, ATR, OBV, índice compuesto, MFI y Momentum. Solo se puede seleccionar un os
FREE
La esencia del sistema consiste en la identificación del momento de formación de la vela compuesta "de vuelta" con características determinadas (tamaño de la vela en puntos, estructura de sombras).En el análisis de las velas japonesas el análogo de estas velas de vuelta son "Martillo" (Hammer) y "Hombre colgado" (Hanging Man), pero en este sistema el cuerpo de la vela no tiene que ser obligatoriamente pequeño, y la vela resultante se construye de varias velas. Parámetros de entrada del sistema:
FREE
Donchian Pro
Paulo Henrique Faquineli Garcia
5 (2)
The Donchian Channel Channels are among the most popular tools of technical analysis, as they visually convey to the analyst the limits within which most price movement tends to occur. Channel users know that valuable information can be obtained at any time, whether prices are in the central region of a band or close to one of the border lines. One of the best known techniques to explore these concepts is Bollinger Bands. However, John Bollinger was not the only one to research the applicatio
FREE
Original MACD
Kirill Paskhin
5 (4)
Moving Average Convergence/Divergence — схождение/расхождение скользящих средних — технический индикатор, разработанный Джеральдом Аппелем (Gerald Appel), используемый в техническом анализе для проверки силы и направления тренда, а также определения разворотных точек. Встроенный в MetaTrader 5 индикатор MACD не соответствует задумке автора (Gerald Appel): -линия MACD графически изображена в виде гистограммы, однако гистограммой отражается разница между линией MACD и сигнальной линией;  -сигнал
FREE
The indicator plots a curve of the difference between the values ​​of two trading instruments (currency pairs). The purpose of the indicator is to observe the processes of divergence and convergence of the values ​​of two trading instruments. The results obtained can be used for trading strategies of statistical arbitrage, pair trading, correlation, and others. Trading strategy The indicator is attached to the chart of any trading instrument. In the input parameters, the names of trading i
FREE
Super Fractals
Aurthur Musendame
5 (5)
Think of the Super Fractal Indicator as the Bill WIlliams Indicator on Steroids. Indicator Abilities: 1. Adjust Candle around Fractal High or Low. 2. Adjust Lookback period and only plot for a specific number of history candles avoiding cluttering your trading desk. 3. The Indicator uses buffers so you call and use it from any EA. Note : The higher the candles around Fractal, the stronger the Turning point anfd viceversa is true.
FREE
Virtual Targets MT5
Hoang Van Dien
4.75 (8)
This indicator is very useful for day traders or short term traders. (MT5 version) No need to calculate the number of pips manually, just look at the chart and you will see the Virtual Take Profit / Virtual Stop Loss target line and evaluate whether the entry point is feasible to reach the intended target or not. Enter the intended   Take Profit / Stop Loss   pips for your trade. The indicator will display   Virtual Take Profit / Virtual Stop Loss   lines for you to easily see if the target i
FREE
Pivot Point Fibo RSJ es un indicador que rastrea las líneas de soporte y resistencia del día utilizando las tasas de Fibonacci. Este espectacular indicador crea hasta 7 niveles de soporte y resistencia a través del Pivot Point utilizando las tasas de Fibonacci. Es fantástico cómo los precios respetan cada nivel de este soporte y resistencia, donde es posible percibir posibles puntos de entrada / salida de una operación. Características Hasta 7 niveles de soporte y 7 niveles de resistencia
FREE
The   OHLC indicator   shows the current and historical values of High, Low, Open, Close and Mid for a specific time period. It can plot the current values or the values from the previous session. The indicator's range can be calculated from a daily, weekly, monthly, or user-specified session. Levels High  of the current or previous session. Low  of the current or previous session. Open  of current or previous session. Close  of the current or previous session. Midpoint  of the current or pre
FREE
TradeQL
Abdiel Aviles Jimenez
The TradeQL Indicator is a customizable tool that highlights specific trading patterns on candlestick charts. Users can define patterns through TradeQL queries, which the indicator then applies to the chart, visually representing matches and captured groups. Ideal for identifying complex trade setups in real-time. TradeQL queries are specified using the TradeQL Language. See https://github.com/abdielou/tradeql for more details. This language is expressed as a regular expression. The language a
FREE
ZigZag Support Resistance
Emmanuel Tshepang Mosweu
5 (3)
This indicator uses the Zigzag indicator to identify swing highs and swing lows in the price chart.  Once it has identified the swing highs and swing lows, it can use them to determine potential support and resistance levels. A support level is formed when the price drops and bounces back up from a swing low, indicating that there is buying pressure at that level. A resistance level is formed when the price rises and reverses downward from a swing high, suggesting selling pressure at that level.
FREE
Are you tired of drawing trendlines every time you're analyzing charts? Or perhaps you would like more consistency in your technical analysis. Then this is for you. This indicator will draw trend lines automatically when dropped on a chart. How it works Works similar to standard deviation channel found on mt4 and mt5. It has 2 parameters: 1. Starting Bar 2. Number of bars for calculation The   starting bar   is the bar which drawing of the trend lines will begin, while the   number of bars for c
FREE
Pivot MT5
Dmitrij Isaenko
5 (1)
El indicador dibuja líneas de soporte y resistencia diarias en el gráfico, así como el nivel de pivote (nivel de pivote). Adaptado para trabajar en MT5. Parámetros del indicador: DayBack - el número de días para marcar líneas; PPcolor - línea de color Pivot; PPwidth - grosor de línea Pivot; PPstyle - estilo de línea Pivot; Supp - color de las líneas de apoyo; Sstyle - estilo de línea de apoyo; Swidth - espesor de las líneas de apoyo; Resistir - color de las líneas de resistencia; Rstyle -
FREE
What is MACD? MACD is an acronym for Moving Average Convergence Divergence . This technical indicator is a tool that’s used to identify moving averages that are indicating a new trend, whether it’s bullish or bearish. There is a common misconception when it comes to the lines of the MACD. There are two lines: The " MACD Line " The " Signal Line " The two lines that are drawn are NOT moving averages of the price. The MACD Line is the difference (or distance) between two moving
FREE
Bounce Zone MT5
Nguyen Thanh Cong
4.14 (7)
Introduction The Bounce Zone indicator is a cutting-edge non-repainting technical tool built to identify key areas on the price chart where market sentiment is likely to cause a significant price reversal. Using advanced algorithms and historical price data analysis, this indicator pinpoints potential bounce zones. Combined with other entry signal, this indicator can help forex traders place the best trades possible Signal A possible buy signal is generated when price is in the green zo
FREE
V1 Stochastic Alert
Paul Conrad Carlson
5 (1)
Stochastic indicator alerts  when  EA Available in comments , must have indicator installed buys stochastic main line is above  signal line stochastic is below 30 rsi 5 is below 20 sell stochastic main line is below signal line stochastic is above 70 rsi 5 is above 80 ADD to chart  Stochastic k 30 - d 9 - slowing 3, levels 30/70 rsi 5 lelels 20.80 Full alerts  push, mobile , email ect All input settings variable  feel free to contact for more information or alert sugestions
FREE
Bienvenido a nuestro   patrón de onda de precios   MT5 --(Patrón ABCD)-- El patrón ABCD es un patrón comercial poderoso y ampliamente utilizado en el mundo del análisis técnico. Es un patrón de precio armónico que los comerciantes utilizan para identificar oportunidades potenciales de compra y venta en el mercado. Con el patrón ABCD, los operadores pueden anticipar posibles movimientos de precios y tomar decisiones informadas sobre cuándo ingresar y salir de las operaciones. Versión EA:   P
FREE
Trend Master Chart MT5
Frederic Jacques Collomb
5 (2)
Trend Master Chart es el indicador de tendencia que necesita. Se superpone al gráfico y utiliza códigos de colores para definir diferentes tendencias/movimientos del mercado. Utiliza un algoritmo que combina dos medias móviles y diferentes osciladores. Los periodos de estos tres elementos son modificables. Funciona en cualquier período de tiempo y en cualquier par. De un vistazo podrás identificar una tendencia alcista o bajista y los diferentes puntos de entrada a esta tendencia. Por ejemplo
FREE
Fundamental Key Levels
Daniel Gregory Dorohov
2 (1)
I am sure you have noticed such a feature as setting the Stop Loss or Take Profit level at the round levels, for example 1.3500, a round number that determines the beginning of a new “candle” - numbers that end in two or three zeros are called round numbers. On daily trading periods, approaching support or resistance levels, as a rule, does not cause a pullback or rally, as traders have to be more demanding in choosing such levels and often the levels indicated by round numbers are used for this
FREE
AMPV Reversals
Alexandru Macarov
AMPV Reversals is the perfect indicator for both beginners and experienced traders.  Due to the simplicity and convenience every user can give it a try and choose the pattern they search for. The indicator analyzes the market structure and identifies the candlestick patterns in order to help traders to find the best entry points. Reccomended to use in couple with some trend indicators for best results.       Advantages: Works on all pairs and timeframes Doesn't redraw its results Wor
FREE
Screen Shoter
Andrey Khatimlianskii
4.33 (3)
Indicator for "screenshoting" the chart at a specified interval. The files are saved in the " MQL5\Files\ScreenShots\Symbol TF\ " directory and named as the date and time the screenshot was taken ( 2017.06.20 23.56.24.png ) Settings: Width and Height — width and height of the saved screenshots, IntervalSeconds — the saving interval in seconds. Attention ! If you set a large size for screenshots and a high frequency, you may run out of space on the hard drive. Do not delete the folder where the s
FREE
Los compradores de este producto también adquieren
Atomic Analyst MT5
Issam Kassas
4.78 (18)
En primer lugar, vale la pena enfatizar que este Indicador de Trading no repinta, no redibuja y no se retrasa, lo que lo hace ideal tanto para el trading manual como para el automatizado. Manual del usuario: configuraciones, entradas y estrategia. El Analista Atómico es un Indicador de Acción del Precio PA que utiliza la fuerza y el impulso del precio para encontrar una mejor ventaja en el mercado. Equipado con filtros avanzados que ayudan a eliminar ruidos y señales falsas, y aumentan el poten
Primero que todo, vale la pena enfatizar que este Sistema de Trading es un Indicador No Repintado, No Redibujado y No Retrasado, lo que lo hace ideal tanto para el trading manual como para el automatizado. Curso en línea, manual y descarga de ajustes preestablecidos. El "Sistema de Trading Inteligente MT5" es una solución completa de trading diseñada para traders nuevos y experimentados. Combina más de 10 indicadores premium y presenta más de 7 estrategias de trading robustas, lo que lo convie
Quantum Trend Sniper
Bogdan Ion Puscasu
4.92 (48)
Introduciendo       Indicador Quantum Trend Sniper   , el innovador indicador MQL5 que está transformando la forma en que identificas y negocias los cambios de tendencia. Desarrollado por un equipo de comerciantes experimentados con experiencia comercial de más de 13 años,       Indicador de francotirador de tendencia cuántica       está diseñado para impulsar su viaje comercial a nuevas alturas con su forma innovadora de identificar cambios de tendencia con una precisión extremadamente alta.
Gold Stuff mt5
Vasiliy Strukov
4.9 (182)
Gold Stuff mt5: un indicador de tendencia diseñado específicamente para el oro, también se puede usar en cualquier instrumento financiero. El indicador no se vuelve a dibujar ni se retrasa. El marco de tiempo recomendado es H1. IMPORTANTE! Póngase en contacto conmigo inmediatamente después de la compra para obtener instrucciones y bonificación!   Puede obtener una copia gratuita de nuestro indicador Strong Support y Trend Scanner, por favor envíe un mensaje privado. ¡a mí! PARÁMETROS Draw
TPSproTREND PrO MT5
Roman Podpora
4.89 (9)
TPSpro TREND PRO  - is a trend indicator that automatically analyzes the market and provides information about the trend and each of its changes, as well as giving signals for entering trades without redrawing! The indicator uses each candle, analyzing them separately. referring to different impulses - up or down impulse. Exact entry points into transactions for currencies, crypto, metals, stocks, indices!  Version MT4               DETAILED DESCRIPTION               R ecommended to use with an
Ante todo, vale la pena enfatizar que esta Herramienta de Trading es un Indicador No Repintado, No Redibujado y No Retrasado, lo que la hace ideal para el trading profesional. Curso en línea, manual del usuario y demostración. El Indicador de Conceptos de Acción del Precio Inteligente es una herramienta muy potente tanto para traders nuevos como experimentados. Combina más de 20 indicadores útiles en uno solo, combinando ideas avanzadas de trading como el Análisis del Trader del Círculo Inte
Trend Screener Pro MT5
STE S.S.COMPANY
4.88 (67)
Desbloquee el poder del comercio de tendencias con el indicador Trend Screener: ¡su solución definitiva para el comercio de tendencias impulsada por lógica difusa y un sistema multidivisa!Mejore su comercio de tendencias con Trend Screener, el revolucionario indicador de tendencias impulsado por lógica difusa. Es un poderoso indicador de seguimiento de tendencias que combina más de 13 herramientas y funciones premium y 3 estrategias comerciales, lo que lo convierte en una opción versátil para co
Reversal First Impulse levels (RFI)      INSTRUCTIONS        RUS       -       ENG              R ecommended to use with an indicator   -   TPSpro  TREND PRO -  Version MT4                 A key element in trading is zones or levels from which decisions to buy or sell a trading instrument are made. Despite attempts by major players to conceal their presence in the market, they inevitably leave traces. Our task was to learn how to identify these traces and interpret them correctly. Main functi
Este tablero muestra los últimos   patrones armónicos   disponibles para los símbolos seleccionados, por lo que ahorrará tiempo y será más eficiente /   versión MT4 . Indicador gratuito:   Basic Harmonic Pattern Columnas del indicador Symbol:   aparecerán los símbolos seleccionados Trend :   alcista o bajista Pattern :   tipo de patrón (gartley, mariposa, murciélago, cangrejo, tiburón, cifrado o ABCD) Entry :   precio de entrada SL:   precio de stop loss TP1:   1er precio de toma de benefici
Este es un genial indicador para MT5 que ofrece señales precisas para entrar en una transacción sin redibujar. Se puede aplicar a cualquier activo financiero: fórex, criptomonedas, metales, acciones, índices. Nos dará valoraciones bastante precisas y nos dirá cuándo es mejor abrir y cerra una transacción. Eche un vistazo  al vídeo  (6:22), ¡contiene un ejemplo de procesamiento de una sola señal que ha amortizado el indicador! La mayoría de los tráders mejoran sus resultados comerciales durante l
AT Forex Indicator MT5
Marzena Maria Szmit
5 (4)
The AT Forex Indicator MT5 is a sophisticated trading tool designed to provide traders with a comprehensive analysis of multiple currency pairs. This powerful indicator simplifies the complex nature of the forex market, making it accessible for both novice and experienced traders. AT Forex Indicator uses advanced algorithms to detect trends, patterns and is an essential tool for traders aiming to enhance their forex trading performance. With its robust features, ease of use, and reliable signal
Atbot
Zaha Feiz
4.86 (7)
AtBot: Cómo funciona y cómo usarlo ### Cómo funciona El indicador "AtBot" para la plataforma MT5 genera señales de compra y venta utilizando una combinación de herramientas de análisis técnico. Integra la Media Móvil Simple (SMA), la Media Móvil Exponencial (EMA) y el índice de Rango Verdadero Promedio (ATR) para identificar oportunidades de trading. Además, puede utilizar velas Heikin Ashi para mejorar la precisión de las señales. Deja una reseña después de la compra y recibe un regalo especia
Este es posiblemente el indicador de reconocimiento automático de formación de precios más completo que puede encontrar para la plataforma MetaTrader. Detecta 19 patrones diferentes, toma las proyecciones de Fibonacci tan en serio como usted, muestra la zona de reversión potencial (PRZ) y encuentra niveles adecuados de stop-loss y take-profit. [ Guía de instalación | Guía de actualización | Solución de problemas | FAQ | Todos los productos ] Detecta 19 formaciones de precios armónicos difer
Introduciendo       Quantum Breakout PRO   , el innovador indicador MQL5 que está transformando la forma en que comercia con Breakout Zones. Desarrollado por un equipo de comerciantes experimentados con experiencia comercial de más de 13 años,       Desglose cuántico PRO       está diseñado para impulsar su viaje comercial a nuevas alturas con su innovadora y dinámica estrategia de zona de ruptura. El indicador de ruptura cuántica le dará flechas de señal en las zonas de ruptura con 5 zonas
AW Trend Predictor MT5
AW Trading Software Limited
4.78 (58)
La combinación de niveles de tendencia y ruptura en un sistema. Un algoritmo de indicador avanzado filtra el ruido del mercado, determina la tendencia, los puntos de entrada y los posibles niveles de salida. Las señales indicadoras se registran en un módulo estadístico, que le permite seleccionar las herramientas más adecuadas, mostrando la efectividad del historial de señales. El indicador calcula las marcas Take Profit y Stop Loss. Manual e instrucciones ->   AQUÍ   / Versión MT4 ->   AQUÍ Có
Gartley Hunter Multi
Siarhei Vashchylka
5 (8)
Gartley Hunter Multi - An indicator for searching for harmonic patterns simultaneously on dozens of trading instruments and on all possible timeframes. Manual (Be sure to read before purchasing) | Version for MT4 Advantages 1. Patterns: Gartley, Butterfly, Shark, Crab. Bat, Alternate Bat, Deep Crab, Cypher 2. Simultaneous search for patterns on dozens of trading instruments and on all possible timeframes 3. Search for patterns of all possible sizes. From the smallest to the largest 4. A
FX Power MT5 NG
Daniel Stein
5 (6)
Obtenga su actualización diaria del mercado con detalles y capturas de pantalla a través de nuestro Morning Briefing aquí en mql5 y en Telegram ! FX Power MT5 NG es la nueva generación de nuestro popular medidor de fuerza de divisas, FX Power. ¿Y qué ofrece este medidor de fuerza de nueva generación? Todo lo que le encantaba del FX Power original PLUS Análisis de fuerza de ORO/XAU Resultados de cálculo aún más precisos Períodos de análisis configurables individualmente Límite de cálculo persona
Trend Forecaster
Alexey Minkov
5 (6)
The Trend Forecaster indicator utilizes a unique proprietary algorithm to determine entry points for a breakout trading strategy. The indicator identifies price clusters, analyzes price movement near levels, and provides a signal when the price breaks through a level. The Trend Forecaster indicator is suitable for all financial assets, including currencies (Forex), metals, stocks, indices, and cryptocurrencies. You can also adjust the indicator to work on any time frames, although it is recommen
IX Power MT5
Daniel Stein
4.17 (6)
IX Power   lleva por fin la insuperable precisión de FX Power a los símbolos que no son de Forex. Determina con exactitud la intensidad de las tendencias a corto, medio y largo plazo de tus índices, acciones, materias primas, ETF e incluso criptodivisas favoritas. Puede   analizar todo lo   que su terminal le ofrece. Pruébalo y experimenta cómo   tu timing mejora significativamente   a la hora de operar. Características principales de IX Power Resultados de cálculo 100% precisos y sin rep
Auto Order Block with break of structure based on ICT and Smart Money Concepts (SMC) Futures Break of Structure ( BoS )             Order block ( OB )            Higher time frame Order block / Point of Interest ( POI )    shown on current chart           Fair value Gap ( FVG ) / Imbalance   -  MTF      ( Multi Time Frame )    HH/LL/HL/LH  -  MTF      ( Multi Time Frame )  Choch  MTF      ( Multi Time Frame )  Volume Imbalance     ,  MTF          vIMB Gap’s Power of 3 Equal High
FX Volume MT5
Daniel Stein
4.94 (17)
Obtenga su actualización diaria del mercado con detalles y capturas de pantalla a través de nuestro Morning Briefing aquí en mql5 y en Telegram ! FX Volume es el PRIMER y ÚNICO indicador de volumen que proporciona una visión REAL del sentimiento del mercado desde el punto de vista de un bróker. Proporciona una visión impresionante de cómo los participantes institucionales del mercado, como los brokers, están posicionados en el mercado Forex, mucho más rápido que los informes COT. Ver esta info
Legacy of Gann for MT5
Pavel Zamoshnikov
5 (6)
The indicator very accurately determines the levels of the possible end of the trend and profit fixing. The method of determining levels is based on the ideas of W.D.Gann, using an algorithm developed by his follower Kirill Borovsky. Extremely high reliability of reaching levels (according to K. Borovsky  - 80-90%) Indispensable for any trading strategy – every trader needs to determine the exit point from the market! Precisely determines targets on any timeframes and any instruments (forex, met
ICT, SMC, SMART MONEY CONCEPTS, SMART MONEY, Smart Money Concept, Support and Resistance, Trend Analysis, Price Action, Market Structure, Order Blocks, BOS/CHoCH,   Breaker Blocks ,  Momentum Shift,   Supply&Demand Zone/Order Blocks , Strong Imbalance,   HH/LL/HL/LH,    Fair Value Gap, FVG,  Premium  &   Discount   Zones, Fibonacci Retracement, OTE, Buy Side Liquidity, Sell Side Liquidity, BSL/SSL Taken, Equal Highs & Lows, MTF Dashboard, Multiple Time Frame, BigBar, HTF OB, HTF Market Structure
Advanced Supply Demand MT5
Bernhard Schweigert
4.53 (15)
¡Actualmente con 33% de descuento! ¡La mejor solución para cualquier tráder principiante o experto! Este indicador es una herramienta comercial única, de alta calidad y asequible, porque incorpora una serie de características patentadas y una nueva fórmula. Con esta actualización, podrá mostrar zonas de doble marco temporal. No solo podrá mostrar un marco temporal más alto, sino también mostrar ambos, el marco temporal del gráfico MÁS el marco temporal más alto: MOSTRANDO ZONAS ANIDADAS. A todos
Gold TMAF MTF - es el mejor indicador técnico bursátil. El algoritmo del indicador analiza el movimiento del precio de un activo y refleja la volatilidad y las posibles zonas de entrada. Las mejores señales del indicador: - Para VENTA = límite superior rojo de TMA2 por encima del límite superior rojo de TMA1 + indicador fractal rojo por encima + flecha amarilla de señal SR en la misma dirección. - Para COMPRA = límite inferior azul de TMA2 por debajo del límite inferior azul de TMA1 + i
Trend Line Map Pro MT5
STE S.S.COMPANY
4.36 (11)
El indicador Trend Line Map es un complemento para Trend Screener Indicator. Funciona como un escáner para todas las señales generadas por el evaluador de tendencias (Trend Line Signals). Es un escáner de líneas de tendencia basado en el indicador de evaluación de tendencias. Si no tiene el indicador Trend Screener Pro, Trend Line Map Pro no funcionará. It's a Trend Line Scanner based on Trend Screener Indicator. If you don't have Trend Screener Pro Indicator,     the Trend Line Map Pro will
MTF Supply Demand Zones MT5
Georgios Kalomoiropoulos
5 (1)
Próxima generación de zonas de oferta y demanda automatizadas. Algoritmo nuevo e innovador que funciona en cualquier gráfico. Todas las zonas se crean dinámicamente de acuerdo con la acción del precio del mercado. DOS TIPOS DE ALERTAS --> 1)CUANDO EL PRECIO LLEGA A UNA ZONA 2)CUANDO SE FORMA UNA NUEVA ZONA No obtienes un indicador inútil más. Obtiene una estrategia comercial completa con resultados probados.     Nuevas características:     Alertas cuando el precio llega a la z
The iChannels
BeeXXI Corporation
5 (1)
Ultra-fast recognition of parabolic channels (as well as linear, horizontal and wavy channels) throughout the depth of history, creating a hierarchy of channels. Required setting: Max bars in chart: Unlimited This indicator is designed primarily for algorithmic trading, but can also be used for manual trading.  This indicator will have a very active evolution in the near future and detailed descriptions on how to apply to create robots
Was: $249  Now: $99   Market Profile defines a number of day types that can help the trader to determine market behaviour. A key feature is the Value Area, representing the range of price action where 70% of trading took place. Understanding the Value Area can give traders valuable insight into market direction and establish the higher odds trade. It is an excellent addition to any system you may be using. Inspired by Jim Dalton’s book “Mind Over Markets”, this indicator is designed to suit the
Heatmap Volume Profile
Olexandr Savchuk
4.25 (4)
A Heatmap with a Volume Profile is like a thermal imager or x-ray machine. It will help you to estimate the relative distribution of volume during the price movement and to understand  the relationship between volume and price. Indicator Volume Profile "Volumos Maxima" is a powerful tool for analyzing this relationship. After simple experimentation with heatmap, you can find that each trading instrument has its own “ characteristic ” way of distributing volume. And this will help you to make a b
Otros productos de este autor
The moving average is the easiest indicator to recognize changes in the price of a currency. It is excellent to set multiple indicators for each period or type and see the transition. However, setting multiple moving averages is very troublesome, isn't it? Moreover, displaying multiple currency pairs will increase the time and effort. It is an indicator that saves you the trouble. You can display multiple moving averages at once. You can freely set up to 4 lines, line thickness,
Filtro:
Mary Gomes
277
Mary Gomes 2022.06.05 06:36 
 

Very useful tool to me.

Respuesta al comentario