• Información general
  • Comentarios (1)
  • Discusión

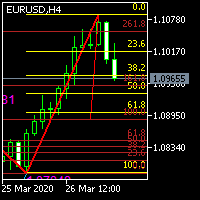
Historical Memory ZigZag

4

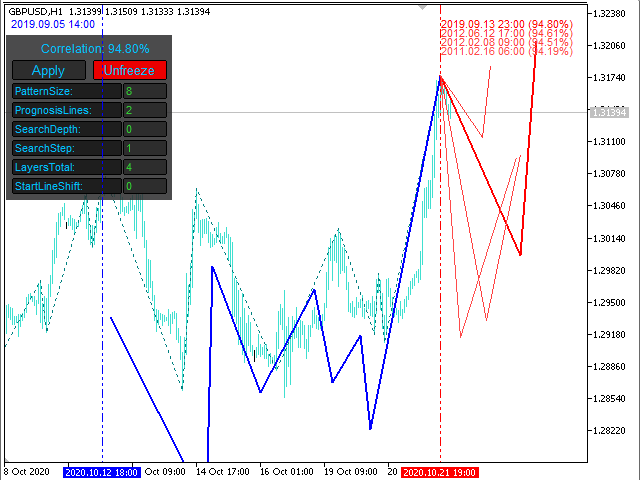
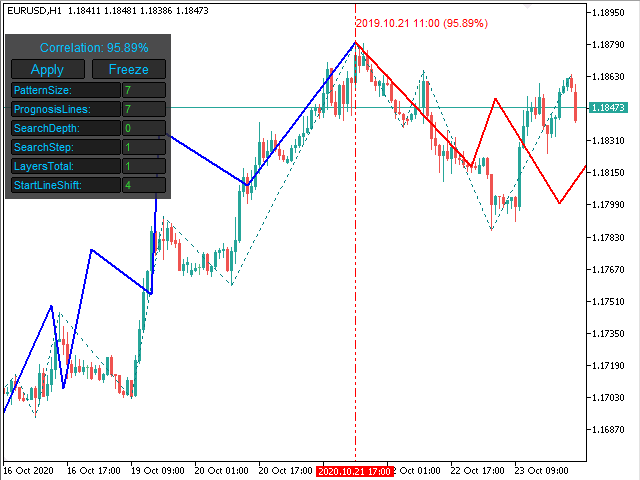
Do you want to see the future lines of the ZigZag indicator?

This indicator will help you do that because the indicator model is based on two indicators: Historical Memory and ZigZag. So it can forecast the ZigZag lines. Very useful as an assistant, acts as a key point to forecast the future price movement.

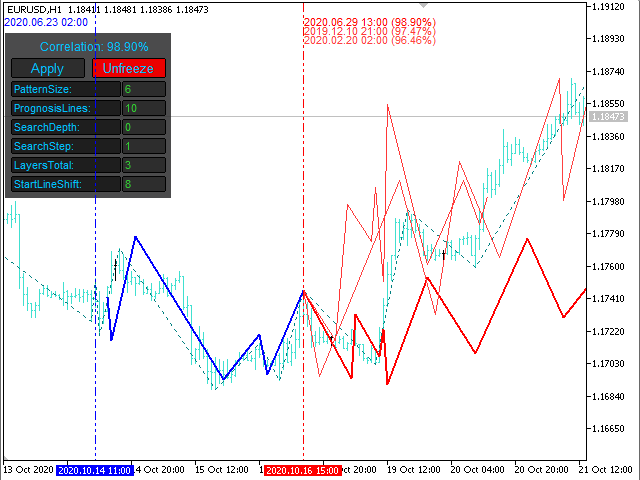
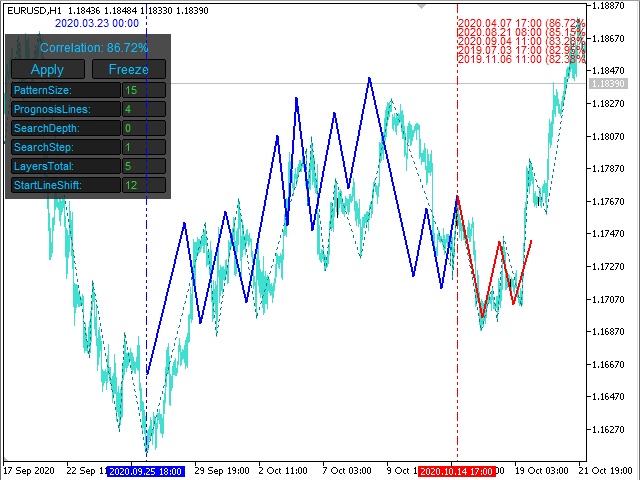
The forecast is made using the method of searching the most similar part in the history (pattern) to the current one. The indicator is drawn as a line that shows the result of change of the ZigZag lines. Moreover, you can visually find and compare the quality of a history pattern with an actual pattern. In addition to all the above, the indicator is able to make a forecast taking into account not a single found pattern, but multiple (in the indicator it is called layers).

Also the GUI will simplify the work with this useful tool.


Input parameters

The ZigZag indicator
  • Depth - number of bars on which the ZigZag node will not be built if the Deviation condition was not met.
  • Deviation - deviation (the difference between extremums of bars that is considered sufficient for building a new node).
  • Back Step - the minimum number of bars between the maximums (minimums).

Forecast

  • Prediction Freeze - allows to freeze displayed forecast.
  • Layers Show Mode - layer display mode: 'ALL' - all layers will be shown as separate lines; 'AVERAGE' - a multi-layer view as a smoothed line.
  • Show All Backward Lines - backward lines of all layers will be displayed.
  • Pattern: Size(in ZZ nodes)[1...] - the size of the pattern in ZZ nodes.
  • Prediction: the number of ZZ nodes[1...] - the number of ZZ nodes used for the forecast.
  • Searching: depth of history(in ZZ nodes)(0 - all ZZ nodes) - the depth of the history used to search for the best correlation.
  • Searching: Step(in ZZ nodes) - search step: the higher step value provides a higher speed with a lower search quality.
  • Prediction: Layers total [1...10] - the number of layers (no more than 10) : the more layers, the greater the variability of the forecast.
  • Searching: From ZZ node (in history) - the forecast begins from this node of the ZZ.

    Graphics

    • Objects Name Prefix - prefix name of the graphic objects. 


    Comentarios 1
    autovolk
    847
    autovolk 2020.12.04 11:34 
     

    В целом полезный и хороший индикатор.

    Productos recomendados
    El indicador muestra patrones armónicos en el gráfico basado en Dynamic ZigZag (   https://www.mql5.com/en/market/product/5356   ) y es casi un análogo completo de una de las versiones de los conocidos korHarmonics. El indicador reconoce los siguientes patrones y sus variedades: ABCD, Gartley (Butterfly, Crab, Bat), 3Drives, 5-0, Batman, SHS, One2One, Camel, Triangles, WXY, Fibo y Vibrations. Solo la visualización de patrones ABCD y Gartley está habilitada en la configuración de forma predetermi
    Title: Advanced Trend Lines   Supports and Resistances Levels Overview: Enhance your trading decisions with this powerful Trend Lines Supports and Resistances Levels Indicator . This tool identifies key market structures such as trend lines, pivot points, and support/resistance zones, providing traders with actionable insights to spot potential breakout or reversal opportunities. Tailored for technical analysts, this indicator offers customizability and real-time alerts to match any trading st
    This indicator calculates and displays Murrey Math Lines on the chart. This MT5 version is similar to the МТ4 version: It allows you to plot up to 4 octaves, inclusive, using data from different time frames, which enables you to assess the correlation between trends and investment horizons of different lengths. In contrast to the МТ4 version, this one automatically selects an algorithm to search for the base for range calculation. You can get the values of the levels by using the iCustom() funct
    Dinasty Trader Bot é o robô de negociação de trades no iBovespa que utiliza uma estratégia única e dominante, baseado em média móvel e também em definição de suportes e resistências por meio de Canal Keltner, que pode ser configurado em máximo/mínimo ou por indicador ATR. Os trades podem ser configurados para serem conforme tendência ou em reversões/repiques de movimentos, resultando em flexibilidade na definição de estratégia de conta. O sistema ainda considera um sistema de trail de média móve
    Support and Resistance X3 calculate and show Support and Resistance in 3 different modes and 2 different Styles. Modes: ICT High / Low Mode Fractal Mode ZigZag mode Styles: Dot Line Options: Button to choose between  3 Modes Button to choose between 2  Styles Alert when Support and Resistance touched Alert when Support and Resistance break Button to hide / show Menu Button take and save screenshot of current chart
    Pare de seguir as "sardinhas" e comece a operar como big player, de forma automática. O robô Imbalance Autotrader é a mais recente tecnologia de trade que monitora os big players (grandes investidores) do mercado financeiro. Com estratégia de rompimento ( breakout ) ou pullback (Fair Value Gap FVG e Order Block) , você consegue configurar o robô para o ativo, conforme condições que você deseja operar. Além disso, o robô pode ter stops configuráveis, dinâmicos ou fixos. Na questão de gerenciamen
    Gecko EA MT5
    Profalgo Limited
    5 (1)
    NEW PROMO: Only a few copies copies available at 349$ Next price: 449$ Make sure to check out our " Ultimate EA combo package " in our   promo blog ! Gecko runs a simple, yet very effective, proven strategy.  It looks for important recent support and resistance levels and will trade the breakouts.  This is a "real" trading system, which means it will use a SL to protect the account.  It also means it will not use any dangerous techniques like martingale, grid or averaging down. The EA shows its
    Two-way Fibonacci indicator. The function is to facilitate traders to find their retracement and entry and exit points. The principle of the workpiece of this indicator: First, draw a V shape for the high and low points formed by the fractal indicator, and then draw a golden section proportional line for the V line, which can be applied to any period and currency pair.
    Elliott Wave Trend was designed for the scientific wave counting. This tool focuses to get rid of the vagueness of the classic Elliott Wave Counting using the guideline from the template and pattern approach. In doing so, firstly Elliott Wave Trend offers the template for your wave counting. Secondly, it offers Wave Structural Score to assist to identify accurate wave formation. It offers both impulse wave Structural Score and corrective wave Structure Score. Structural Score is the rating to sh
    MultSet
    Amani Fungo
    5 (1)
    Multset  This is inte_plays indicator, which helps the trader to enter the trades appropriately it plots an arrow when there is appropriate environment which permits trading Features 1. Sends push notification on mobile devices  2. Plots arrow on chart when the setting is found TimeFrame Is suggested to be used on higher time frames only, especially starting 15min and above for proper moves For more informations please  Visit:  https://t.me/Tz_Fx_Lab Subscribe to our Youtube channel:  htt
    FREE
    Esta herramienta de software está diseñada para agilizar el proceso de creación de líneas de tendencia horizontales y rectángulos en cinco colores personalizables a su elección. Dibujar líneas de tendencia horizontales precisas en MT5 puede ser un desafío, pero con este indicador, puede crearlas sin esfuerzo en los colores que se adapten a sus preferencias. Además, nuestra herramienta proporciona una visualización clara de los niveles de precios asociados con las líneas horizontales que dib
    Introducing Neural Bitcoin Impulse - an innovative trading bot created using neural network training technology on voluminous market data sets. The built-in mathematical model of artificial intelligence searches for the potential impulse of each next market bar and uses the resulting patterns of divergence and convergence between the predictive indicators and the price to form high-precision reversal points for opening trading positions. The trading robot is based on the Neural Bar Impulse in
    Easy Fibonacci
    Rajesh Kumar Nait
    Easy Fibonacci es un indicador para MT5 que te permite trazar fácilmente retrocesos de Fibonacci. Características Se pueden establecer hasta 10 niveles de Fibonacci desde la configuración del indicador. Cada nivel puede tener diferente estilo de línea, color de línea, ancho de línea y otros ajustes personalizables. Puedes usar un ratón con botones adicionales para asignar las teclas V y B y trazar Fibonacci cómodamente. Acciones de los botones: B y V: Trazar Fibonacci superior/inferior en el áre
    ICT Kill zone and Macros Indicator mark and display the following zone times on the chart: Kill zones   Kill zone Forex Asian London Open New York Open London Close Central Bank Dealing range Kill zone Indices Asian London Open New York AM New York Lunch New York PM Power Hour Macros London 1 London 2 New York Am 1 New York AM 2 New York Lunch New York PM 1 New York PM 2 Silver bullet London Open New York AM New York PM Sessions Asian London New York Chart The display of  Kill zone ,
    Auto Fib Retracements
    Ross Adam Langlands Nelson
    4.2 (5)
    Automatic Fibonacci Retracement Line Indicator. This indicator takes the current trend and if possible draws Fibonacci retracement lines from the swing until the current price. The Fibonacci levels used are: 0%, 23.6%, 38.2%, 50%, 61.8%, 76.4%, 100%. This indicator works for all charts over all timeframes. The Fibonacci levels are also recorded in buffers for use by other trading bots. Any comments, concerns or additional feature requirements are welcome and will be addressed promptly. 
    FREE
    Darwin Swing MT5
    Guillaume Duportal
    4.87 (45)
    Darwin SWING Precio de lanzamiento 999 USD , precio futuro 1490 USD DESCRIPCIONES : -- Para entender cómo funciona, venga a leer el blog (Este EA refleja mi filosofía de comercio de divisas ... Si te gusta la forma en que veo las cosas, entonces te gustará mi EA. Tómate el tiempo para hacerlo. (Forex no es una carrera): https://www.mql5.com/en/blogs/post/745790 -- Para ver los resultados anteriores aquí están los enlaces a las señales Señales en vivo y de demostración: https://ww
    El patrón 123 es uno de los patrones de gráficos más populares, potentes y flexibles. El patrón se compone de tres puntos de precio: un fondo, un pico o valle, y un retroceso de Fibonacci entre 38.2% y 71.8%. Un patrón se considera válido cuando el precio se rompe más allá del último pico o valle, momento en el que el indicador traza una flecha, levanta una alerta y se puede colocar el comercio. [ Guía de instalación | Guía de actualización | Solución de problemas | FAQ | Todos los productos ]
    Un asesor de redes profesional trabaja con indicadores RSI (índice de fuerza relativa). tiene la función de reducir la reducción de la cuenta superponiendo pedidos no rentables. El gráfico muestra información sobre las ganancias. Versión MT4 https://www.mql5.com/en/market/product/56994 OPCIONES: RSI_PERIOD - período para calcular el índice de fuerza relativa; UP_LEVEL - límite superior; DN_LEVEL - límite inferior; RSI_TIMEFRAME - período de tiempo para el cálculo; START_LOT - lote ini
    Trends Analyzer
    Damian Pacanowski
    The " Trends Analyzer " is an advanced MQL5 script tailored for both manual and automated trading strategies.  It provides comprehensive market trend analysis, real-time insights, and the capability to execute algorithmic trades based on predefined rules.  Designed for traders and analysts, it serves as a versatile tool for monitoring, logging, and acting on market trends. Key Features: Data Logging: Collects and logs key market metrics (Open, High, Low, Close prices, Volume) in a CSV file f
    Este indicador le permite mostrar etiquetas de niveles de Fibonacci con un tamaño de fuente grande . Admite hasta 25 niveles de Fibonacci. - Tan pronto como dibujas Fibonacci, muestra los niveles que agregaste como parámetro de entrada con un tamaño de fuente grande con el color y la fuente que elijas. Opciones personalizables: 1. Fuente de texto Fibo 2. Tamaño del texto Fibonacci 3. Color del texto Fibonacci 3. Agrega una descripción a cada nivel. 4. Otras opciones como
    Fit line supports to extrapolation next movement of market, support for buy/sell decision. Indicator using spline algorithm to extrapolation.  You can change number of spline with parameter "PointsNumber" and number of extrapolation point with "ExtrapolateBars". Eextrapolation points will be save into csv format, with prefix in parameter "PointsPrefix", and store in folder File of Data Folder.
    FibTracer
    Syed Oarasul Islam
    FibTracer is an interactive Fibonacci tool that is aim to improve and facilitate your Fibonacci trading style. This Indicator can generate Fibonacci Retracement levels in two different ways. You can select whether to draw Fibonacci Retracement levels based on you favourite ZigZag settings or you can let the indicator to draw Fibonacci Retracement level based on given number of periods.  You can also set Mobile and Email notification for your favourite Retracement levels individually. With this i
    I want to present to you my solution in the implementation of automatic drawing of Fibo levels on the whole trend and the last trend leg. The logic of the indicator is based on the principle of swings, and when indicator gets a signal for a trend direction change, the previous key point before reversing is considered the start point of the indicator's drawing. When you test the indicator, note that changing the direction of the whole trend leg of Fibonacci often leads to a reversal of the trend.
    Fibonacci Auto
    Makarii Gubaydullin
    Automatically plots Fibo levels, based on the High & Low prices from the specified time frame Multiple bars   may be united: e.g. you can get a Fibo based on the 10-days Highs and Lows My   #1   Utility : 65+ features, including this indicator  |   Contact me  for any questions  |    MT4 version Helps to see potential reversal levels; Patterns formed at the Fibo levels tend to be stronger; Significantly   reduces   the   time   spent   on   manual  plotting ; Settings: Timeframe to calculate the
    Market book saver
    Aliaksandr Hryshyn
    Saving data from the order book. Data replay utility: https://www.mql5.com/en/market/product/71640 Library for use in the strategy tester: https://www.mql5.com/en/market/product/81409 Perhaps, then a library will appear for using the saved data in the strategy tester, depending on the interest in this development. Now there are developments of this kind using shared memory, when only one copy of the data is in RAM. This not only solves the memory issue, but gives faster initialization on each
    The Expert Advisor and the video are attached in the Discussion tab . The robot applies only one order and strictly follows the signals to evaluate the indicator efficiency. Pan PrizMA CD Phase is an option based on the Pan PrizMA indicator. Details (in Russian). Averaging by a quadric-quartic polynomial increases the smoothness of lines, adds momentum and rhythm. Extrapolation by the sinusoid function near a constant allows adjusting the delay or lead of signals. The value of the phase - wave s
    Platinum Wolf
    Jean Christophe Paput
    Platinum Wolf  The Platinum Wolf trading robot is designed to deliver both high performance and stability, with a primary focus on trading the EURUSD pair. Its annual goal is to multiply per 3 (X3) starting capital  by taking optimized positions that capture the most probable market movements. Strategy Overview Platinum Wolf' s strategy relies on continuous equity monitoring to maintain a balanced state. It uses moving average (MA) to determine precise entry and exit points. The robot also
    Market Fractal Analysis, Fractal Swing, Market Flow Fractal Cycles looks for Similar Patterns in the Market that repeat themselves because of the Market Fractal Nature. These patterns are displayed with help of Graphical Objects and Alerts can be received on their arrival. Read the   Blog   for full information. Features:- Auto Detection of Patterns Customization for Color and Line Styles Alerts, Emails & Push Notifications
    Watermark Centralized
    Ronnie Ferreira Silva
    1 (1)
    Marca de agua centralizada Agrega una marca de agua centrada con el nombre del activo y el período elegido. Es posible anular el tipo de fuente, el tamaño de fuente, el color de fuente y el carácter separador. La marca de agua se coloca detrás de las velas, sin perturbar la visualización. Tiene centrado automático si se cambia el tamaño de la ventana. Espero que este indicador te ayude, buen trading ;)
    FREE
    Crypto Ticks and Depth
    Rajesh Kumar Nait
    5 (1)
    Profundidad de oferta y demanda y reserva de datos de ticks en vivo de criptomonedas para EA Intercambio disponible: 1. Binance Spot (admite la profundidad del libro de pedidos en la ventana del gráfico activo) y futuros (admite múltiples profundidades del libro de pedidos) 2. Kucoin Spot y Futures, admite la profundidad del libro de pedidos en la ventana del gráfico activo 3. Los futuros Bybit y los futuros inversos marcan la oferta y la solicitud de datos en último lugar Próximo
    Los compradores de este producto también adquieren
    Trend Screener Pro MT5
    STE S.S.COMPANY
    4.88 (68)
    Desbloquee el poder del comercio de tendencias con el indicador Trend Screener: ¡su solución definitiva para el comercio de tendencias impulsada por lógica difusa y un sistema multidivisa!Mejore su comercio de tendencias con Trend Screener, el revolucionario indicador de tendencias impulsado por lógica difusa. Es un poderoso indicador de seguimiento de tendencias que combina más de 13 herramientas y funciones premium y 3 estrategias comerciales, lo que lo convierte en una opción versátil para co
    TPSproTREND PrO MT5
    Roman Podpora
    4.54 (13)
    TPSpro TREND PRO  - is a trend indicator that automatically analyzes the market and provides information about the trend and each of its changes, as well as giving signals for entering trades without redrawing! The indicator uses each candle, analyzing them separately. referring to different impulses - up or down impulse. Exact entry points into transactions for currencies, crypto, metals, stocks, indices!  INSTRUCTIONS     RUS   -    ENG              R ecommended to use with an indicator   - 
    Ahora $ 147 (aumentando a $ 499 después de algunas actualizaciones) - Cuentas ilimitadas (PC o Mac) Manual de usuario de RelicusRoad + Videos de capacitación + Acceso al grupo privado de Discord + Estado VIP UNA NUEVA MANERA DE VER EL MERCADO RelicusRoad es el indicador comercial más poderoso del mundo para divisas, futuros, criptomonedas, acciones e índices, y brinda a los comerciantes toda la información y las herramientas que necesitan para mantenerse rentables. Brindamos análisis téc
    TPSpro RFI Levels MT5
    Roman Podpora
    4.67 (15)
    INSTRUCCIONES       RUSO   -   ING        Se   recomienda utilizar con un indicador.       -       TPSpro   TENDENCIA PRO -   Versión MT5 Un elemento clave en el trading son las zonas o niveles desde los que se toman las decisiones de compra o venta de un instrumento de trading. A pesar de los intentos de los principales actores de ocultar su presencia en el mercado, inevitablemente dejan rastros. Nuestra tarea era aprender a identificar estos rastros e interpretarlos correctamente. Funciones p
    CBT Quantum Maverick Sistema de Comercio de Opciones Binarias de Alta Eficiencia CBT Quantum Maverick es un sistema de opciones binarias de alto rendimiento diseñado para traders que buscan precisión, simplicidad y un enfoque disciplinado. No requiere personalización: el sistema está optimizado para resultados efectivos desde el primer momento. Simplemente sigue las señales, que se pueden dominar con un poco de práctica. Características clave: Precisión de señales: Señales basadas en la próx
    Golden Trend Indicator MT5
    Noha Mohamed Fathy Younes Badr
    4.78 (9)
    Golden Trend indicator  is The best indicator for predicting trend movement this indicator never lags and never repaints and never back paints    and give  arrow buy and sell    before the candle appear  and it will help you and  will make your trading decisions clearer its work on all currencies and  gold and crypto and all time frame This unique  indicator uses very secret algorithms to catch the  trends, so you can trade using this indicator and see the trend clear on charts  manual guide and
    Quantum TrendPulse
    Bogdan Ion Puscasu
    5 (4)
    Presentamos   Quantum TrendPulse   , la herramienta de trading definitiva que combina el poder de   SuperTrend   ,   RSI   y   Stochastic   en un indicador integral para maximizar su potencial de trading. Diseñado para traders que buscan precisión y eficiencia, este indicador le ayuda a identificar tendencias del mercado, cambios de impulso y puntos de entrada y salida óptimos con confianza. Características principales: Integración con SuperTrend:   siga fácilmente la tendencia predominante del
    FX Power MT5 NG
    Daniel Stein
    5 (7)
    Desbloquea toda la potencia de FX Power NG: el medidor definitivo de la fuerza de las divisas Durante más de ocho años, FX Power ha proporcionado a los operadores de todo el mundo un análisis fiable y preciso de la fortaleza de las divisas. Ahora, FX Power NG lleva esta herramienta de confianza al siguiente nivel, ofreciendo funciones avanzadas que aportan una precisión, personalización y perspectivas sin igual a sus operaciones. ¿Qué hace que FX Power NG sea imprescindible para los operador
    Ante todo, vale la pena enfatizar que esta Herramienta de Trading es un Indicador No Repintado, No Redibujado y No Retrasado, lo que la hace ideal para el trading profesional. Curso en línea, manual del usuario y demostración. El Indicador de Conceptos de Acción del Precio Inteligente es una herramienta muy potente tanto para traders nuevos como experimentados. Combina más de 20 indicadores útiles en uno solo, combinando ideas avanzadas de trading como el Análisis del Trader del Círculo Inte
    FX Volume MT5
    Daniel Stein
    4.93 (14)
    Obtenga una verdadera ventaja en Forex con FX Volume: El Indicador de Volumen Definitivo FX Volume es el primer y único indicador de volumen que revela el sentimiento genuino del mercado desde una perspectiva interna. Al proporcionar una visión única de cómo los participantes institucionales del mercado y los corredores están posicionados, FX Volume le permite operar con la previsión normalmente reservada para los grandes jugadores. Diga adiós a los retrasos de los informes COT: FX Volu
    Este tablero muestra los últimos   patrones armónicos   disponibles para los símbolos seleccionados, por lo que ahorrará tiempo y será más eficiente /   versión MT4 . Indicador gratuito:   Basic Harmonic Pattern Columnas del indicador Symbol:   aparecerán los símbolos seleccionados Trend :   alcista o bajista Pattern :   tipo de patrón (gartley, mariposa, murciélago, cangrejo, tiburón, cifrado o ABCD) Entry :   precio de entrada SL:   precio de stop loss TP1:   1er precio de toma de benefici
    Primero que todo, vale la pena enfatizar que este Sistema de Trading es un Indicador No Repintado, No Redibujado y No Retrasado, lo que lo hace ideal tanto para el trading manual como para el automatizado. Curso en línea, manual y descarga de ajustes preestablecidos. El "Sistema de Trading Inteligente MT5" es una solución completa de trading diseñada para traders nuevos y experimentados. Combina más de 10 indicadores premium y presenta más de 7 estrategias de trading robustas, lo que lo convie
    Matrix Arrow Indicator MT5
    Juvenille Emperor Limited
    5 (13)
    Matrix Arrow Indicator MT5   es una tendencia única 10 en 1 que sigue un indicador   100% sin repintado   de marcos temporales múltiples que se puede usar en todos los símbolos/instrumentos:   divisas ,   materias primas ,   criptomonedas ,   índices ,   acciones .  Matrix Arrow Indicator MT5  determinará la tendencia actual en sus primeras etapas, recopilando información y datos de hasta 10 indicadores estándar, que son: Índice de movimiento direccional promedio (ADX) Índice de canales de prod
    FX Dynamic - El Único Indicador ATR que Necesitarás ¿Listo para potenciar sus estrategias de trading con una precisión y conocimiento sin precedentes? Conozca FX Dynamic , el primer y único indicador ATR diseñado para el análisis basado en divisas y el ajuste automático de los cambios GMT de los brokers . Diga adiós a las herramientas anticuadas y adopte la solución definitiva para dominar la volatilidad del mercado. Por quà FX Dynamic cambia las reglas del juego Análisis ATR basa
    MetaForecast M5
    Vahidreza Heidar Gholami
    5 (2)
    MetaForecast predice y visualiza el futuro de cualquier mercado basándose en las armonías de los datos de precios. Aunque el mercado no siempre es predecible, si existe un patrón en el precio, MetaForecast puede predecir el futuro con la mayor precisión posible. En comparación con otros productos similares, MetaForecast puede generar resultados más precisos al analizar las tendencias del mercado. Parámetros de entrada Past size (Tamaño del pasado) Especifica el número de barras que MetaForecas
    TPA True Price Action indicator reveals the true price action of the market makers through 100% non-repainting signals strictly at the close of a candle! TPA shows entries and re-entries, every time the bulls are definitely stronger than the bears and vice versa. Not to confuse with red/green candles. The shift of power gets confirmed at the earliest stage and is ONE exit strategy of several. There are available now two free parts of the TPA User Guide for our customers. The first "The Basics"
    Atomic Analyst MT5
    Issam Kassas
    4.32 (19)
    En primer lugar, vale la pena enfatizar que este Indicador de Trading no repinta, no redibuja y no se retrasa, lo que lo hace ideal tanto para el trading manual como para el automatizado. Manual del usuario: configuraciones, entradas y estrategia. El Analista Atómico es un Indicador de Acción del Precio PA que utiliza la fuerza y el impulso del precio para encontrar una mejor ventaja en el mercado. Equipado con filtros avanzados que ayudan a eliminar ruidos y señales falsas, y aumentan el poten
    Introduciendo       Quantum Breakout PRO   , el innovador indicador MQL5 que está transformando la forma en que comercia con Breakout Zones. Desarrollado por un equipo de comerciantes experimentados con experiencia comercial de más de 13 años,       Desglose cuántico PRO       está diseñado para impulsar su viaje comercial a nuevas alturas con su innovadora y dinámica estrategia de zona de ruptura. El indicador de ruptura cuántica le dará flechas de señal en las zonas de ruptura con 5 zonas
    Descubra FX Levels: Su Indicador Definitivo de Soporte y Resistencia para Operar con Éxito FX Levels es más que un simple indicador de soportes y resistencias; es un cambiador de juego para los traders serios que buscan precisión, fiabilidad y funcionalidad sin fisuras en todos los sÃmbolos de trading, ya sean pares de divisas, Ãndices, acciones o materias primas. Basado en el probado método Lighthouse y mejorado con adaptabilidad dinámica en tiempo real, FX Levels lleva los puntos de invers
    IX Power MT5
    Daniel Stein
    4.17 (6)
    Presentamos IX Power, la herramienta definitiva para aumentar la precisión de sus operaciones. Diseñado con la misma precisión insuperable que FX Power, IX Power te permite dominar cualquier símbolo de trading, desde índices y acciones hasta materias primas, ETFs e incluso criptodivisas. Prepárate para elevar tu trading con una visión precisa de las tendencias a corto, medio y largo plazo en todos tus activos favoritos. ¿Por qué elegir IX Power? Con IX Power, tu tiempo se vuelve muy preciso,
    Easy Buy Sell is a market indicator for opening and closing positions. It becomes easy to track market entries with alerts. It indicates trend reversal points when a price reaches extreme values ​​and the most favorable time to enter the market. it is as effective as a Fibonacci to find a level but it uses different tools such as an algorithm based on ATR indicators and Stochastic Oscillator. You can modify these two parameters as you wish to adapt the settings to the desired period. It canno
    ATrend
    Zaha Feiz
    4.88 (8)
    ATREND: Cómo Funciona y Cómo Usarlo #### Cómo Funciona El indicador "ATREND" para la plataforma MT5 está diseñado para proporcionar a los traders señales de compra y venta robustas mediante una combinación de metodologías de análisis técnico. Este indicador utiliza principalmente el Rango Verdadero Promedio (ATR) para medir la volatilidad, junto con algoritmos de detección de tendencias para identificar posibles movimientos del mercado. Deja un mensaje después de la compra y recibe un regalo es
    Enjoy a   50% OFF   Christmas holiday sale!   Offer ends 27 December 2025 . After your purchase, feel free to contact me for more details on how to receive a bonus indicator called VFI, which pairs perfectly with Easy Breakout for enhanced confluence!     Easy Breakout MT5   is a powerful price action trading system built on one of the most popular and widely trusted strategies among traders: the   Breakout strategy ! This indicator delivers crystal-clear Buy and Sell signals based on bre
    Auto Order Block with break of structure based on ICT and Smart Money Concepts (SMC) Futures Break of Structure ( BoS )             Order block ( OB )            Higher time frame Order block / Point of Interest ( POI )    shown on current chart           Fair value Gap ( FVG ) / Imbalance   -  MTF      ( Multi Time Frame )    HH/LL/HL/LH  -  MTF      ( Multi Time Frame )  Choch  MTF      ( Multi Time Frame )  Volume Imbalance     ,  MTF          vIMB Gap’s Power of 3 Equal High
    Conviértase en un Breaker Trader y obtenga beneficios de los cambios en la estructura del mercado a medida que se invierte el precio. El indicador de ruptura de bloque de órdenes identifica cuándo una tendencia o movimiento de precio se acerca al agotamiento y está listo para revertirse. Le alerta sobre cambios en la estructura del mercado que generalmente ocurren cuando una reversión o un retroceso importante están a punto de suceder. El indicador utiliza un cálculo patentado que identific
    Este es un genial indicador para MT5 que ofrece señales precisas para entrar en una transacción sin redibujar. Se puede aplicar a cualquier activo financiero: fórex, criptomonedas, metales, acciones, índices. Nos dará valoraciones bastante precisas y nos dirá cuándo es mejor abrir y cerra una transacción. Eche un vistazo  al vídeo  (6:22), ¡contiene un ejemplo de procesamiento de una sola señal que ha amortizado el indicador! La mayoría de los tráders mejoran sus resultados comerciales durante l
    Support And Resistance Screener está en un indicador de nivel para MetaTrader que proporciona múltiples herramientas dentro de un indicador. Las herramientas disponibles son: 1. Cribador de estructura de mercado. 2. Zona de retroceso alcista. 3. Zona de retroceso bajista. 4. Puntos pivotes diarios 5. Puntos de pivote semanales 6. Puntos Pivotes mensuales 7. Fuerte soporte y resistencia basado en patrón armónico y volumen. 8. Zonas de nivel de banco. OFERTA POR TIEMPO LIMITADO: El indicador de so
    MetaBands M5
    Vahidreza Heidar Gholami
    4.5 (2)
    MetaBands utiliza algoritmos potentes y únicos para dibujar canales y detectar tendencias para que pueda proporcionar a los traders puntos potenciales para entrar y salir de operaciones. Es un indicador de canal junto con un potente indicador de tendencia. Incluye diferentes tipos de canales que se pueden fusionar para crear nuevos canales simplemente utilizando los parámetros de entrada. MetaBands utiliza todos los tipos de alertas para notificar a los usuarios sobre eventos del mercado. Caract
    Berma Bands
    Muhammad Elbermawi
    The Berma Bands (BBs) indicator is a valuable tool for traders seeking to identify and capitalize on market trends. By analyzing the relationship between the price and the BBs, traders can discern whether a market is in a trending or ranging phase. Berma Bands are composed of three distinct lines: the Upper Berma Band, the Middle Berma Band, and the Lower Berma Band. These lines are plotted around the price, creating a visual representation of the price movement relative to the overall trend.
    Contact me for instruction, any questions! Related Product:  Gold Trade Expert MT5 Introduction The breakout and retest strategy is traded support and resistance levels. it involves price breaking through a previous level.  The break and retest strategy is designed to help traders do two main things, the first is to avoid false breakouts. Many false breakouts start with a candlestick that breaks out of a level but ends with an immediate candlestick that brings the price back into the level. T
    Otros productos de este autor
    Every indicator has its advantages and disadvantages. Trending ones show good signals during a trend, but lag during a flat. Flat ones thrive in the flat, but die off as soon as a trend comes. All this would not be a problem, if it was easy to predict when a flat changes to a trend and when a trend changes to a flat, but in practice it is an extremely serious task. What if you develop such an algorithm, which could eliminate an indicator's flaws and enhance its strengths? What if such an algorit
    Every indicator has its advantages and disadvantages. Trending ones show good signals during a trend, but lag during a flat. Flat ones thrive in the flat, but die off as soon as a trend comes. All this would not be a problem, if it was easy to predict when a flat changes to a trend and when a trend changes to a flat, but in practice it is an extremely serious task. What if you develop such an algorithm, which could eliminate an indicator's flaws and enhance its strengths? What if such an algorit
    The B150 model is a fully revised version of the Historical Memory indicator with a significantly improved algorithm. It also features a graphical interface what makes working with this perfect tool quick and convenient. Indicator-forecaster. Very useful as an assistant, acts as a key point to forecast the future price movement. The forecast is made using the method of searching the most similar part in the history (patter). The indicator is drawn as a line that shows the result of change of the
    Historical Memory
    Marat Sultanov
    4 (2)
    Indicador-pronosticador. Es bastante cómodo como un ayudante, actúa como punto de referencia en cuanto al carácter futuro del movimiento del precio. El pronóstico se realiza usando el método de la búsqueda de una parte más similar (en adelante, patrón) en el historial. El indicador se dibuja en forma de una línea que muestra el resultado del cambio de los precios del cierre de las barras. En los ajustes del indicador se puede ajustar la profundidad del historial, número de barras que se someten
    FREE
    The B150 model is a fully revised version of the Historical Memory indicator with an improved search algorithm. It also features a graphical interface what makes working with this tool quick and convenient. Indicator-forecaster. Very useful as an assistant, acts as a key point to forecast the future price movement. The forecast is made using the method of searching the most similar part in the history (patter). The indicator is drawn as a line that shows the result of change of the close price o
    ACI Moving Average
    Marat Sultanov
    4 (2)
    Tired of adjusting the indicator settings losing precious time? Tired of the uncertainty regarding their efficiency? Afraid of the uncertainty in their profitability? Then the indicator ACI (automatically calibrateable indicator) is designed exactly for you. Launching it, you can easily solve these three issues just performing the simplest action: clicking a single Calibrate button. To achieve the highest efficiency, you should perform another additional action: move the power slider to the maxi
    FREE
    ACI Bollinger Bands
    Marat Sultanov
    4 (3)
    Tired of adjusting the indicator settings losing precious time? Tired of the uncertainty regarding their efficiency? Afraid of the uncertainty in their profitability? Then the indicator ACI (automatically calibrateable indicator) is designed exactly for you. Launching it, you can easily solve these three issues just performing the simplest action: clicking a single Calibrate button. To achieve the highest efficiency, you should perform another additional action: move the power slider to the maxi
    FREE
    Every indicator has its advantages and disadvantages. Trending ones show good signals during a trend, but lag during a flat. Flat ones thrive in the flat, but die off as soon as a trend comes. All this would not be a problem, if it was easy to predict when a flat changes to a trend and when a trend changes to a flat, but in practice it is an extremely serious task. What if you develop such an algorithm, which could eliminate an indicator's flaws and enhance its strengths? What if such an algori
    Do you want to see the future lines of the ZigZag indicator? This indicator will help you do that because the indicator model is based on two indicators:   Historical Memory   and ZigZag. So it can forecast the ZigZag lines. Very useful as an assistant, acts as a key point to forecast the future price movement. The forecast is made using the method of searching the most similar part in the history (pattern)   to the current one.  The indicator is drawn as a line that shows the result of change o
    Deep Moving Average
    Marat Sultanov
    5 (1)
    Every indicator has its advantages and disadvantages. Trending ones show good signals during a trend, but lag during a flat. Flat ones thrive in the flat, but die off as soon as a trend comes. All this would not be a problem, if it was easy to predict when a flat changes to a trend and when a trend changes to a flat, but in practice it is an extremely serious task. What if you develop such an algorithm, which could eliminate an indicator's flaws and enhance its strengths? What if such an algori
    This indicator identifies the global trend and has a powerful algorithm for filtering out any type of noise that can interfere with trend direction identification. A special filter shows areas of sideways trend, consolidation or flat, which allows you to avoid any uncertainties in the market movement vision and gives a clear understanding of the global trend movement. This indicator has no analogues and gives it unique advantages in the analysis of price movements and determination of the dir
    Do you want to know how an economic event will impact price? What will happen to price after the news? How has an economic news affected price in the past? This indicator can help you with that. Do you like technical analysis? Do you enjoy studying the history to predict the future? But what do you think could be more important than technical analysis, what could improve technical analysis? Of course, it's fundamental analysis! After all, economic events directly impact the market, and theref
    Do you want to know how an economic event will impact price? What will happen to price after the news? How has an economic news affected price in the past? This indicator can help you with that. Do you like technical analysis? Do you enjoy studying the tick history to predict the future? But what do you think could be more important than technical analysis, what could improve technical analysis? Of course, it's fundamental analysis! After all, economic events directly impact the market, and t
    Filtro:
    autovolk
    847
    autovolk 2020.12.04 11:34 
     

    В целом полезный и хороший индикатор.

    Respuesta al comentario