• Información general
  • Comentarios
  • Discusión
  • Novedades

Gold Snake Trends

"¡Crecer juntos!"
"Cooperativa QQ: 556024"
"Cooperación wechat: 556024"
"Correo electrónico cooperativo: 556024@qq.com"


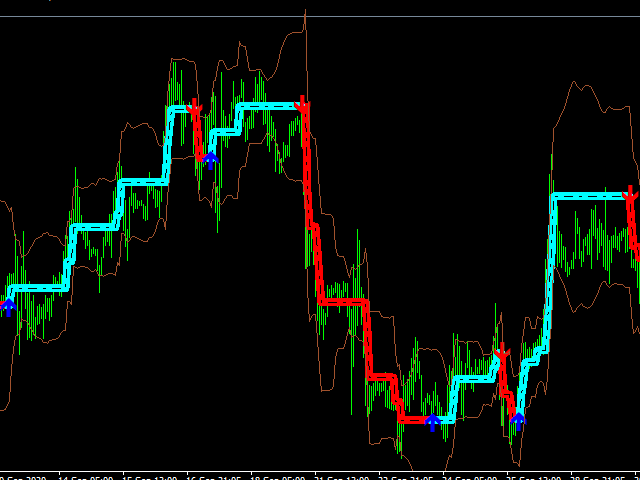
  "La tendencia se está formando o muriendo, y seguir a la serpiente danzante dando vueltas, avanzando juntos, sin darse por vencidos
  "Juicio claramente visible a largo y corto, ¡síguelo!"
"La serpiente retorcida es la escalera que lleva a la tendencia, paso a paso, ¡asciende y desciende!"
  "¡Somos buenos amigos de Trend y Shock también es nuestro mejor socio!"
"¡Crecer juntos!"

Contenido del índice:
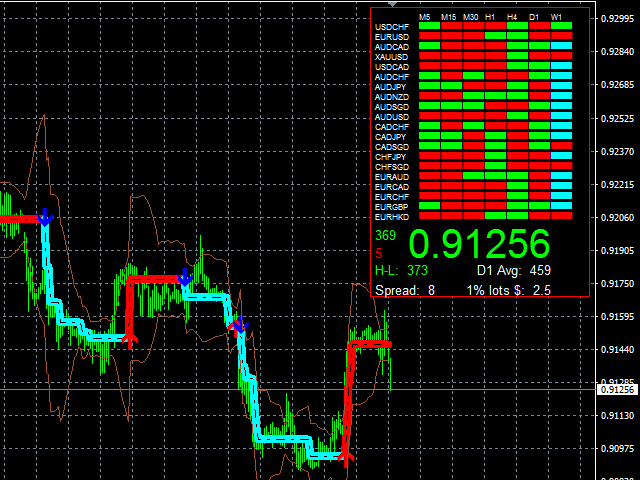
1. El precio de referencia, se refiere al precio de referencia. A corto plazo, el precio fluctúa de forma continua y desordenada, y el destino a corto plazo parecerá impredecible.
2. Dirección de la tendencia de referencia

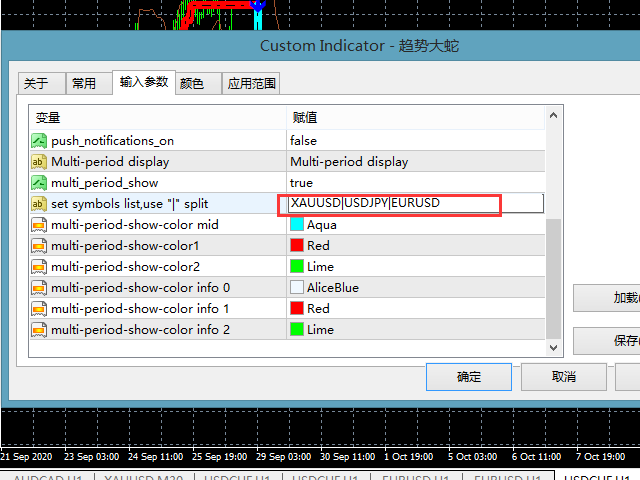
3. Visualización de tendencias de múltiples variedades y períodos


Nota: Hay un límite de 20 variedades como máximo, de lo contrario el sistema se congelará.

Sugerir:
Debilite las fluctuaciones a corto plazo de la línea K y siga la tendencia de mediano a largo plazo.
Productos recomendados
Blahtech Market Profile
Blahtech Limited
4.61 (18)
Was: $249  Now: $99   Market Profile defines a number of day types that can help the trader to determine market behaviour. A key feature is the Value Area, representing the range of price action where 70% of trading took place. Understanding the Value Area can give traders valuable insight into market direction and establish the higher odds trade. It is an excellent addition to any system you may be using. Blahtech Limited presents their Market Profile indicator for the MetaTrader community. Ins
BoxChart MT4
Evgeny Shevtsov
4.57 (7)
The market is unfair if only because 10% of participants manage 90% of funds. An ordinary trader has slim changes to stand against these "vultures". This problem can be solved. You just need to be among these 10%, learn to predict their intentions and move with them. Volume is the only preemptive factor that faultlessly works on any timeframe and symbol. First, the volume appears and is accumulated, and only then the price moves. The price moves from one volume to another. Areas of volume accumu
Daily Candle Predictor es un indicador que predice el precio de cierre de una vela. El indicador está destinado principalmente para su uso en gráficos D1. Este indicador es adecuado tanto para el comercio de divisas tradicional como para el comercio de opciones binarias. El indicador se puede utilizar como un sistema de negociación independiente o puede actuar como una adición a su sistema de negociación existente. Este indicador analiza la vela actual, calculando ciertos factores de fuerza dent
Un indicador técnico que calcula sus lecturas sobre los volúmenes de negociación. En forma de histograma, muestra la acumulación de la fuerza del movimiento del instrumento comercial. Dispone de sistemas de cálculo independientes para direcciones alcistas y bajistas. Funciona en cualquier instrumento comercial y marco de tiempo. Puede complementar cualquier sistema comercial. El indicador no vuelve a dibujar sus valores, las señales aparecen en la vela actual. Es fácil de usar y no carga el gr
The Chaikin Oscillator is a technical indicator developed by Marc Chaikin that combines price and volume data to measure the accumulation and distribution of a financial instrument. It aims to identify potential buying and selling opportunities in the market. The Chaikin Oscillator is calculated by subtracting a 10-day exponential moving average of the Accumulation Distribution Line (ADL) from a 3-day exponential moving average of the ADL. Here's how to use the Chaikin Oscillator indicator in tr
PZ Trend Trading
PZ TRADING SLU
4.8 (5)
Trend Trading es un indicador diseñado para sacar el máximo provecho posible de las tendencias que tienen lugar en el mercado, mediante el cronometraje de retrocesos y rupturas. Encuentra oportunidades comerciales al analizar qué está haciendo el precio durante las tendencias establecidas. [ Guía de instalación | Guía de actualización | Solución de problemas | FAQ | Todos los productos ] Opere en los mercados financieros con confianza y eficiencia Aproveche las tendencias establecidas sin s
Master Scalping M1 es un indicador innovador que utiliza un algoritmo para determinar la tendencia de forma rápida y precisa. El indicador calcula el tiempo de apertura y cierre de posiciones, los algoritmos del indicador le permiten encontrar los momentos ideales para ingresar a una operación (comprar o vender un activo), lo que aumenta el éxito de las transacciones para la mayoría de los comerciantes. Beneficios del indicador: Fácil de usar, no sobrecarga el gráfico con información innecesari
Blahtech Supply Demand
Blahtech Limited
4.63 (35)
Was: $299  Now: $99   Supply Demand uses previous price action to identify potential imbalances between buyers and sellers. The key is to identify the better odds zones, not just the untouched ones. Blahtech Supply Demand indicator delivers functionality previously unavailable on any trading platform. This 4-in-1 indicator not only highlights the higher probability zones using a multi-criteria strength engine, but also combines it with multi-timeframe trend analysis, previously confirmed swings
Indicador Perfil de Volumen para MT4 Obtén una ventaja en el trading con el indicador "Perfil de Volumen" para MetaTrader 4 (MT4). Esta herramienta avanzada de análisis técnico te permite identificar con precisión niveles clave de soporte y resistencia basados en el volumen de transacciones. Visualiza fácilmente las áreas de mayor interés del mercado, donde los volúmenes de negociación son más altos, y utiliza esta información para tomar decisiones de trading más informadas. Características prin
El indicador construye cotizaciones actuales, que se pueden comparar con las históricas y, sobre esta base, hacer un pronóstico de movimiento de precios. El indicador tiene un campo de texto para una navegación rápida a la fecha deseada. Opciones: Símbolo - selección del símbolo que mostrará el indicador; SymbolPeriod - selección del período del cual el indicador tomará datos; IndicatorColor - color del indicador; HorisontalShift: cambio de cotizaciones dibujadas por el indicador
The indicator for determining key patterns for the BBMA strategy will perfectly complement the Fibo Musang strategy, and can also be used as an independent tool. IMPORTANT! Contact me immediately after purchase to receive the second file! If you have any questions, I will help you deal with the indicator. Designed to save market analysis time; Sends push notifications to the phone when key moments of the strategy have arisen (Extrem A, Csak, cross the BB line with a candle) Advantages Easy to u
Retroceso de Fibonacci & Herramientas de Dibujo de Líneas Extendidas Retroceso de Fibonacci & Herramientas de Dibujo de Líneas Extendidas son aptos para la plataforma MT4 y para operadores que emplean el método de negociación de puntos y la negociación de sección áurea. Ventajas: Sin líneas excusadas ni las excesivamente largas, y es fácil de observar y descubrir oportunidades de negociación. Versión de prueba: https://www.mql5.com/zh/market/product/35884 Funciones principales: 1.
VR Cub
Vladimir Pastushak
VR Cub es un indicador para obtener puntos de entrada de alta calidad. El indicador fue desarrollado para facilitar los cálculos matemáticos y simplificar la búsqueda de puntos de entrada a una posición. La estrategia comercial para la cual se diseñó el indicador ha demostrado su eficacia durante muchos años. La simplicidad de la estrategia comercial es su gran ventaja, que permite que incluso los operadores novatos negocien con éxito con ella. VR Cub calcula los puntos de apertura de posiciones
VolumeProfile
Robert Hess
3.8 (5)
Descption: The Volume Profile displays detailed informations of historical trading activities at certain price levels (Market Profile). So you can locate the areas with the best prices in the market and get an advantage about other market participants. Features: Customizable Volume Profile / Market Profile Shows the "fair" Value Area with 70% of all Volume Shows critical low volume zones Shows VPOC, VAL and VAH Points Works on all timeframes Also available for MT5 ( https://www.mql5.com/en/m
VR Grid
Vladimir Pastushak
4.57 (7)
El indicador VR Grid está diseñado para crear una cuadrícula gráfica con configuraciones definidas por el usuario. A diferencia de la cuadrícula estándar , VR Grid se utiliza para construir niveles circulares . Dependiendo de la elección del usuario, el paso entre los niveles de ronda puede ser arbitrario. Además, a diferencia de otros indicadores y utilidades, VR Grid mantiene la posición de la grilla incluso cuando cambia el período de tiempo o se reinicia el terminal. Las configuraciones, arc
FREE
Owl smart levels
Sergey Ermolov
4.63 (54)
Versión MT5  |   FAQ El   Indicador Owl Smart Levels   es un sistema comercial completo dentro de un indicador que incluye herramientas de análisis de mercado tan populares como   los fractales avanzados de Bill Williams , Valable ZigZag que construye   la estructura de onda correcta   del mercado y   los niveles de Fibonacci   que marcan los niveles exactos de entrada. en el mercado y lugares para tomar ganancias. Descripción detallada de la estrategia Instrucciones para trabajar con el indi
It will be the best tool for you to make a profit! Through unique algorithms You're going to see an amazing amount of right trading signals Make huge profits every day and realize more possibilities!   Like the car no money to buy it, the love of the girls dare not to pursue?Or the credit card bill is not paid, the rent does not have the extra money to settle?Or are you fed up with being bossed around by your boss and Hope to get more people's respect?Can't afford to buy the things you want ? wa
Zig Zag 123
Stephen Reynolds
Zig Zag 123 tells us when a reversal or continuation is more likely by looking at the shift in supply and demand. When this happens a signature pattern appears known as 123 (also known ABC) will often break out in direction of higher low or lower high. Stop loss and take profit levels have been added. There is a panel that shows the overall performance of your trades for if you was to use these stop loss and take profit levels.  We get alerted if a pattern 123 appears and also if the price
Simply The Best Pro
Szymon Palczynski
5 (1)
This indicator displays the histogram and arrows on chart. When Simple The Best Pro are placed on a chart, they identify the trend.  The color of may be blue or red. The blue color stands for upside moves and the red color stands for downside trends. The indicator offers to set Stop Loss (SL) and  Take Profit (TP)  setting. The default value is ATR. Indicator has automatic optimization. The STB is a unique indicator that shows the tendency (button Bars) of a particular signals. The STB tells us
Market Dynamics
Thomas Bradley Butler
Market Dynamics es para el scalping de tendencias. El azul es comprar y el rojo es vender. Las líneas son áreas de consolidación de precios y las velas de barra regulares no están decididas. El precio se consolidará entre las líneas de soporte y resistencia y luego habrá una ruptura de la acción del precio fuera de las áreas. Pica las áreas por encima o por debajo del cuero cabelludo y sigue las tendencias principales o el comercio diario de cueros cabelludos.
Le presentamos el indicador "Candle closing counter", que se convertirá en su asistente indispensable en el mundo del trading. Es por eso que saber cuándo se cerrará la vela puede ayudar: Si usted tiene gusto de negociar usando patrones de la vela, usted sabrá cuando la vela será cerrada. Este indicador le permitirá comprobar si se ha formado un patrón conocido y si hay una posibilidad de negociación. El indicador le ayudará a prepararse para la apertura del mercado y el cierre del mercado.
Старый, добрый "AP" в версии трендового осциллятора. Это простой индикатор, который использует максимум возможностей языка MQL4. Но при этом он работает достаточно быстро даже на процессорах 1 Гигагерц и менее. При анализе следует обращать внимание на пересечение уровня 50, если вы намеренны использовать его как трендовый индикатор. Индикатор не перерисовывает, и работает на всех типах графиков и таймфреймах. Сделаны основные возможности оповещения, оповещения работают в обоих направлениях
The indicator analyzes the change in the minimum and maximum prices of the previous bars fixing the entrance of the big players. If the change (delta) increases, a signal is displayed on the graph in the form of an arrow. At the same time, virtual trade on history is carried out. In case of a repeat of the signal, the positions are increased (refilling). Thus the lot of positions can differ. The results of virtual trading in the form of losses / losses, profitability, drawdown and transaction li
Infinity Trend Pro
Yaroslav Varankin
1 (1)
This is a trend indicator without redrawing Developed instead of the binary options strategy (by the color of the Martingale candlestick) Also works well in forex trading When to open trades (binary options) A signal will appear in the place with a candle signaling the current candle It is recommended to open a deal for one candle of the current timeframe M1 and M5 When a blue dot appears, open a deal up When a red dot appears, open a trade down. How to open trades on Forex. When a signal is rec
Cosmic Diviner X Planet
Olena Kondratenko
4 (2)
This unique multi-currency strategy simultaneously determines the strength of trends and market entry points, visualizing this using histograms on the chart. The indicator is optimally adapted for trading on the timeframes М5, М15, М30, Н1. For the convenience of users, the indicator renders the entry point (in the form of an arrow), recommended take profit levels (TP1, TP2 with text labels) and the recommended Stop Loss level. The take profit levels (TP1, TP2) are automatically calculated for
Forex Gump
Andrey Kozak
2.83 (6)
Forex Gump is a fully finished semi-automatic trading system. In the form of arrows, signals are displayed on the screen for opening and closing deals. All you need is to follow the instructions of the indicator. When the indicator shows a blue arrow, you need to open a buy order. When the indicator shows a red arrow, you need to open a sell order. Close orders when the indicator draws a yellow cross. In order to get the most effective result, we recommend using the timeframes H1, H4, D1. There
CyberZingFx Trend Reversal
Afsal Meerankutty
4.26 (19)
Indicator captures the trend reversals with no-repaint Buy and Sell Arrow signals. CyberZingFx Trend Reversal Indicator - your go-to solution for accurate and reliable trend reversal signals. With its  advanced trading strategy , the indicator offers you Buy and Sell Arrow signals that do not repaint, making it a reliable tool for catching Swing Highs and Swing Lows in any market and any time frame. Indicator works on  any market  and  any time frames . __________________________________________
The indicator displays the data of the Stochastic oscillator from a higher timeframe on the chart. The main and signal lines are displayed in a separate window. The stepped response is not smoothed. The indicator is useful for practicing "manual" forex trading strategies, which use the data from several screens with different timeframes of a single symbol. The indicator uses the settings that are identical to the standard ones, and a drop-down list for selecting the timeframe. Indicator Parame
Point61 Indicator
Evgeniy Machok
5 (1)
The Point61 indicator is the result of many years of monitoring of price behavior of currency pairs and metals. It is not a secret, that in times of uncertainty, traders are looking for possible levels of support and resistance - the point, where price should stop its movement. There are 2 possible scenarios at these points: 1. Reverse (correction) to the opposite direction; 2. Breakthrough to continue movement. Very often these points are used to set stop orders - TakeProfit or
Este indicador está diseñado para determinar el momento de mayor actividad comercial dentro de un día. Después de este cálculo, el indicador construye los niveles comerciales más significativos. La comparación de estos niveles con la acción del precio real puede proporcionar información sobre la fuerza y ​​la dirección de las tendencias del mercado. Características del indicador El plazo debe ser inferior a D1. Plazos recomendados: M15, M30 y H1. Los marcos de tiempo por encima de H1 pueden d
Los compradores de este producto también adquieren
Gann Made Easy
Oleg Rodin
4.93 (87)
Gann Made Easy es un sistema de comercio de Forex profesional y fácil de usar que se basa en los mejores principios de comercio utilizando la teoría del Sr. W. D. Gann. El indicador proporciona señales precisas de COMPRA y VENTA, incluidos los niveles de Stop Loss y Take Profit. Puede comerciar incluso sobre la marcha utilizando notificaciones PUSH. ¡Por favor, póngase en contacto conmigo después de la compra! ¡Compartiré mis consejos comerciales con usted y excelentes indicadores de bonificació
Gold Stuff
Vasiliy Strukov
4.89 (263)
Gold Stuff: un indicador de tendencia diseñado específicamente para el oro, también se puede usar en cualquier instrumento financiero. El indicador no se vuelve a dibujar ni se retrasa. El marco de tiempo recomendado es H1. Este indicador está escrito por EA Gold Stuff Advisor, puede encontrarlo en mi perfil.  Puede obtener una copia gratuita de nuestro indicador Strong Support y Trend Scanner, por favor envíe un mensaje privado. ¡a mí! IMPORTANTE! Póngase en contacto conmigo inmediatamente d
Scalper Inside PRO
Alexey Minkov
4.75 (59)
An exclusive indicator that utilizes an innovative algorithm to swiftly and accurately determine the market trend. The indicator automatically calculates opening, closing, and profit levels, providing detailed trading statistics. With these features, you can choose the most appropriate trading instrument for the current market conditions. Additionally, you can easily integrate your own arrow indicators into Scalper Inside Pro to quickly evaluate their statistics and profitability. Scalper Inside
¡Actualmente 20% OFF ! ¡La mejor solución para cualquier novato o trader experto! Este software funciona con 28 pares de divisas. Se basa en 2 de nuestros principales indicadores (Advanced Currency Strength 28 y Advanced Currency Impulse). Proporciona una gran visión general de todo el mercado de divisas. Muestra los valores de Advanced Currency Strength, la velocidad de movimiento de las divisas y las señales para 28 pares de divisas en todos los (9) marcos temporales. Imagine cómo mejorar
TPSpro RFI Levels
Roman Podpora
4.86 (21)
Reversal First Impulse levels (RFI)    INSTRUCTIONS        RUS       -       ENG              R ecommended to use with an indicator   -   TPSpro  TREND PRO -  Version MT5 A key element in trading is zones or levels from which decisions to buy or sell a trading instrument are made. Despite attempts by major players to conceal their presence in the market, they inevitably leave traces. Our task was to learn how to identify these traces and interpret them correctly. Main functions: Displaying activ
AT Forex Indicator MT4
Marzena Maria Szmit
5 (2)
The AT Forex Indicator MT4 is a sophisticated trading tool designed to provide traders with a comprehensive analysis of multiple currency pairs. This   powerful indicator   simplifies the complex nature of the forex market, making it accessible for both novice and experienced traders. AT Forex Indicator uses   advanced algorithms   to detect trends, patterns and is an essential tool for traders aiming to enhance their forex trading performance. With its robust features, ease of use, and reliabl
FX Power MT4 NG
Daniel Stein
5 (11)
Obtenga su actualización diaria del mercado con detalles y capturas de pantalla a través de nuestro Morning Briefing aquí en mql5 y en Telegram ! FX Power MT4 NG es la nueva generación de nuestro popular medidor de fuerza de divisas, FX Power. ¿Y qué ofrece este medidor de fuerza de nueva generación? Todo lo que le encantaba del FX Power original PLUS Análisis de fuerza de ORO/XAU Resultados de cálculo aún más precisos Períodos de análisis configurables individualmente Límite de cálculo persona
Ante todo, vale la pena enfatizar que esta Herramienta de Trading es un Indicador No Repintado, No Redibujado y No Retrasado, lo que la hace ideal para el trading profesional. Curso en línea, manual del usuario y demostración. El Indicador de Conceptos de Acción del Precio Inteligente es una herramienta muy potente tanto para traders nuevos como experimentados. Combina más de 20 indicadores útiles en uno solo, combinando ideas avanzadas de trading como el Análisis del Trader del Círculo Interio
TPSproTREND PrO
Roman Podpora
4.78 (18)
TPSpro TRENDPRO  - is a trend indicator that automatically analyzes the market and provides information about the trend and each of its changes, as well as giving signals for entering trades without redrawing! The indicator uses each candle, analyzing them separately. referring to different impulses - up or down impulse. Exact entry points into transactions for currencies, crypto, metals, stocks, indices!  -  Version MT5               DETAILED DESCRIPTION                R ecommended to use with
Trend Screener
STE S.S.COMPANY
4.83 (90)
Indicador de tendencia, solución única e innovadora para el comercio y filtrado de tendencias con todas las funciones de tendencias importantes integradas en una sola herramienta. Es un indicador 100% sin repintar de marcos temporales y monedas múltiples que se puede usar en todos los símbolos/instrumentos: divisas, materias primas, criptomonedas, índices y acciones. Trend Screener es un indicador de seguimiento de tendencia eficiente que proporciona señales de tendencia de flecha con puntos en
Indicator : RealValueIndicator Description : RealValueIndicator is a powerful tool designed specifically for trading on the EURUSD pair. This indicator analyzes all EUR and USD pairs, calculates their real currency strength values, and displays them as a single realistic value to give you a head start on price. This indicator will tell you moves before they happen if you use it right. RealValueIndicator allows you to get a quick and accurate overview of the EURUSD currency pair tops and bottoms,
Trend Punch
Mohamed Hassan
5 (16)
Manual guide:   Click here WEEK SALE PROMO:   $59 ONLY!  -- Next price is  $120 .  This indicator is unstoppable when combined with our other indicator called  Support & Resistance . After purchase, send us a message and you will get it   for  FREE as a BONUS! I like to use Trend Punch on XAUUSD on the M1 timeframe & higher ones!  Introducing Trend Punch , the revolutionary forex trend indicator that will transform the way you trade! Trend Punch is uniquely designed to provide pre
Introduciendo       Indicador Quantum Trend Sniper   , el innovador indicador MQL5 que está transformando la forma en que identificas y negocias los cambios de tendencia. Desarrollado por un equipo de comerciantes experimentados con experiencia comercial de más de 13 años,       Indicador de francotirador de tendencia cuántica       está diseñado para impulsar su viaje comercial a nuevas alturas con su forma innovadora de identificar cambios de tendencia con una precisión extremadamente alta.
TrendMaestro
Stefano Frisetti
5 (3)
note: this indicator is for METATRADER4, if you want the version for METATRADER5 this is the link:  https://www.mql5.com/it/market/product/108106 TRENDMAESTRO ver 2.4 TRENDMAESTRO recognizes a new TREND in the bud, he never makes mistakes. The certainty of identifying a new TREND is priceless. DESCRIPTION TRENDMAESTRO identifies a new TREND in the bud, this indicator examines the volatility, volumes and momentum to identify the moment in which there is an explosion of one or more of these data a
Atomic Analyst
Issam Kassas
5 (3)
En primer lugar, vale la pena enfatizar que este Indicador de Trading no repinta, no redibuja y no se retrasa, lo que lo hace ideal tanto para el trading manual como para el automatizado. Manual del usuario: configuraciones, entradas y estrategia. El Analista Atómico es un Indicador de Acción del Precio PA que utiliza la fuerza y el impulso del precio para encontrar una mejor ventaja en el mercado. Equipado con filtros avanzados que ayudan a eliminar ruidos y señales falsas, y aumentan el poten
ACTUALMENTE 26% DE DESCUENTO ¡La mejor solución para cualquier operador novato o experto! Este indicador es una herramienta única, de alta calidad y asequible porque hemos incorporado una serie de características propias y una nueva fórmula. ¡Con sólo UN gráfico puede leer la Fuerza de la Divisa para 28 pares de Divisas! Imagínese cómo mejorará su operativa porque podrá señalar el punto exacto de activación de una nueva tendencia o de una oportunidad de scalping. Manual del usuario: haga
M1 Arrow
Oleg Rodin
5 (14)
Una estrategia intradía basada en dos principios fundamentales del mercado. El algoritmo se basa en el análisis de volúmenes y ondas de precios utilizando filtros adicionales. El algoritmo inteligente del indicador da una señal solo cuando dos factores de mercado se combinan en uno. El indicador calcula ondas de cierto rango en el gráfico M1 utilizando los datos del marco de tiempo más alto. Y para confirmar la onda, el indicador utiliza el análisis por volumen. Este indicador es un sistema come
Advanced Supply Demand
Bernhard Schweigert
4.92 (313)
¡Actualmente con 33% de descuento! ¡La mejor solución para cualquier tráder principiante o experto! Este indicador es una herramienta comercial única, de alta calidad y asequible, porque incorpora una serie de características patentadas y una nueva fórmula. Con esta actualización, podrá mostrar zonas de doble marco temporal. No solo podrá mostrar un marco temporal más alto, sino también mostrar ambos, el marco temporal del gráfico MÁS el marco temporal más alto: MOSTRANDO ZONAS ANIDADAS. A todos
Quantum Breakout Indicator PRO
Bogdan Ion Puscasu
4.96 (26)
Introduciendo       Quantum Breakout PRO   , el innovador indicador MQL5 que está transformando la forma en que comercia con Breakout Zones. Desarrollado por un equipo de operadores experimentados con experiencia comercial de más de 13 años,   Quantum Breakout PRO   está diseñado para impulsar su viaje comercial a nuevas alturas con su innovadora y dinámica estrategia de zona de ruptura. El indicador de ruptura cuántica le dará flechas de señal en las zonas de ruptura con 5 zonas objetivo de
NAM Order Blocks
NAM TECH GROUP, CORP.
5 (1)
Indicador de detección de Order Blocks multitimeframe para MT4. Características - Panel de control totalmente personalizable, proporciona una interacción completa. - Oculta y muestra el panel de control donde quieras. - Detecta OB en múltiples marcos de tiempo. - Permite seleccionar la cantidad de OB para mostrar. - Interfaz de usuario de diferentes OBs. - Diferentes filtros de OBs (regulares, rejection y sin capitalizar). - Alerta de proximidad de OBs. - Líneas ADR High y Low. - Servicio de not
FX Volume
Daniel Stein
4.61 (36)
Obtenga su actualización diaria del mercado con detalles y capturas de pantalla a través de nuestro Morning Briefing aquí en mql5 y en Telegram ! FX Volume es el PRIMER y ÚNICO indicador de volumen que proporciona una visión REAL del sentimiento del mercado desde el punto de vista de un bróker. Proporciona una visión impresionante de cómo los participantes institucionales del mercado, como los brokers, están posicionados en el mercado Forex, mucho más rápido que los informes COT. Ver esta info
El indicador de reversión de ADR le muestra de un vistazo dónde se cotiza actualmente el precio en relación con su rango diario promedio normal. Recibirá alertas instantáneas a través de una ventana emergente, correo electrónico o push cuando el precio exceda su rango promedio y los niveles por encima de su elección para que pueda saltar rápidamente a retrocesos y reversiones. El indicador dibuja líneas horizontales en el gráfico en los extremos del rango promedio diario y también extensiones p
IX Power MT4
Daniel Stein
5 (6)
IX Power lleva por fin la insuperable precisión de FX Power a los símbolos que no son de Forex. Determina con exactitud la intensidad de las tendencias a corto, medio y largo plazo de tus índices, acciones, materias primas, ETF e incluso criptodivisas favoritas. Puede analizar todo lo que su terminal le ofrece. Pruébalo y experimenta cómo tu timing mejora significativamente a la hora de operar. Características principales de IX Power Resultados de cálculo 100% precisos y sin repintado -
Enigmera
Ivan Stefanov
5 (4)
ENIGMERA: El núcleo del mercado https://www.enigmera.com Introducción Este indicador y sistema de negociación es un enfoque extraordinario de los mercados financieros. ENIGMERA utiliza los ciclos fractales para calcular con precisión los niveles de soporte y resistencia. Muestra la auténtica fase de acumulación y proporciona dirección y objetivos.  Un sistema que funciona tanto si estamos en una tendencia como en una corrección.  ¿Cómo funciona? ENIGMERA consta de tres líneas: la línea de s
TrendDecoder Premium
Christophe Pa Trouillas
5 (6)
Identifique los rangos y los próximos movimientos probables   |  Obtenga las señales más tempranas y la fuerza de las Tendencias   |  Obtener salidas claras antes de reversión   |  Detecte los niveles de Fibo que el precio pondrá a prueba Indicador no repintado y no retardado - ideal para la trading manual y automatizada - adecuado para todos los activos y todas las unidades temporales Oferta por tiempo limitado >>   50% OFF Después de la compra, póngase en contacto con mi canal  para conocer lo
Cycle Sniper
Elmira Memish
4.41 (37)
NEW YEAR SALE PRICE FOR LIMITED TIME!!! Please contact us after your purchase and we will send you the complimentary indicators to complete the system Cycle Sniper is not a holy grail but when you use it in a system which is explained in the videos, you will feel the difference. If you are not willing to focus on the charts designed with Cycle Sniper and other free tools we provide, we recommend not buying this indicator. We recommend watching the videos about the indiactor and system before pu
Legacy of Gann
Pavel Zamoshnikov
4.85 (13)
The indicator very accurately determines the levels of the possible end of the trend and profit fixing. The method of determining levels is based on the ideas of W.D.Gann, using an algorithm developed by his follower Kirill Borovsky. Extremely high reliability of reaching levels (according to K. Borovsky  - 80-90%) Indispensable for any trading strategy – every trader needs to determine the exit point from the market! Precisely determines targets on any timeframes and any instruments (forex, met
All in One Trade
Alexey Minkov
4.48 (27)
The All-in-One Trade Indicator (AOTI) determines daily targets for EURUSD, EURJPY, GBPUSD, USDCHF, EURGBP, EURCAD, EURAUD, AUDJPY, GBPAUD, GBPCAD, GBPCHF, GBPJPY, AUDUSD, and USDJPY. All other modules work with any trading instruments. The indicator includes various features, such as Double Channel trend direction, Price channel, MA Bands, Fibo levels, Climax Bar detection, and others. The AOTI indicator is based on several trading strategies, and created to simplify market analysis. All-in-One
Currency Strength Wizard es un indicador muy poderoso que le proporciona una solución todo en uno para operar con éxito. El indicador calcula el poder de este o aquel par de divisas utilizando los datos de todas las monedas en múltiples marcos de tiempo. Estos datos se representan en forma de índice de moneda fácil de usar y líneas eléctricas de moneda que puede usar para ver el poder de esta o aquella moneda. Todo lo que necesita es adjuntar el indicador al gráfico que desea operar y el indicad
TakePropips Donchian Trend Pro
Eric John Pajarillaga Aldana
4.61 (18)
¡TakePropips Donchian Trend Pro   (MT4) es una herramienta poderosa y efectiva que detecta automáticamente la dirección de la tendencia utilizando el Canal Donchian y le proporciona señales comerciales de entrada y salida! Este indicador multifunción incluye un escáner de tendencias, señales comerciales, panel estadístico, filtro, sesiones comerciales y panel de historial de alertas. ¡Está diseñado para proporcionarle señales comerciales y ahorrarle horas analizando los gráficos! Puede descargar
Otros productos de este autor
¡El mejor socio para los comerciantes!       Instrucciones de operación del asistente comercial Configuración de uso básico Básico: Admite interruptor de selección de idioma (actualmente admite chino e inglés)           reconocimiento automático de idioma Apoyar la unión de       tecla de acceso rápido para abrir y cerrar posiciones       , utilice las teclas de acceso directo para abrir y cerrar posiciones rápidamente...       Teclas de atajo para cerrar posiciones. El desblo
[跟单系统] T he most friendly Copier interactive interface, the most abundant easy-to-use functions, and the best Copy solution.    EASY   : Easy to use, load and select the Master or SLAVE to use easily FAST:   Quickly copy orders, algorithmic optimal follow-up mechanism, priority calculation of new signals, priority queue processing received special signals Multiple:   1. Support multiple signals to be sent at the same time, multiple accounts can select multiple accounts to copy at the same time 2
[跟单系统] T he most friendly Copier interactive interface, the most abundant easy-to-use functions, and the best Copy solution.    EASY   : Easy to use, load and select the Master or SLAVE to use easily  FAST:   Quickly copy orders, algorithmic optimal follow-up mechanism, priority calculation of new signals, priority queue processing received special signals Multiple:   1. Support multiple signals to be sent at the same time, multiple accounts can select multiple accounts to copy at the same time
KDJ Index 4   交易实用必备工具指标 波浪自动计算指标,通道趋势交易 完美的趋势-波浪自动计算通道计算 , MT4版本 完美的趋势-波浪自动计算通道计算 , MT5版本 本地跟单复制交易 Easy And Fast Copy , MT4版本 Easy And Fast Copy , MT5版本 本地跟单复制交易 模拟试用 Easy And Fast Copy , MT4 模拟账号运行 Easy And Fast Copy , MT5 模拟账号运行 "Cooperative QQ:556024  "  "Cooperation wechat:556024"  "Cooperative email:556024@qq.com" 强烈推荐趋势指标, 波浪的标准自动计算   和   波浪的标准自动计算MT5版本     KDJ指标又叫 随机指标 ,是一种相当新颖、实用的技术分析指标,它起先用于期货市场的分析,后被广泛用于股市的中短期趋势分析,是期货和股票市场上最常用的技术分析工具。 随机指标KDJ一般是用于股票分析的统计体系,根据统计学原理,通过一个特定的周期(常为9日、9周等
Comercio dinámico: 1.pp pivote 2. r1 r2 r3, s1 s2 s3 Necessary for traders: tools and indicators Waves automatically calculate indicators, channel trend trading Perfect trend-wave automatic calculation channel calculation , MT4 Perfect trend-wave automatic calculation channel calculation , MT5 Local Trading copying Easy And Fast Copy , MT4 Easy And Fast Copy , MT5 Local Trading copying For DEMO Easy And Fast Copy , MT4 DEMO Easy And Fast Copy , MT5 DEMO Cooperación QQ: 556024 " Wechat
FREE
Necessary for traders: tools and indicators Waves automatically calculate indicators, channel trend trading Perfect trend-wave automatic calculation channel calculation , MT4 Perfect trend-wave automatic calculation channel calculation , MT5 Local Trading copying Easy And Fast Copy , MT4 Easy And Fast Copy , MT5 Local Trading copying For DEMO Easy And Fast Copy , MT4 DEMO Easy And Fast Copy , MT5 DEMO 砖图 Renko PRO->>>   The display of the brick map on the main map. The Renko chart ideal
FREE
K Trade Assistant MT5
Kaijun Wang
4.67 (21)
El       mejor socio para los comerciantes!       Asistente comercial: Esta es una ayuda comercial muy rica en funciones. El desarrollo no es fácil, por favor apoye Pro Haga clic para saltar Asistente comercial K Pro MT5 Instrucciones de operación del asistente comercial Configuración de uso básico Básico: Admite interruptor de selección de idioma (actualmente admite chino e inglés)           reconocimiento automático de idioma Apoyar la unión de       tecla de acceso rápido par
FREE
Fit Channel MT5
Kaijun Wang
3.67 (3)
The market price usually falls between the borders of the channel    .   If the price is out of range , it is a trading signal or trading opportunity  . Basically , Fit Channel can be used to help determine overbought and oversold conditions in the market. When the market price is close to the upper limit, the market is considered overbought (sell zone). Conversely, when the market price is close to the bottom range, the market is considered oversold (buy zone). However, the research can
Necessary for traders: tools and indicators Waves automatically calculate indicators, channel trend trading Perfect trend-wave automatic calculation channel calculation , MT4 Perfect trend-wave automatic calculation channel calculation , MT5 Local Trading copying Easy And Fast Copy , MT4 Easy And Fast Copy , MT5 Local Trading copying For DEMO Easy And Fast Copy , MT4 DEMO Easy And Fast Copy , MT5 DEMO MACD se denomina media móvil de similitud y diferencia, que se desarrolla a partir de la media
FREE
Pivot Trading 4
Kaijun Wang
5 (17)
Comercio dinámico: 1.pp pivote 2. r1 r2 r3, s1 s2 s3 Necessary for traders: tools and indicators Waves automatically calculate indicators, channel trend trading Perfect trend-wave automatic calculation channel calculation , MT4 Perfect trend-wave automatic calculation channel calculation , MT5 Local Trading copying Easy And Fast Copy , MT4 Easy And Fast Copy , MT5 Local Trading copying For DEMO Easy And Fast Copy , MT4 DEMO Easy And Fast Copy , MT5 DEMO Recomendamos encarecidamente indica
FREE
Necessary for traders: tools and indicators Waves automatically calculate indicators, channel trend trading Perfect trend-wave automatic calculation channel calculation , MT4 Perfect trend-wave automatic calculation channel calculation , MT5 Local Trading copying Easy And Fast Copy , MT4 Easy And Fast Copy , MT5 Local Trading copying For DEMO Easy And Fast Copy , MT4 DEMO Easy And Fast Copy , MT5 DEMO Bandas de Bollinger avanzadas: 1. El riel de Bollinger cambiará de color con la dirección "
FREE
MACD divergence signals   MACD is called Convergence and Divergence Moving Average, which is developed from the double exponential moving average. The fast exponential moving average (EMA12) is subtracted from the slow exponential moving average (EMA26) to get the fast DIF, and then 2× (Express DIF-DIF's 9-day weighted moving average DEA) Get the MACD bar. The meaning of MACD is basically the same as the double moving average, that is, the dispersion and aggregation of the fast and slow moving a
Necessary for traders: tools and indicators Waves automatically calculate indicators, channel trend trading Perfect trend-wave automatic calculation channel calculation , MT4 Perfect trend-wave automatic calculation channel calculation , MT5 Local Trading copying Easy And Fast Copy , MT4 Easy And Fast Copy , MT5 Local Trading copying For DEMO Easy And Fast Copy , MT4 DEMO Easy And Fast Copy , MT5 DEMO 砖图Renko PRO->>> The display of the brick map on the main map. The Renko chart ideally remo
FREE
K Trade Assistant
Kaijun Wang
4.76 (25)
¡   El mejor socio para los comerciantes!     Asistente comercial: Esta es una ayuda comercial muy rica en funciones. El desarrollo no es fácil, por favor apoye Pro Haga clic para saltar Asistente comercial K Pro     Instrucciones de operación del asistente comercial Configuración de uso básico Básico: Admite interruptor de selección de idioma (actualmente admite chino e inglés)       para identificar automáticamente el idioma Apoyar la unión de       tecla de acces
FREE
KDJ Index For MT5
Kaijun Wang
4.29 (14)
Necessary for traders: tools and indicators Waves automatically calculate indicators, channel trend trading Perfect trend-wave automatic calculation channel calculation , MT4 Perfect trend-wave automatic calculation channel calculation , MT5 Local Trading copying Easy And Fast Copy , MT4 Easy And Fast Copy , MT5 Local Trading copying For DEMO Easy And Fast Copy , MT4 DEMO Easy And Fast Copy , MT5 DEMO "Cooperative QQ:556024"  "Cooperation wechat:556024"  "Cooperative email:556024@qq.com" Strong
FREE
¡Los indicadores son para seguidores de tendencias! Un sistema de comercio construido por tres promedios móviles Opere con la tendencia y deje correr las ganancias. Necessary for traders: tools and indicators Waves automatically calculate indicators, channel trend trading Perfect trend-wave automatic calculation channel calculation , MT4 Perfect trend-wave automatic calculation channel calculation , MT5 Local Trading copying Easy And Fast Copy , MT4 Easy And Fast Copy , MT5 Local Trading copy
FREE
KDJ Index 4
Kaijun Wang
5 (11)
Necessary for traders: tools and indicators Waves automatically calculate indicators, channel trend trading Perfect trend-wave automatic calculation channel calculation , MT4 Perfect trend-wave automatic calculation channel calculation , MT5 Local Trading copying Easy And Fast Copy , MT4 Easy And Fast Copy , MT5 Local Trading copying For DEMO Easy And Fast Copy , MT4 DEMO Easy And Fast Copy , MT5 DEMO "Cooperativa QQ: 556024"  "Cooperación wechat: 556024"  "Correo electrónico cooperativo: 55602
FREE
Necessary for traders: tools and indicators Waves automatically calculate indicators, channel trend trading Perfect trend-wave automatic calculation channel calculation , MT4 Perfect trend-wave automatic calculation channel calculation , MT5 Local Trading copying Easy And Fast Copy , MT4 Easy And Fast Copy , MT5 Local Trading copying For DEMO Easy And Fast Copy , MT4 DEMO Easy And Fast Copy , MT5 DEMO Bandas de Bollinger avanzadas: 1. El riel de Bollinger cambiará de color con la dirección "
FREE
¡Los indicadores son para seguidores de tendencias! Un sistema de comercio construido por tres promedios móviles Opere con la tendencia y deje correr las ganancias. Necessary for traders: tools and indicators Waves automatically calculate indicators, channel trend trading Perfect trend-wave automatic calculation channel calculation , MT4 Perfect trend-wave automatic calculation channel calculation , MT5 Local Trading copying Easy And Fast Copy , MT4 Easy And Fast Copy , MT5 Local Trading copy
FREE
KTrade Fibo For MT5
Kaijun Wang
4.9 (10)
Necessary for traders: tools and indicators Waves automatically calculate indicators, channel trend trading Perfect trend-wave automatic calculation channel calculation , MT4 Perfect trend-wave automatic calculation channel calculation , MT5 Local Trading copying Easy And Fast Copy , MT4 Easy And Fast Copy , MT5 Local Trading copying For DEMO Easy And Fast Copy , MT4 DEMO Easy And Fast Copy , MT5 DEMO Fibo: from KTrade 1. Automatically calculate and analyze the band. -> Get the desired band 2.
FREE
Necessary for traders: tools and indicators Waves automatically calculate indicators, channel trend trading Perfect trend-wave automatic calculation channel calculation , MT4 Perfect trend-wave automatic calculation channel calculation , MT5 Local Trading copying Easy And Fast Copy , MT4 Easy And Fast Copy , MT5 Local Trading copying For DEMO Easy And Fast Copy , MT4 DEMO Easy And Fast Copy , MT5 DEMO The homeopathic indicator is also called the CCI indicator. The CCI indicator was propos
FREE
XM Channel
Kaijun Wang
4.67 (3)
The market price usually falls between the borders of the channel . If the price is out of range, it is a trading signal or trading opportunity . Basically, Fit Channel can be used to help determine overbought and oversold conditions in the market. When the market price is close to the upper limit, the market is considered overbought (sell zone). Conversely, when the market price is close to the bottom range, the market is considered oversold (buy zone). However, the research can be used
XM Channel MT5
Kaijun Wang
5 (1)
The market price usually falls between the borders of the channel  . If the price is out of range, it is a trading signal or trading opportunity. Basically, Fit Channel can be used to help determine overbought and oversold conditions in the market. When the market price is close to the upper limit, the market is considered overbought (sell zone). Conversely, when the market price is close to the bottom range, the market is considered oversold (buy zone). However, the research can be used
Necessary for traders: tools and indicators Waves automatically calculate indicators, channel trend trading Perfect trend-wave automatic calculation channel calculation , MT4 Perfect trend-wave automatic calculation channel calculation , MT5 Local Trading copying Easy And Fast Copy , MT4 Easy And Fast Copy , MT5 Local Trading copying For DEMO Easy And Fast Copy , MT4 DEMO Easy And Fast Copy , MT5 DEMO Can set the cycle for other varieties of K line graph covered this window, fluctuations obse
FREE
KTrade Fibo
Kaijun Wang
4.89 (9)
Necessary for traders: tools and indicators Waves automatically calculate indicators, channel trend trading Perfect trend-wave automatic calculation channel calculation , MT4 Perfect trend-wave automatic calculation channel calculation , MT5 Local Trading copying Easy And Fast Copy , MT4 Easy And Fast Copy , MT5 Local Trading copying For DEMO Easy And Fast Copy , MT4 DEMO Easy And Fast Copy , MT5 DEMO Fibo: from KTrade 1. Automatically calculate and analyze the band. -> Get the desired band 2.
FREE
Donchian通道(唐奇安通道指标)是用于交易突破的最古老、最简单的技术指标之一。   一般来说,唐奇安通道的宽度越宽,市场波动就越大,而唐奇安通道越窄,市场波动性也就越小 。此外,价格走势可以穿过布林带,但你看不到唐奇安通道的这种特征,因为其波段正在测量特定时期的最高价和最低价。 交易实用必备工具指标 波浪自动计算指标,通道趋势交易 完美的趋势-波浪自动计算通道计算 , MT4版本 完美的趋势-波浪自动计算通道计算 , MT5版本 本地跟单复制交易 Easy And Fast Copy , MT4版本 Easy And Fast Copy , MT5版本 本地跟单复制交易 模拟试用 Easy And Fast Copy , MT4 模拟账号运行 Easy And Fast Copy , MT5 模拟账号运行 唐奇安通道指标计算: 唐奇安上阻力线 - 由过去N天的当日最高价的最大值形成。 唐奇安下支撑线 - 由过去N天的当日最低价的最小值形成。 中心线 - (上线 + 下线)/ 2   唐奇安通道信号   唐奇安通道常用作突破指标。它提供了两种主要类型的突破信号,一个是上阻力线或下支
FREE
Necessary for traders: tools and indicators Waves automatically calculate indicators, channel trend trading Perfect trend-wave automatic calculation channel calculation , MT4 Perfect trend-wave automatic calculation channel calculation , MT5 Local Trading copying Easy And Fast Copy , MT4 Easy And Fast Copy , MT5 Local Trading copying For DEMO Easy And Fast Copy , MT4 DEMO Easy And Fast Copy , MT5 DEMO MACD is called Convergence and Divergence Moving Average, which is developed from the double e
FREE
Fit Channel
Kaijun Wang
5 (5)
The market price usually falls between the borders of the channel. If the price is out of range, it is a trading signal or trading opportunity. Basically, Fit Channel can be used to help determine overbought and oversold conditions in the market. When the market price is close to the upper limit, the market is considered overbought (sell zone). Conversely, when the market price is close to the bottom range, the market is considered oversold (buy zone). However, the research can be used to
九转序列,源自于TD序列,是因TD序列的9天收盘价研判标准而得名。 汤姆·德马克(Tom DeMark)技术分析界的着名大师级人物,创建了以其名字首字母命名的TD系列的很多指标,价格反转的这个指标就是其中重要的一个,即TD序列。 德马克原版TD序列指标要复杂一些,想研究就自行看关于德马克的资料吧。 这里只说简单的TD序列(九转序列)。 九转序列分为两种结构,低九买入结构和高九卖出结构。 TD高九卖出结构:连续出现的九根K线,这些K线的收盘价都比各自前面的第四根K线的收盘价高,如果满足条件,就在各K线上方标记相应的数字,最后1根就标记为9,如果条件不满足,则K线计数中断,原计数作废重新来数K线。如出现高9,则股价大概率会出现转折。 TD低九买入结构:连续出现的九根K线,这些K线的收盘价都比各自前面的第四根K线的收盘价低,如果满足条件,就在各K线下方标记相应的数字,最后1根就标记为9,如果条件不满足,则K线计数中断,原计数作废重新来数K线。如出现低9,则股价大概率会出现转折。 结构的本质是时间和空间的组合,时间是横轴,空间是纵轴,不同的时间周期和空间大小的组合,形成不同的结构形态,不同
九转序列,源自于TD序列,是因TD序列的9天收盘价研判标准而得名。 汤姆·德马克(Tom DeMark)技术分析界的着名大师级人物,创建了以其名字首字母命名的TD系列的很多指标,价格反转的这个指标就是其中重要的一个,即TD序列。 德马克原版TD序列指标要复杂一些,想研究就自行看关于德马克的资料吧。这里只说简单的TD序列(九转序列)。 九转序列分为两种结构,低九买入结构和高九卖出结构。 TD高九卖出结构:连续出现的九根K线,这些K线的收盘价都比各自前面的第四根K线的收盘价高, 如果满足条件,就在各K线上方标记相应的数字,最后1根就标记为9,如果条件不满足,则K线计数中断,原计数作废重新来数K线。如出现高9,则股价大概率会出现转折。 TD低九买入结构:连续出现的九根K线,这些K线的收盘价都比各自前面的第四根K线的收盘价低,如果满足条件,就在各K线下方标记相应的数字,最后1根就标记为9,如果条件不满足,则K线计数中断,原计数作废重新来数K线。如出现低9,则股价大概率会出现转折。 结构的本质是时间和空间的组合,时间是横轴,空间是纵轴,不同的时间周期和空间大小的组合,形成不同的结构形态,不同
Filtro:
No hay comentarios
Respuesta al comentario
Versión 2.0 2020.10.14
->>更新了 多周期多品种 的多空信号显示......