• Información general
  • Comentarios (5)
  • Discusión (34)
  • Novedades

WaveTheoryFully automatic calculation

5

¡Este indicador es un indicador de análisis automático de ondas perfecto para el comercio práctico!

La definición estandarizada de la banda ya no es una ola de personas diferentes, y se elimina el dibujo de interferencia provocada por el hombre, que juega un papel clave en el análisis riguroso del enfoque. =>Increase the choice of international style mode, (red fall green rise style)

⭐⭐⭐       ¡Descuento de compra actual! ⭐⭐⭐

Contenido del índice:

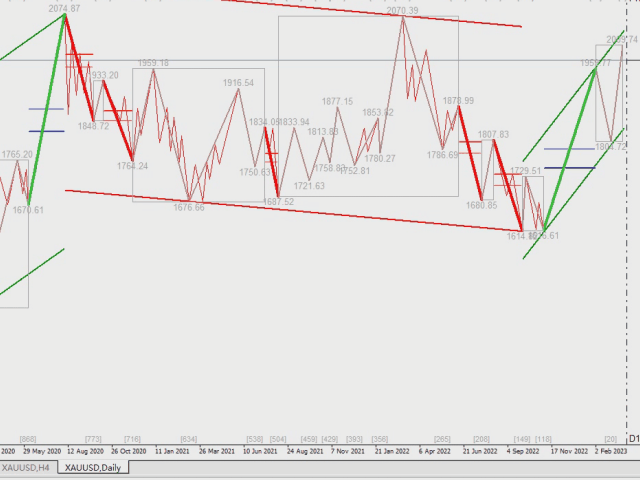
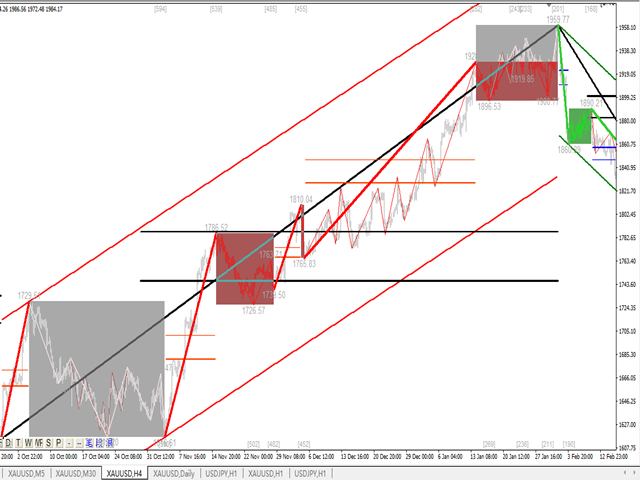
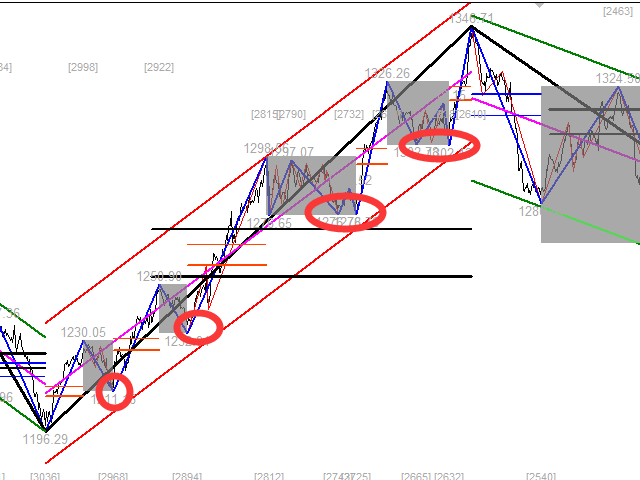
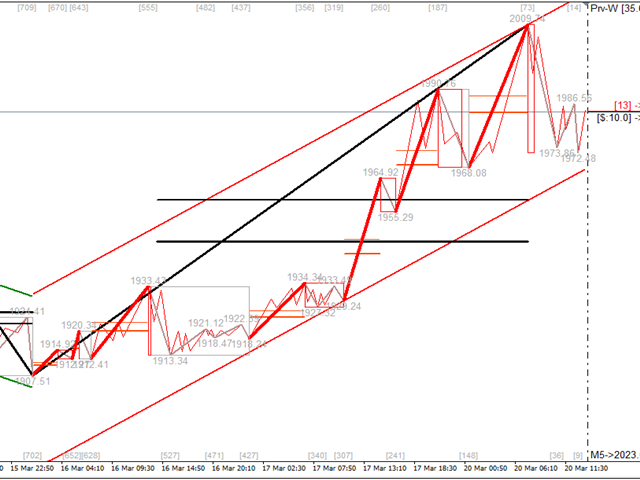
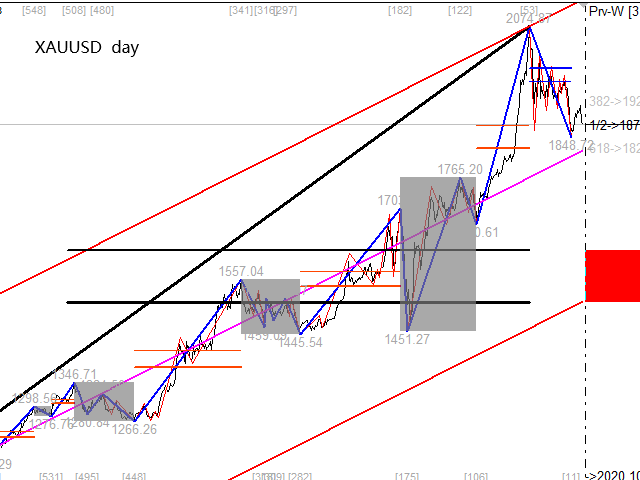
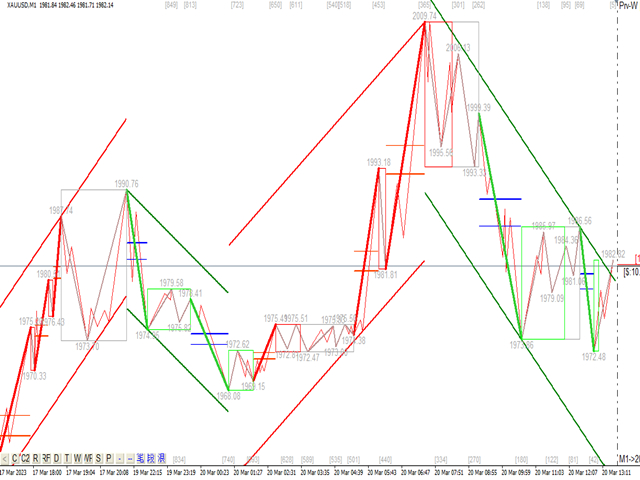
1.     Onda básica: Primero, encontramos el punto de inflexión de la fluctuación básica en el proceso de fluctuación de precios. Por supuesto, su orden no es demasiado fuerte, lo que proporciona una base para el siguiente cálculo.

2.     Banda secundaria : sobre la base de la onda básica, se obtiene una banda secundaria más obvia a través del análisis de algoritmos, y la banda secundaria proporciona una base para el análisis de ondas.

3.     Onda: hay una tendencia más clara y una dirección más clara e intuitiva. Para analizar si una onda continúa, es necesario observar la forma de la banda de onda secundaria y analizar la composición de la onda secundaria para obtener la predicción posterior de la onda secundaria. ola.

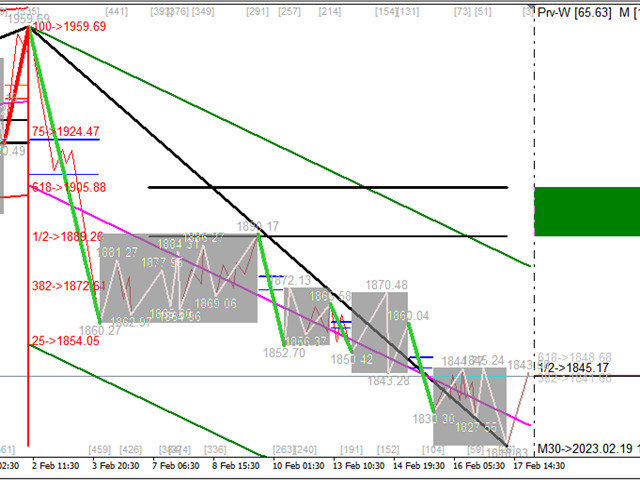
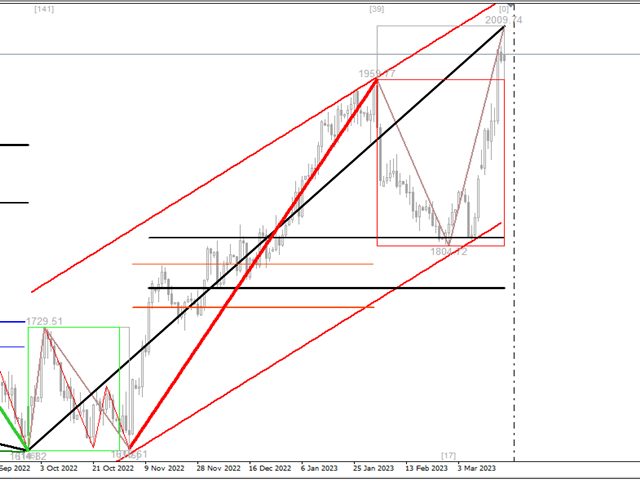
4.     Canal: el cálculo del canal utiliza un método de regresión lineal para el cálculo.

5.     Retroceso: los dos retrocesos importantes en la ola se mostrarán al final de cada ola. La fuerza relativa de estos retrocesos importantes en el combate real y el retroceso real determina el impulso de la tendencia.

6.     Intervalo de oscilación: el intervalo de oscilación está marcado en el indicador

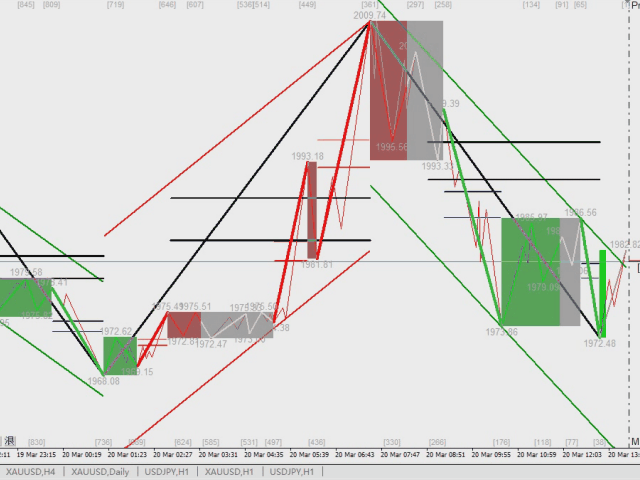
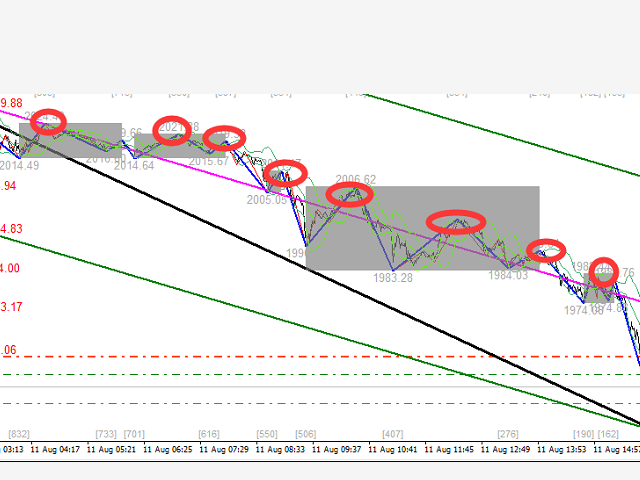
Indicador de combate:

1. La fuente de la teoría del combate real es la teoría de ondas básica, la teoría taoísta.

2. La teoría del combate real se deriva más del combate real, y siempre se beneficiará de la lectura de imágenes mil veces.

3. Originalmente quería escribir algo de experiencia práctica, pero descubrí que el plan de operación se ha ajustado ligeramente en diferentes variedades y fortalezas. La transacción se escribe y actualiza constantemente. La transacción es como una línea enterrada en la arena, incluso si agarra la cuerda, pero la arena sigue cambiando de forma.

4. Cuando la ola se define por cuantificación, la transacción se vuelve simple y efectiva, la tendencia se vuelve muy clara, existe la tendencia general en el corazón y todo se vuelve simple y efectivo.

5. Tanto si se opera a la izquierda como a la derecha, ya sea en el comercio de tendencias o en el comercio oscilante, este conjunto de indicadores tiene sus respuestas. Todos deben sentir el ritmo, el nivel, el impulso y el tiempo de la tendencia y el impacto. es extremadamente importante.

6. Para comprender las ondas y las ondas comerciales, debemos analizar los niveles múltiples y los períodos múltiples.


Experiencia de combate real:

1. La teoría de las ondas y la teoría taoísta están escritas, pero no están completamente en línea con las leyes de las fluctuaciones naturales. Se encontrarán muchas situaciones difíciles en el proceso real de análisis de transacciones.

2. A continuación podemos dividir el mercado en dos tipos, el mercado analizable ordenado y el mercado desordenado.

3. Hay tendencias y choques en el mercado ordenado y analizable. Este segmento del mercado puede ser analizado por nosotros, es decir, la parte graficable y la parte transable. Una vez ordenada esta parte, seguirá con las características ordenadas, por lo que Podemos obtener suficientes ganancias con él.

4. Mercado desordenado, las fluctuaciones aparecerán desordenadas, diferentes a los shocks, el mercado desordenado no puede participar Recogiendo dinero en orden, evitando en desorden.


¡Espero conocer gente destinada, compartir la alegría de comerciar juntos y crecer juntos!

Es más adecuado para oro, petróleo crudo, libra al día, bitcoin y otras variedades de tendencia.

por kjoin.


Comentarios 5
Qilin
30
Qilin 2021.05.18 14:01 
 

Reviewing this at the moment. The indicator looks pretty cool and the developer is really helpful.

연나라
750
연나라 2021.04.15 14:46 
 

I rented this indicator for a month and then bought it today because I liked it so much. There was an mq5 error, but the programmer was really friendly. He did his best to solve the problem. His response is also very quick. I am getting a lot of help from this indicator. Best!

cnbluse
47
cnbluse 2020.12.21 05:28 
 

妈妈再也不担心我犯低级错误了。

Productos recomendados
Introduction to Fractal Pattern Scanner Fractal Indicator refers to the technical indicator that makes use of the fractal geometry found in the financial market. Fractal Pattern Scanner is the advanced Fractal Indicator that brings the latest trading technology after the extensive research and development work in the fractal geometry in the financial market. The most important feature in Fractal Pattern Scanner is the ability to measure the turning point probability as well as the trend probabi
Dear traders I am happy to introduce to you my new tool called "Brilliant Oscillator" Indicator. This is one of the indicators that can be used as a stand alone indicator. WHAT I LIKE ABOUT THIS TOOL IS Fast and reliable signals Purpose The purpose of this tool is to assist both newbie and Advanced traders to analyze the market with high level of accuracy in both bearish and bullish market trends. The inputs In the input section you will be able to change colors of the indicator only. Currency p
Yihaa Shoot applies a unique range calculation and time management to enter a trade. It has a unique money management system which calculates the risk before it takes a trade. Suggested pairs: GBPJPY and USDJPY Timeframe: H1 Suggested balance: $500 ($1000 is recomended) Risk in dollar suggested: 4 (0.5% from $1000) Parameters Signal Settings Margin Top (pip) >> margin top from range Margin Bottom (pip) >> margin bottom from range TP Buy deduct (pip) >> reduce the TP spot TP Sell deduct (pip)
The Trend Professor is a moving average based indicator designed for the purpose of helping the community of traders to analyse the price trend. The indicator will be displayed in the main chart as it is indicated on the screenshot section. How it works The indicator has lines of moving averages and colored histograms to depict the direction of the trend. There will be a fast signal line colored blue/yellow/red at some points. The red/yellow colored lines stands for bearish trend/signal while th
HF SuperZig
Wong Sze Wai
5 (2)
This SuperZig indicator is special design for some trader trade with  ZigZag  and  Fibonacci . ( !!! NEW !!! +++ Support and Resistance +++ ) It will draw least two Fibonacci automatically in your chart period. Alerts when Created/Touced the Support/Resistance Box, it will send phone push/email notification to you at the same time. ZigZag + Fibo + BreakOutLine + SupportResistance = SuperZig !!! Input Parameter: " Show ZigZag " ::  Show ZigZag indicator with your own style ; " Show BreakOut
-   Real price is 70$   - 50% Discount ( It is 35$ now ) Contact me for instruction, any questions! Introduction A flag can be used as an entry pattern for the continuation of an established trend. The formation usually occurs after a strong trending move. The pattern usually forms at the midpoint of a full swing and shows the start of moving. Bullish flags can form after an uptrend, bearish flags can form after a downtrend. Flag Pattern Scanner Indicator It is usually difficult for a trade
Prosecution
Andriy Sydoruk
Prosecution is a Forex arrow indicator that tracks the market trend, ignoring sharp market fluctuations and noise around the average price. The indicator is created on the basis of a special algorithm, and based on the developed algorithm, signals are created that allow you to track the trend and see its beginning and end, especially when several timeframes are combined to refine the signal. The arrows show the direction of the deal, and are colored accordingly, which can be seen in the screensh
Market Chopper Indicator - is the manual system for market scalping. Indicator uses most accurate points to enter, when current trend has lost it's power and new one starts. Indicator shows : Enter points(buy/sell arrows), Exit points(Stoploss/Takeprofit arrows). Indicator makes market analysis and adapts to any market, any timeframe showing most relevant strategy for exact conditions. Main Indicator's Features Signals are NOT repaint, late or disappear; Every signal comes at the open of new bar
This indicator XRX Master indicator.Indicator displays trend movement. Indicator helps to buy and sell. Features FiltPer- displays indicator period. deviation - displaus indicator deviation. deviation2 - displaus indicator deviation 2. HL_period - displaus indicator Highest and Lowest period. HL_period2 - displaus indicator Highest 2 and Lowest 2 period. How to understand the status: If the trend color arrow is green, trend is up. I f the trend color arrow is red, trend is down. //////
This is based on Demark's TD Sequential and TD Combo set of indicators. It mostly has the TD Sequential features. It contains the Arrows Indicator showing Buy/Sell signals and the scanner dashboard. Both are for MT4 (Metatrader 4) Platform. Feature List: - Set TD Setup (9), Countdown (13) bars and In Between bars (4) - Set Countdown Risk Level Bars Below features are optional: - Merge TD Setup and Countdown for TD Combo - Check Setup Intersection - Price Flip before Starting Setup count -
Introduction This indicator detects volume spread patterns for buy and sell opportunity. The patterns include demand and supply patterns. You might use each pattern for trading. However, these patterns are best used to detect the demand zone (=accumulation area) and supply zone (=distribution area). Demand pattern indicates generally potential buying opportunity. Supply pattern indicates generally potential selling opportunity. These are the underlying patterns rather than direct price action. T
ABCD Harmonic Patterns
Mehmet Ozhan Hastaoglu
Thanks to this indicator, you can easily see the new ABCD harmonic patterns in the chart. If the two price action lengths are equal, the system will give you a signal when it reaches the specified level. You can set the limits as you wish. For example, You can get the signal of the price, which occurs in the Fibonaci 38.2 and 88.6 retracements, and then moves for the same length, at the level you specify. For example, it will alarm you when the price reaches 80% as a percentage. In vertic
The Sentiment Ratio indicator gauges current Market Sentiment between -100% and 100%, where lower than -40% is considered Bearish and higher than 40% is Bullish. The channel between the two is considered Neutral. The indicator has been a very useful filter tool for signals within a trading system. Example call function:  int SentimentIndicator(double triggerLevel)//Return sentiment if trigger level is activated {   double sentimentRatio=iCustom(NULL,0,"Sentiment Ratio",0,0,0);   if(sentimentRa
FREE
American Hunters
Mehmet Ozhan Hastaoglu
This indicator guides you like a hunter. Tacheprofit and StopLoss levels. See the difference in the experiment. Works in all periods. Works at all rates. You can win with this system. The crossing of the mean and the re-test were done according to the rule. You can see the transactions by moving backwards on the strategy test screen. The whole system is automatically calculated.
BeST_Gann Swing Oscillator is an MT4 indicator that is based on the corresponding work of Robert Krausz who introduced it in the book “ A.W.D Gann Treasure Discovered ” . The Gann Swing Oscillator is a range-bounding technical indicator that oscillates between +1 and -1 and thus it describes the market swings. Generally when the market is in an upswing, the Gann Swing Oscillator describes it as 2 higher highs with the value of +1 while after an upswing, the downswing is expected. Also the do
Indicador Forex "Zonas redondas clave" para MT4 El indicador "Zonas redondas clave" debe tener un indicador auxiliar para los operadores que toman en consideración el soporte/resistencia El precio respeta los niveles redondos de 1000 y 500: el precio se recupera muy a menudo. Los niveles principales 1000 también tienen fuertes zonas de soporte/resistencia (100 puntos en cada lado) a su alrededor. También los niveles de ronda 1000 y 500 son buenos para colocar Take Profits (frente al nivel de
EA Atom
Renat Garaev
5 (2)
EA Atom es un asesor experto con un algoritmo comercial único. El EA trabaja sobre el desglose de los niveles altos o bajos del día anterior Las estrategias exitosas y probadas se integran en el algoritmo del asesor, lo que le permite obtener ganancias en la fijación de precios de los activos con todas las sutilezas del análisis técnico e informático. ¡Contácteme inmediatamente después de la compra para recibir instrucciones, así como acceso a un chat privado de Telegram! Los ajustes están disp
The work of the Stable Pulse bot is displayed in the form of several key mmoments, which can be seen in the screenshots. This development is a scalping system. You can download and test the bot for free this way by yourself making sure of its capabilities. The bot can be tested on different currency pairs and different periods. The main thing is to set the tester settings as shown in the screenshot, for correct testing. You need to trade on timeframes M1-M15. Expert Advisor is designed to trade
To get access to MT5 version please click   here . This is the exact conversion from TradingView: QQE MT4 Glaz-modified by JustUncleL This is a light-load processing and non-repaint indicator. All input options are available. This is not a multi time frame indicator. Buffers are available for processing in EAs. You can message in private chat for further changes you need.
PDP indicator is used for: defining price probability distributions. This allows for a detailed representation of the channel and its borders and forecast the probability of a price appearing at each segment of its fluctuations; defining the channel change moment. Operation principles and features PDP analyzes a quote history on lower timeframes and calculates a price probability distribution on higher ones. Forecast algorithms allow the indicator to calculate probability distributions and m
Este indicador anticipa reversiones de precios analizando la presión alcista y bajista en el mercado. La presión de compra es la suma de todas las barras de acumulación durante un determinado número de días, multiplicada por el volumen. La presión de venta es la suma de toda la distribución sobre el mismo número de barras, multiplicada por el volumen. [ Guía de instalación | Guía de actualización | Solución de problemas | FAQ | Todos los productos ] La relación del indicador le da una medida de
Please read the comment section for more introduction about indicator. ( i cant put all lines in here their is limit ) Entry conditions       ----------------                                                       Scalping  - Long = Green over Red, Short = Red over Green             Active - Long = Green over Red & Yellow lines                                  Short = Red over Green & Yellow lines                            Moderate - Long = Green over Red, Yellow, & 50 lines                    
The indicator automatically sets trendlines on the really important points directly on the chart. Timeframe, color and style of the lines can be adjusted. Notification of a breakout above or below the line via a smartphone is possible. Input Parameters TimeFrame : Choose timeframe AppliedPrice : Choose close , open, high, low, median, typical or weighted price Formation : Choose swing, Shoulder head shoulder or long term formation Alerts : true = alert is on SendEmail : Send message to email a
PowerXXX
Marco Fornero Monia
PowerXXX measures the power of the current candlestick and displays it in numerical format and colors. The indicator can cover multiple timeframes and can be placed on the main chart or on the charts of the underlying indicators. The number of timeframes is selectable, as well as the color levels according to the power expressed. In the latest version, the power can be expressed as a function of the opening of the candle itself or as a function of the opening of the total candles before. There
Ska ZigZag BuySell
NKATEKO VUKOSI LEROY MASANGO
Ska ZigZag BuySell indicator determines the overbought and oversold regions within a trend. The indicator determines the overbought region by the candlestick high and the oversold region by the candlestick low. This indicator only gives signals with arrow and audible alerts each and every time when a new candlestick appear. To utilize the full strategy i recommend using "Ska ZigZag BuySell" together with "Ska ZigZag Line". The Ska ZigZag Line indicator is available for free. NOTE: Indicator is h
Cloud Power
Andriy Sydoruk
Implementation of indication of trend movement with moments for potential stops in the Cloud Power indicator. The transition to the shadow warns of a possible reversal. The entry of the price inside the shadow speaks of a flat movement. The indicator tracks the market trend with unmatched reliability, ignoring sharp market fluctuations and noise around the average price. Simple, visual and efficient use. The indicator does not redraw and does not lag. It can be easily used as an independent
Adaptive SSA
Jean Francois Le Bas
SSA stands for ' Singular Spectrum Analysis '. It combines elements of classical time series decomposition, statistics, multivariate geometry, dynamical systems and signal processing. SSA decomposes time series into a sum of components (ETs), with each component representing a lower smoothing, using several SVD ( Singular Value Decompositions ). It is a powerful filtering process used in many fields of research (climatology, biomedical, aerospace, etc), where high quality forecasting and smoo
El Indicador de Cuadrados de Gann es una herramienta poderosa de análisis de mercado basada en el artículo "Fórmula Matemática para Predicciones de Mercado" escrito por W.D. Gann, que se basa en conceptos matemáticos para el análisis. Incorpora elementos de las técnicas de Gann relacionadas con los cuadrados de 144, 90 y 52, así como el cuadrado de 9. Además, incluye el método del sobre cómo combinar el cuadrado de 9 con canales y patrones de estrellas. Manual del Usuario y Modo de Uso: Antes de
Trend Sim
Ivan Simonika
This is a professional Trend Sim indicator. The intelligent algorithm of the Trend Sim indicator accurately detects the trend, filters out market noise and generates input signals and exit levels. Functions with advanced statistical calculation rules improve the overall performance of this indicator. The indicator displays signals in a simple and accessible form in the form of arrows (when to buy and when to sell). Knowing the entry point of each of the currencies is very important for every
This dynamic indicator allows you to measure retracements of price between any two points in either direction. It displays the price points, percentages and also displays the extension levels. User may Modify and Add addition levels and extensions." User may also Add multiple Fibonacci indicators on the chart and change their colors,   style and sizes. Can be used on any timeframe. This is the only Fibonacci Tool you'll need to measure and trade on Structure. MT5 Version Available as we
Los compradores de este producto también adquieren
Atomic Analyst
Issam Kassas
5 (2)
En primer lugar, vale la pena enfatizar que este Indicador de Trading no repinta, no redibuja y no se retrasa, lo que lo hace ideal tanto para el trading manual como para el automatizado. Manual del usuario: configuraciones, entradas y estrategia. El Analista Atómico es un Indicador de Acción del Precio PA que utiliza la fuerza y el impulso del precio para encontrar una mejor ventaja en el mercado. Equipado con filtros avanzados que ayudan a eliminar ruidos y señales falsas, y aumentan el poten
TPSpro RFI Levels
Roman Podpora
4.8 (20)
反转第一脉冲水平 (RFI)     指示     俄羅斯     -        ESP   Recomendamos utilizar con   el indicador -   TPSpro 趋势专业版 -   MT5版本 Un elemento clave importante en el comercio son las zonas o niveles a partir de los cuales se toman decisiones para comprar o vender un instrumento comercial. A pesar de los intentos de los grandes actores de ocultar su presencia en el mercado, inevitablemente dejan rastros. Nuestra tarea era aprender a encontrar estos rastros e interpretarlos correctamente. Funciones principales:
¡Actualmente 20% OFF ! ¡La mejor solución para cualquier novato o trader experto! Este software funciona con 28 pares de divisas. Se basa en 2 de nuestros principales indicadores (Advanced Currency Strength 28 y Advanced Currency Impulse). Proporciona una gran visión general de todo el mercado de divisas. Muestra los valores de Advanced Currency Strength, la velocidad de movimiento de las divisas y las señales para 28 pares de divisas en todos los (9) marcos temporales. Imagine cómo mejorar
Bomb Bank Signal
Igor Pereira Calil
Señal de Bomb Bank: su indicador de confianza en MetaTrader 4 Bomb Bank Signal es un poderoso indicador para MetaTrader 4, diseñado para identificar las tendencias más relevantes en el mercado financiero. Si buscas una herramienta que anticipe los movimientos con precisión, el Bomb Bank es el aliado que necesitas. Cómo funciona: Este indicador combina tres métodos distintos (análisis de volumen, cierre de velas y tendencia simétrica) para detectar y señalar oportunidades de compra y venta
¡LEA LA INFORMACIÓN A CONTINUACIÓN ANTES DE COMPRAR EL PRODUCTO! ¡Apollo Pips PLUS SP es un producto único! ¡ES PARA AQUELLOS QUE QUIEREN OBTENER MI NUEVO INDICADOR "APOLLO PIPS" MÁS BONO "SUPER PACK" CON ACCESO A TODOS MIS INDICADORES COMERCIALES! Al comprar el producto Apollo Pips PLUS SP, en realidad está comprando una versión absolutamente nueva de mi indicador Apollo Pips. Esta versión del indicador tiene un algoritmo mejorado y un parámetro fácil de usar que le brinda la oportunidad de uti
Enigmera
Ivan Stefanov
5 (2)
ENIGMERA: El núcleo del mercado https://www.enigmera.com Introducción Este indicador y sistema de negociación es un enfoque extraordinario de los mercados financieros. ENIGMERA utiliza los ciclos fractales para calcular con precisión los niveles de soporte y resistencia. Muestra la auténtica fase de acumulación y proporciona dirección y objetivos.  Un sistema que funciona tanto si estamos en una tendencia como en una corrección.  ¿Cómo funciona? ENIGMERA consta de tres líneas: la línea de s
Cycle Sniper
Elmira Memish
4.38 (32)
NEW YEAR SALE PRICE FOR LIMITED TIME!!! Please contact us after your purchase and we will send you the complimentary indicators to complete the system Cycle Sniper is not a holy grail but when you use it in a system which is explained in the videos, you will feel the difference. If you are not willing to focus on the charts designed with Cycle Sniper and other free tools we provide, we recommend not buying this indicator. We recommend watching the videos about the indiactor and system before pu
Gold Channel is a volatility-based indicator, developed with a specific timing algorithm for the XAUUSD pair, which consists of finding possible corrections in the market. This indicator shows two outer lines, an inner line (retracement line) and an arrow sign, where the theory of the channel is to help identify overbought and oversold conditions in the market. The market price will generally fall between the boundaries of the channel. If prices touch or move outside the channel it is a tra
Quantum Currency Matrix Indicator
QUANTUM TRADING SOFTWARE LIMITED
Of all the four principle capital markets, the world of foreign exchange trading is the most complex and most difficult to master, unless of course you have the right tools! The reason for this complexity is not hard to understand. First currencies are traded in pairs. Each position is a judgment of the forces driving two independent markets. If the GBP/USD for example is bullish, is this being driven by strength in the pound, or weakness in the US dollar. Imagine if we had to do the same thing
ECM Elite Channel is a volatility-based indicator, developed with a specific time algorithm, which consists of finding possible corrections in the market. This indicator shows two outer lines, an inner line (retracement line) and an arrow sign, where the channel theory is to help identify overbought and oversold conditions in the market. The market price will generally fall between the boundaries of the channel. If prices touch or move outside the channel, it's a trading opportunity. The
NAM Order Blocks
NAM TECH GROUP, CORP.
5 (1)
Indicador de detección de Order Blocks multitimeframe para MT4. Características - Panel de control totalmente personalizable, proporciona una interacción completa. - Oculta y muestra el panel de control donde quieras. - Detecta OB en múltiples marcos de tiempo. - Permite seleccionar la cantidad de OB para mostrar. - Interfaz de usuario de diferentes OBs. - Diferentes filtros de OBs (regulares, rejection y sin capitalizar). - Alerta de proximidad de OBs. - Líneas ADR High y Low. - Servicio de not
MT My Way
Issara Seeboonrueang
Best strategy,  Easy trade ,  Support of version update in the future MT My Way:  For new traders with no experience It is a very simple trade. Open the order when there is signal and close the order when there is exit or found the next opposite signal. You can set Stop Loss at the arrow and set the distance at Arrow Gap. For experienced traders, It will be very easy to trade. indicator for trade by yourself TRADE: Forex  TIME FRAME:  All Time Frame (Not M1) SYMBOL PAIR: All Sy
How to use Pair Trading Station Pair Trading Station is recommended for H1 time frame and you can use it for any currency pairs. To generate buy and sell signal, follow few steps below to apply Pair Trading Station to your MetaTrader terminal. When you load Pair Trading Station on your chart, Pair Trading station will assess available historical data in your MetaTrader platforms for each currency pair. On your chart, the amount of historical data available will be displayed for each currency pai
Full STO
Roman Smoroda
Indicador STO completo (incluye todas las versiones de tres indicadores STO: Premium, Gold, Silver) - STABLE TRADE OPTION está diseñado para el comercio automático de opciones binarias.  ¡¡¡¡¡LEA CUIDADOSAMENTE!!!!! IMPORTANTE En un terminal cree dos plantillas con diferentes vencimientos, una plantilla para las 18:01, 18:02 con vencimientos de 1 a 15 minutos y una plantilla para las 22:00 con vencimientos de 10 a 20 minutos. Winrate: 71% en los últimos 5 años Gestión del dinero: 0,3% d
Introduction to X3 Chart Pattern Scanner X3 Cherart Pattern Scanner is the non-repainting and non-lagging indicator detecting X3 chart patterns including Harmonic pattern, Elliott Wave pattern, X3 patterns, and Japanese Candlestick patterns. Historical patterns match with signal patterns. Hence, you can readily develop the solid trading strategy in your chart. More importantly, this superb pattern scanner can detect the optimal pattern of its kind. In addition, you can switch on and off individu
Connect Indicator
Sukunthakan Ngernbamrung
Connect Indicator is a tool used for connecting indicators between the MQL market and MT4. The connected indicators are made by our group and can be used for other applications, such as sending messages to the Line application or Telegram application. If you have any questions, please don't hesitate to ask us to receive support. Function and indicator buffer Buffer one is the high price of the previous candle. Buffer two is the high price of the previous candle. Usage To connect indicators to fu
TrendMaestro
Stefano Frisetti
5 (3)
note: this indicator is for METATRADER4, if you want the version for METATRADER5 this is the link:  https://www.mql5.com/it/market/product/108106 TRENDMAESTRO ver 2.4 TRENDMAESTRO recognizes a new TREND in the bud, he never makes mistakes. The certainty of identifying a new TREND is priceless. DESCRIPTION TRENDMAESTRO identifies a new TREND in the bud, this indicator examines the volatility, volumes and momentum to identify the moment in which there is an explosion of one or more of these data a
This product is based on the methodologies of Gann, his follower Don E. Hall. The Indicator builds a working view grid, which is used to analyze graphics. The Pyrapoint tool, developed by Don Hall, is a grid based on the Pythagorean cube. In his calculations he uses the Gann Square 9 methodology and the relationship between Price and Time. This tool is used to predict changes in trend and overall market actions. More information about the method   HERE
Dragon Multi Indicator MT4
Mansour Babasafary
5 (4)
3 Indicators in 1 indicator Strategy based on price action Made specifically for the best forex currency pairs Can be used in the best time frame of the market at a very reasonable price This indicator is basically 3 different indicatos . But we have combined these 3 indicators in 1 indicator so that you can use 3 indicators at the lowest price. All three strategies are based on price action. But based on different trends. Long term, medium term and short term Attributes : No repaintin
Max Paynex
Abdulkarim Karazon
Max Payne es un indicador de señal de reversión/tendencia que proporciona señales en forma de flecha, este indicador da su señal al cerrar la misma barra, este indicador puede aparecer varias veces en el gráfico con diferentes períodos para obtener confirmación doble/triple de las señales. El indicador es altamente ajustable para adaptarse a cualquier estilo comercial y nunca se repinta ni se vuelve a pintar. Obtendrá el sistema completo en capturas de pantalla después de la compra junto con la
JULY OFFER 80% OFF next price for unlimited version will be 17000$. This is the only time you can get this institutional and professional indicator at this price for unlimited version. Don't dare to miss this. The tool I am about to introduce to you you can't compare it with other tools due to its strategy and accuracy level in predicting the next price directional movement . This tool is designed for serious traders who have decided to make a difference through trading. Be the next person to wi
4.8(25 reviews)   Rating on   gogojungle 【 TrendLinePro2 】 Indicador de ayuda para el trading de líneas MT4 (MetaTrader 4). Es una especificación muy básica que se recomienda para todos, suponiendo que sea fiel a la teoría de Dow. Reconoce tendencias basadas en la teoría de Dow y, además, dibuja automáticamente líneas de soporte, resistencia y tendencia en tiempo real. La precisión es muy alta. 【 Comprobación del comportamiento 】 En Youtube, se sube un video cada fin de semana para conf
Quantum Currency Array Indicator
QUANTUM TRADING SOFTWARE LIMITED
This indicator has been developed to identify and display these trends quickly and easily, allowing you to see instantly, those currency pairs which are trending, and those which are not – and in all timeframes, with just one click. The 28 currency pairs are displayed as a fan as they sweep from strong to weak and back again, and this is why we call it the ‘currency array’. All 28 pairs are arrayed before you, giving an instant visual description of those pairs that are trending strongly, those
El indicador " ZigZag on Trend " es un asistente para determinar la dirección del movimiento del precio, así como una calculadora de barras y pips. Consiste en un indicador de tendencia que monitorea la dirección del precio con una línea de tendencia presentada en forma de zigzag y un contador que calcula el número de barras pasadas en la dirección de la tendencia y el número de puntos en una escala vertical. (Los cálculos se realizan mediante la apertura de la barra) El indicador no se vuelve a
Indicator : RealValueIndicator Description : RealValueIndicator is a powerful tool designed specifically for trading on the EURUSD pair. This indicator analyzes all EUR and USD pairs, calculates their real currency strength values, and displays them as a single realistic value to give you a head start on price. This indicator will tell you moves before they happen if you use it right. RealValueIndicator allows you to get a quick and accurate overview of the EURUSD currency pair tops and bottoms,
SNR LEVEL INDICATOR Accurate Snr level indicator will only display Fresh Levels that are close to the Current Market Price. This indicator is very accurate in mapping Support & resistance levels. there is an alert feature when the price TOUCHES the SNR LEVEL, WHEN CLOSE CANDLE BREAK/REJECT SNR LEVEL. INDICATOR MARKING : - SUPPORT LEVEL = V SHAPE - RESISTANCE LEVEL = APEX LEVEL - GAP RESISTANCE & GAP SUPPORT = OPEN CLOSE CANDLE - SUPPORT BECAME RESISTANCE & RESISTANCE BECAME SUPPORT INDICATOR
Introduction to EFW Analytics EFW Analytics was designed to accomplish the statement "We trade because there are regularities in the financial market". EFW Analytics is a set of tools designed to maximize your trading performance by capturing the repeating fractal geometry, known as the fifth regularity in the financial market. The functionality of EFW Analytics consists of three parts. Firstly, Equilibrium Fractal Wave Index is an exploratory tool to support your trading logic to choose which r
Por supuesto, aquí tienes la traducción al español: Presentamos el Indicador de Astronomía para MT4: Tu Compañero Celestial Definitivo en el Trading ¿Estás listo para elevar tu experiencia de trading a alturas celestiales? No busques más allá de nuestro revolucionario Indicador de Astronomía para MT4. Esta innovadora herramienta trasciende los indicadores de trading tradicionales, aprovechando el poder de algoritmos complejos para proporcionarte una visión astronómica sin igual y cálculos de pre
Ultimate Sniper Dashboard
Hispraise Chinedum Abraham
4.76 (17)
¡Descuento de 299 $! ¡Los precios pueden aumentar en el futuro! ¡Lea la descripción a continuación! Mejor Sistema de Entrada para Ultimate Sniper Dashboard: ULTIMATE DYNAMIC LEVELS. (Por favor, compruebe mis productos) El Ultimate Sniper Dashboard SÓLO funciona en mercados en vivo debido a los límites de prueba multidivisa de MT4. ¡Presentamos el Ultimate Sniper Dashboard! Nuestro mejor que contiene tanto HA-Sniper, MA-Sniper. y muchos modos especiales. ¡El Ultimate Sniper Dashboard es
This indicator is based on the mathematics of the great trader W.D. Ganna. With its help, you can easily find strong levels by analyzing swings to find the optimal entry point. The indicator works on all instruments and all timeframes. The indicator is fully manual and has control buttons. All you need to do is press the NEW button, a segment will appear, which you can place on any movement, swing or even 1 candle that you want to analyze. By placing the segment, press the OK button. A grid (th
Otros productos de este autor
[跟单系统] T he most friendly Copier interactive interface, the most abundant easy-to-use functions, and the best Copy solution.    EASY   : Easy to use, load and select the Master or SLAVE to use easily  FAST:   Quickly copy orders, algorithmic optimal follow-up mechanism, priority calculation of new signals, priority queue processing received special signals Multiple:   1. Support multiple signals to be sent at the same time, multiple accounts can select multiple accounts to copy at the same time
[跟单系统] T he most friendly Copier interactive interface, the most abundant easy-to-use functions, and the best Copy solution.    EASY   : Easy to use, load and select the Master or SLAVE to use easily FAST:   Quickly copy orders, algorithmic optimal follow-up mechanism, priority calculation of new signals, priority queue processing received special signals Multiple:   1. Support multiple signals to be sent at the same time, multiple accounts can select multiple accounts to copy at the same time 2
Comercio dinámico: 1.pp pivote 2. r1 r2 r3, s1 s2 s3 Necessary for traders: tools and indicators Waves automatically calculate indicators, channel trend trading Perfect trend-wave automatic calculation channel calculation , MT4 Perfect trend-wave automatic calculation channel calculation , MT5 Local Trading copying Easy And Fast Copy , MT4 Easy And Fast Copy , MT5 Local Trading copying For DEMO Easy And Fast Copy , MT4 DEMO Easy And Fast Copy , MT5 DEMO Cooperación QQ: 556024 " Wechat
FREE
Necessary for traders: tools and indicators Waves automatically calculate indicators, channel trend trading Perfect trend-wave automatic calculation channel calculation , MT4 Perfect trend-wave automatic calculation channel calculation , MT5 Local Trading copying Easy And Fast Copy , MT4 Easy And Fast Copy , MT5 Local Trading copying For DEMO Easy And Fast Copy , MT4 DEMO Easy And Fast Copy , MT5 DEMO 砖图 Renko PRO->>>   The display of the brick map on the main map. The Renko chart ideal
FREE
K Trade Assistant MT5
Kaijun Wang
4.22 (9)
El       mejor socio para los comerciantes!       Asistente comercial: Esta es una ayuda comercial muy rica en funciones. El desarrollo no es fácil, por favor apoye Pro Haga clic para saltar Asistente comercial K Pro MT5 Instrucciones de operación del asistente comercial Configuración de uso básico Básico: Admite interruptor de selección de idioma (actualmente admite chino e inglés)           reconocimiento automático de idioma Apoyar la unión de       tecla de acceso rápido par
FREE
Necessary for traders: tools and indicators Waves automatically calculate indicators, channel trend trading Perfect trend-wave automatic calculation channel calculation , MT4 Perfect trend-wave automatic calculation channel calculation , MT5 Local Trading copying Easy And Fast Copy , MT4 Easy And Fast Copy , MT5 Local Trading copying For DEMO Easy And Fast Copy , MT4 DEMO Easy And Fast Copy , MT5 DEMO MACD se denomina media móvil de similitud y diferencia, que se desarrolla a partir de la media
FREE
Pivot Trading 4
Kaijun Wang
5 (5)
Comercio dinámico: 1.pp pivote 2. r1 r2 r3, s1 s2 s3 Necessary for traders: tools and indicators Waves automatically calculate indicators, channel trend trading Perfect trend-wave automatic calculation channel calculation , MT4 Perfect trend-wave automatic calculation channel calculation , MT5 Local Trading copying Easy And Fast Copy , MT4 Easy And Fast Copy , MT5 Local Trading copying For DEMO Easy And Fast Copy , MT4 DEMO Easy And Fast Copy , MT5 DEMO Recomendamos encarecidamente indica
FREE
Necessary for traders: tools and indicators Waves automatically calculate indicators, channel trend trading Perfect trend-wave automatic calculation channel calculation , MT4 Perfect trend-wave automatic calculation channel calculation , MT5 Local Trading copying Easy And Fast Copy , MT4 Easy And Fast Copy , MT5 Local Trading copying For DEMO Easy And Fast Copy , MT4 DEMO Easy And Fast Copy , MT5 DEMO Bandas de Bollinger avanzadas: 1. El riel de Bollinger cambiará de color con la dirección "
FREE
Fit Channel MT5
Kaijun Wang
3 (2)
The market price usually falls between the borders of the channel    .   If the price is out of range , it is a trading signal or trading opportunity  . Basically , Fit Channel can be used to help determine overbought and oversold conditions in the market. When the market price is close to the upper limit, the market is considered overbought (sell zone). Conversely, when the market price is close to the bottom range, the market is considered oversold (buy zone). However, the research can
KDJ Index For MT5
Kaijun Wang
4.33 (6)
Necessary for traders: tools and indicators Waves automatically calculate indicators, channel trend trading Perfect trend-wave automatic calculation channel calculation , MT4 Perfect trend-wave automatic calculation channel calculation , MT5 Local Trading copying Easy And Fast Copy , MT4 Easy And Fast Copy , MT5 Local Trading copying For DEMO Easy And Fast Copy , MT4 DEMO Easy And Fast Copy , MT5 DEMO "Cooperative QQ:556024"  "Cooperation wechat:556024"  "Cooperative email:556024@qq.com" Strong
FREE
Necessary for traders: tools and indicators Waves automatically calculate indicators, channel trend trading Perfect trend-wave automatic calculation channel calculation , MT4 Perfect trend-wave automatic calculation channel calculation , MT5 Local Trading copying Easy And Fast Copy , MT4 Easy And Fast Copy , MT5 Local Trading copying For DEMO Easy And Fast Copy , MT4 DEMO Easy And Fast Copy , MT5 DEMO 砖图Renko PRO->>> The display of the brick map on the main map. The Renko chart ideally remo
FREE
Necessary for traders: tools and indicators Waves automatically calculate indicators, channel trend trading Perfect trend-wave automatic calculation channel calculation , MT4 Perfect trend-wave automatic calculation channel calculation , MT5 Local Trading copying Easy And Fast Copy , MT4 Easy And Fast Copy , MT5 Local Trading copying For DEMO Easy And Fast Copy , MT4 DEMO Easy And Fast Copy , MT5 DEMO Bandas de Bollinger avanzadas: 1. El riel de Bollinger cambiará de color con la dirección "
FREE
K Trade Assistant
Kaijun Wang
4.56 (9)
¡   El mejor socio para los comerciantes!     Asistente comercial: Esta es una ayuda comercial muy rica en funciones. El desarrollo no es fácil, por favor apoye Pro Haga clic para saltar Asistente comercial K Pro     Instrucciones de operación del asistente comercial Configuración de uso básico Básico: Admite interruptor de selección de idioma (actualmente admite chino e inglés)       para identificar automáticamente el idioma Apoyar la unión de       tecla de acces
FREE
¡Los indicadores son para seguidores de tendencias! Un sistema de comercio construido por tres promedios móviles Opere con la tendencia y deje correr las ganancias. Necessary for traders: tools and indicators Waves automatically calculate indicators, channel trend trading Perfect trend-wave automatic calculation channel calculation , MT4 Perfect trend-wave automatic calculation channel calculation , MT5 Local Trading copying Easy And Fast Copy , MT4 Easy And Fast Copy , MT5 Local Trading copy
FREE
KDJ Index 4
Kaijun Wang
5 (2)
Necessary for traders: tools and indicators Waves automatically calculate indicators, channel trend trading Perfect trend-wave automatic calculation channel calculation , MT4 Perfect trend-wave automatic calculation channel calculation , MT5 Local Trading copying Easy And Fast Copy , MT4 Easy And Fast Copy , MT5 Local Trading copying For DEMO Easy And Fast Copy , MT4 DEMO Easy And Fast Copy , MT5 DEMO "Cooperativa QQ: 556024"  "Cooperación wechat: 556024"  "Correo electrónico cooperativo: 55602
FREE
KTrade Fibo For MT5
Kaijun Wang
4.67 (3)
Necessary for traders: tools and indicators Waves automatically calculate indicators, channel trend trading Perfect trend-wave automatic calculation channel calculation , MT4 Perfect trend-wave automatic calculation channel calculation , MT5 Local Trading copying Easy And Fast Copy , MT4 Easy And Fast Copy , MT5 Local Trading copying For DEMO Easy And Fast Copy , MT4 DEMO Easy And Fast Copy , MT5 DEMO Fibo: from KTrade 1. Automatically calculate and analyze the band. -> Get the desired band 2.
FREE
¡Los indicadores son para seguidores de tendencias! Un sistema de comercio construido por tres promedios móviles Opere con la tendencia y deje correr las ganancias. Necessary for traders: tools and indicators Waves automatically calculate indicators, channel trend trading Perfect trend-wave automatic calculation channel calculation , MT4 Perfect trend-wave automatic calculation channel calculation , MT5 Local Trading copying Easy And Fast Copy , MT4 Easy And Fast Copy , MT5 Local Trading copy
FREE
Necessary for traders: tools and indicators Waves automatically calculate indicators, channel trend trading Perfect trend-wave automatic calculation channel calculation , MT4 Perfect trend-wave automatic calculation channel calculation , MT5 Local Trading copying Easy And Fast Copy , MT4 Easy And Fast Copy , MT5 Local Trading copying For DEMO Easy And Fast Copy , MT4 DEMO Easy And Fast Copy , MT5 DEMO The homeopathic indicator is also called the CCI indicator. The CCI indicator was propos
FREE
Necessary for traders: tools and indicators Waves automatically calculate indicators, channel trend trading Perfect trend-wave automatic calculation channel calculation , MT4 Perfect trend-wave automatic calculation channel calculation , MT5 Local Trading copying Easy And Fast Copy , MT4 Easy And Fast Copy , MT5 Local Trading copying For DEMO Easy And Fast Copy , MT4 DEMO Easy And Fast Copy , MT5 DEMO Can set the cycle for other varieties of K line graph covered this window, fluctuations obse
FREE
Necessary for traders: tools and indicators Waves automatically calculate indicators, channel trend trading Perfect trend-wave automatic calculation channel calculation , MT4 Perfect trend-wave automatic calculation channel calculation , MT5 Local Trading copying Easy And Fast Copy , MT4 Easy And Fast Copy , MT5 Local Trading copying For DEMO Easy And Fast Copy , MT4 DEMO Easy And Fast Copy , MT5 DEMO MACD is called Convergence and Divergence Moving Average, which is developed from the double e
FREE
Fit Channel
Kaijun Wang
5 (2)
The market price usually falls between the borders of the channel. If the price is out of range, it is a trading signal or trading opportunity. Basically, Fit Channel can be used to help determine overbought and oversold conditions in the market. When the market price is close to the upper limit, the market is considered overbought (sell zone). Conversely, when the market price is close to the bottom range, the market is considered oversold (buy zone). However, the research can be used to
XM Channel
Kaijun Wang
4 (1)
The market price usually falls between the borders of the channel . If the price is out of range, it is a trading signal or trading opportunity . Basically, Fit Channel can be used to help determine overbought and oversold conditions in the market. When the market price is close to the upper limit, the market is considered overbought (sell zone). Conversely, when the market price is close to the bottom range, the market is considered oversold (buy zone). However, the research can be used
¡El mejor socio para los comerciantes!       Instrucciones de operación del asistente comercial Configuración de uso básico Básico: Admite interruptor de selección de idioma (actualmente admite chino e inglés)           reconocimiento automático de idioma Apoyar la unión de       tecla de acceso rápido para abrir y cerrar posiciones       , utilice las teclas de acceso directo para abrir y cerrar posiciones rápidamente...       Teclas de atajo para cerrar posiciones. El desblo
Donchian通道(唐奇安通道指标)是用于交易突破的最古老、最简单的技术指标之一。   一般来说,唐奇安通道的宽度越宽,市场波动就越大,而唐奇安通道越窄,市场波动性也就越小 。此外,价格走势可以穿过布林带,但你看不到唐奇安通道的这种特征,因为其波段正在测量特定时期的最高价和最低价。 交易实用必备工具指标 波浪自动计算指标,通道趋势交易 完美的趋势-波浪自动计算通道计算 , MT4版本 完美的趋势-波浪自动计算通道计算 , MT5版本 本地跟单复制交易 Easy And Fast Copy , MT4版本 Easy And Fast Copy , MT5版本 本地跟单复制交易 模拟试用 Easy And Fast Copy , MT4 模拟账号运行 Easy And Fast Copy , MT5 模拟账号运行 唐奇安通道指标计算: 唐奇安上阻力线 - 由过去N天的当日最高价的最大值形成。 唐奇安下支撑线 - 由过去N天的当日最低价的最小值形成。 中心线 - (上线 + 下线)/ 2   唐奇安通道信号   唐奇安通道常用作突破指标。它提供了两种主要类型的突破信号,一个是上阻力线或下支
FREE
Necessary for traders: tools and indicators Waves automatically calculate indicators, channel trend trading Perfect trend-wave automatic calculation channel calculation , MT4 Perfect trend-wave automatic calculation channel calculation , MT5 Local Trading copying Easy And Fast Copy , MT4 Easy And Fast Copy , MT5 Local Trading copying For DEMO Easy And Fast Copy , MT4 DEMO Easy And Fast Copy , MT5 DEMO The homeopathic indicator is also called the CCI indicator. The CCI indicator was propos
FREE
Necessary for traders: tools and indicators Waves automatically calculate indicators, channel trend trading Perfect trend-wave automatic calculation channel calculation , MT4 Perfect trend-wave automatic calculation channel calculation , MT5 Local Trading copying Easy And Fast Copy , MT4 Easy And Fast Copy , MT5 Local Trading copying For DEMO Easy And Fast Copy , MT4 DEMO Easy And Fast Copy , MT5 DEMO Strongly recommend trend indicators,   automatic calculation of wave standard   and   MT5 ve
FREE
Donchian通道(唐奇安通道指标)是用于交易突破的最古老、最简单的技术指标之一。 一般来说,唐奇安通道的宽度越宽,市场波动就越大,而唐奇安通道越窄,市场波动性也就越小 。此外,价格走势可以穿过布林带,但你看不到唐奇安通道的这种特征,因为其波段正在测量特定时期的最高价和最低价。 交易实用必备工具指标 波浪自动计算指标,通道趋势交易 完美的趋势-波浪自动计算通道计算 , MT4版本 完美的趋势-波浪自动计算通道计算 , MT5版本 本地跟单复制交易 Easy And Fast Copy , MT4版本 Easy And Fast Copy , MT5版本 本地跟单复制交易 模拟试用 Easy And Fast Copy , MT4 模拟账号运行 Easy And Fast Copy , MT5 模拟账号运行 唐奇安通道指标计算: 唐奇安上阻力线 - 由过去N天的当日最高价的最大值形成。 唐奇安下支撑线 - 由过去N天的当日最低价的最小值形成。 中心线 - (上线 + 下线)/ 2   唐奇安通道信号   唐奇安通道常用作突破指标。它提供了两种主要类型的突破信号,一个是上阻力线或下支撑线
FREE
Indicators are professional data statistics, position orders, historical order analysis->>>>>> <This version is in Chinese -> English version please move> Necessary for traders: tools and indicators Waves automatically calculate indicators, channel trend trading Perfect trend-wave automatic calculation channel calculation , MT4 Perfect trend-wave automatic calculation channel calculation , MT5 Local Trading copying Easy And Fast Copy , MT4 Easy And Fast Copy , MT5 Local Trading copying For DE
FREE
MACD divergence signals   MACD is called Convergence and Divergence Moving Average, which is developed from the double exponential moving average. The fast exponential moving average (EMA12) is subtracted from the slow exponential moving average (EMA26) to get the fast DIF, and then 2× (Express DIF-DIF's 9-day weighted moving average DEA) Get the MACD bar. The meaning of MACD is basically the same as the double moving average, that is, the dispersion and aggregation of the fast and slow moving a
Filtro:
elite luis
3331
elite luis 2023.03.04 09:25 
 

El usuario no ha dejado ningún comentario para su valoración

Kaijun Wang
138700
Respuesta del desarrollador Kaijun Wang 2023.03.04 09:37
q1: You can ignore this setting, I use legacy for internal testing trendline algorithm accuracy. q2. 2 and 3 are intervals of 10 seconds to set the time to switch varieties, and the sequence of varieties is the second parameter setting, separated by "|", the first parameter is the switch q3. Trend line and channel line touch alarm q4. Vibration frame touch reminder. q5. 31 refers to the spread, $5 refers to the margin required for trading 0.01 lot q6. pre-W refers to the black WAVE, M refers to the main trend band, S refers to the minimum unit structure, and the value represents the calculated average length.
Qilin
30
Qilin 2021.05.18 14:01 
 

Reviewing this at the moment. The indicator looks pretty cool and the developer is really helpful.

연나라
750
연나라 2021.04.15 14:46 
 

I rented this indicator for a month and then bought it today because I liked it so much. There was an mq5 error, but the programmer was really friendly. He did his best to solve the problem. His response is also very quick. I am getting a lot of help from this indicator. Best!

Kaijun Wang
138700
Respuesta del desarrollador Kaijun Wang 2021.04.15 14:58
谢谢!希望你的交易系统可以因此变得更完美
Hao Wu
636
Hao Wu 2021.03.04 07:31 
 

El usuario no ha dejado ningún comentario para su valoración

cnbluse
47
cnbluse 2020.12.21 05:28 
 

妈妈再也不担心我犯低级错误了。

Respuesta al comentario
Versión 7.10 2023.04.11
>>>>>>>
增加按钮隐藏
Versión 6.89 2023.03.07
>>>>>>>>>>>>>>>
Versión 6.88 2023.03.07
>>>>>>>>>
Versión 6.86 2023.03.06
>>>>>>>>>>>>>>>
Versión 6.85 2023.03.06
>>>>>>>>>>
Versión 6.83 2023.03.06
>>>>>>>>>>>>>>>>>
Versión 6.82 2023.03.05
>>>>>>>>>>>>
Versión 6.81 2023.03.05
>>>>>
增加动态组件的大小调整,和自适应大小
Versión 6.8 2023.03.04
>>>>>
1. Add widget control, you can delete various components on the screen, and you can load charts in a variety of ways
2. Increase the automatic switching of international trading styles and adapt to international trading habits
3. Increase the flicker control in the shock area, which can be set to off.
Versión 5.8 2023.02.19
>>>>>>
1. Optimize and update algorithm logic, optimize the details of judgment conditions
2. Increase the main trend wave display
Versión 3.3 2022.03.21
>>>>>>>>>>
Versión 3.2 2022.03.18
>>>>>
1.算法更新
2.纠错更新
Versión 3.1 2021.11.21
>>>>>>>>>>>
Versión 2.88 2021.06.19
>>>>>
1.更新第一次图表计算计算K限制,0为取消限制....
2.更新指标加载后,关闭指标后复原图表的各项设置
Versión 2.8 2021.04.15
>>>>>>>>>
Versión 2.6 2021.03.29
>>>>>
修复运行间隔时间过长空白拐点未计算
Versión 2.5 2020.12.28
>>>>>>>>
Versión 2.3 2020.12.28
>>>>>>>>>>>>
Versión 2.2 2020.12.27
>>>>>>>>>>>
Versión 2.1 2020.12.27
>>>>>>>>>增加风格自动设置为白底,可选择关闭
Versión 2.0 2020.12.19
>>>>>>>updata alert function...
Versión 1.201 2020.12.06
>>>>>>>算法优化,版本同MT5的1.20
Versión 1.20 2020.10.20
>>>>>>更新通道显示不友好
Versión 1.10 2020.10.10
->>>>更新了默认黑色背景下不友好的显示...