VolumeDeltaScanner
- Indicadores
- Stanislav Korotky
- Versión: 1.2
- Actualizado: 20 febrero 2021
- Activaciones: 5
VolumeDeltaScanner is a volume delta monitor for multiple (up to 10) time scopes. It works by online ticks or history ticks.
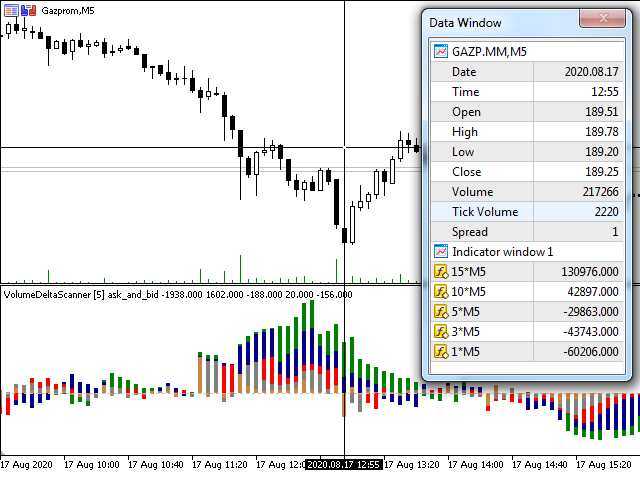
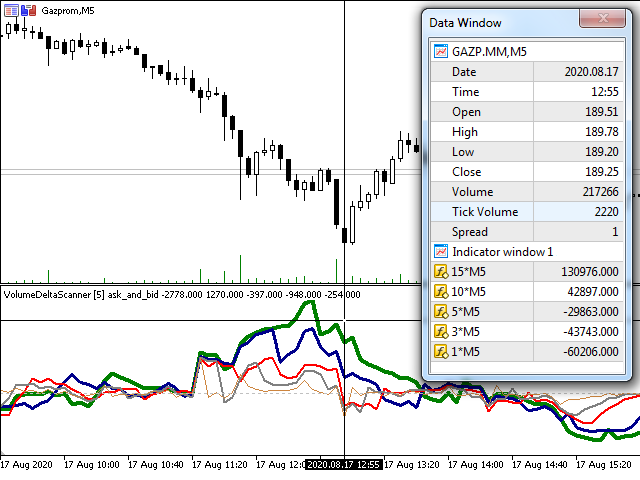
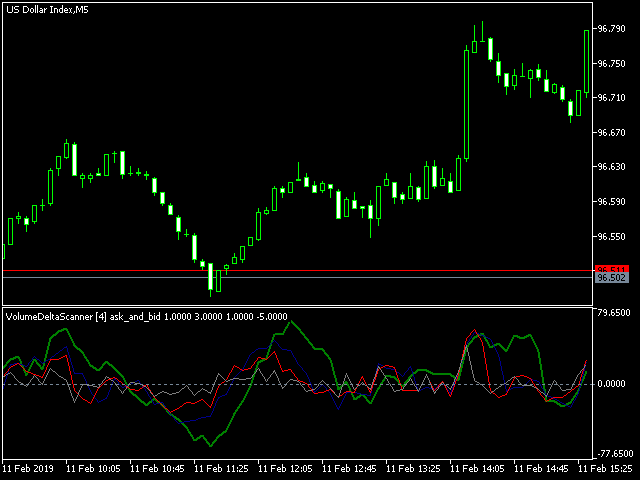
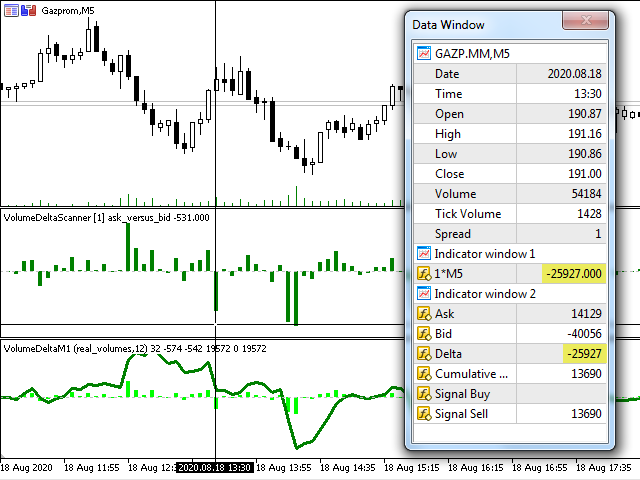
Indicator monitors tick volumes for buys and sells separately, and find their delta on every bar and larger scopes, then displays the volume deltas for all the scopes. Every scope is presented by its own buffer/line.
The smallest scope is the current timeframe. It's required. All other scopes should be multiples of it. For example, if placed on a M5 chart, it can calculate volume deltas for 1*M5, 3*M5, 5*M5, 10*M5, etc.
It works with real volumes if they are available, otherwise with tick volumes.
To use in the tester, please, make sure the real ticks mode is enabled.
Input parameters
- Scope 1 - Scope 10 — coefficients defining scope duration as a multiple of current timeframe;
- TickHistoryPreload — number of historical bars to populate with ticks on startup; the ticks are always processed in batches by day, so more bars can be calculated due to alignment to the start of the day; default 0 means a single last day is preloaded;
- Method — one of 2 methods of tick categorization for buy and sell: ask_versus_bid, or ask_and_bid; when set to ask_versus_bid, the volumes are considered for buy if Ask price increases, and considered for sell if Bid decreases; ask_and_bid analyses the changes in the sum of Ask and Bid;
- Visualization — display buffers as Lines, Histogram of Dots;
How to trade
- Find divergences in price and volume;
- While price is consolidated, spot which side (positive or negative) of volume deltas becomes prevailing;
- Use crossing lines of smaller and higher scopes in a similar way as "fast" and "slow" MA crossing;
