• Información general
  • Comentarios
  • Discusión (3)
  • Novedades

KT Renko Patterns MT5

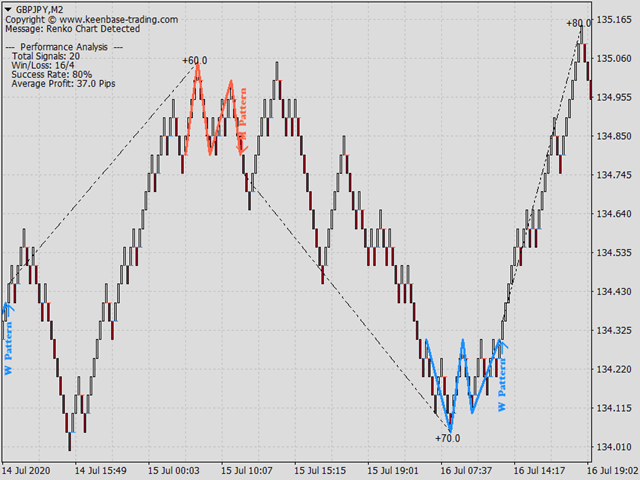
KT Renko Patterns analiza el gráfico Renko ladrillo por ladrillo para encontrar patrones gráficos populares que son ampliamente utilizados por los traders en diferentes mercados financieros.

En comparación con los gráficos basados en tiempo, los patrones son más fáciles de identificar en los gráficos Renko debido a su aspecto limpio y sin ruido.

KT Renko Patterns incluye múltiples patrones Renko, muchos de los cuales están explicados en detalle en el libro “Profitable Trading with Renko Charts” de Prashant Shah.

Un Asesor Experto 100% automatizado basado en el indicador KT Renko Patterns está disponible aquí - KT Renko Patterns EA.


Características

  • Opera hasta ocho patrones Renko claros y definidos, sin ambigüedad.
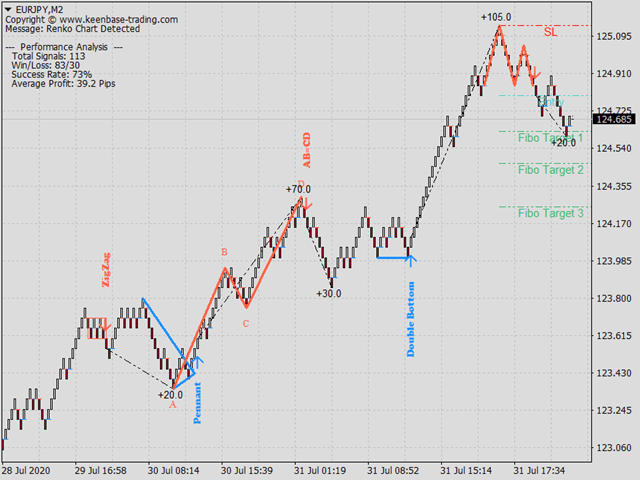
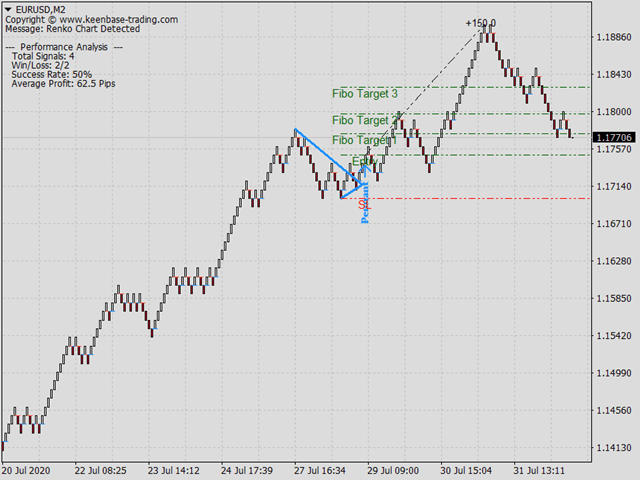
  • Para brindar total objetividad, se proporcionan niveles de Stop-loss y objetivos de Fibonacci con cada patrón.
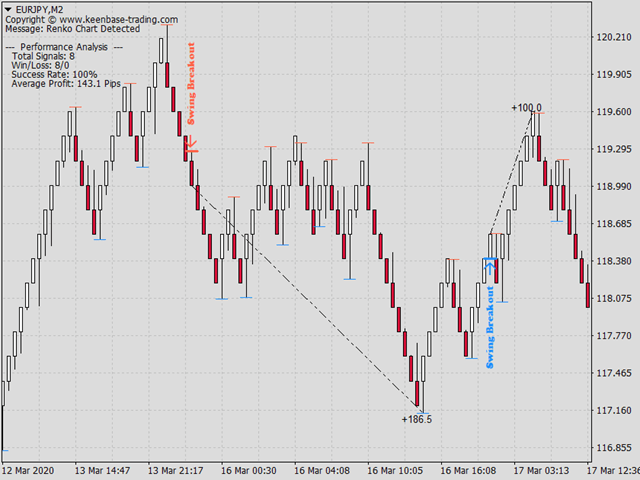
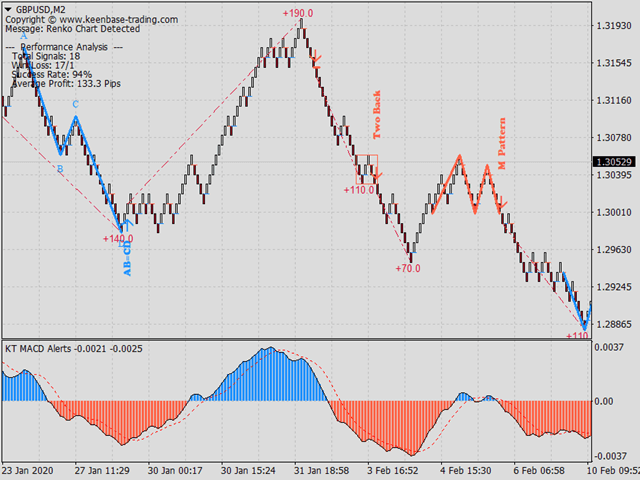
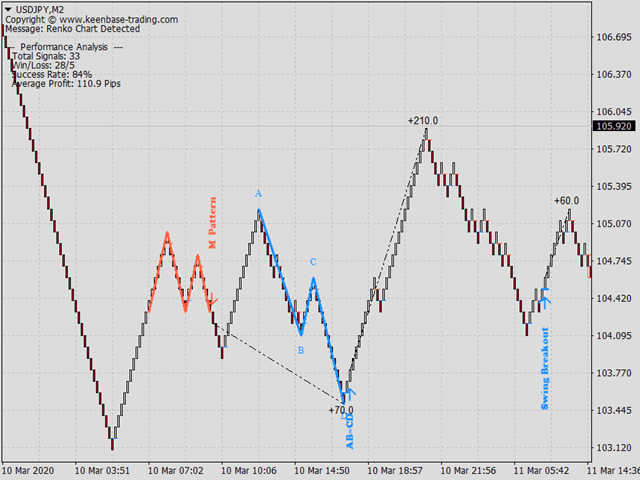
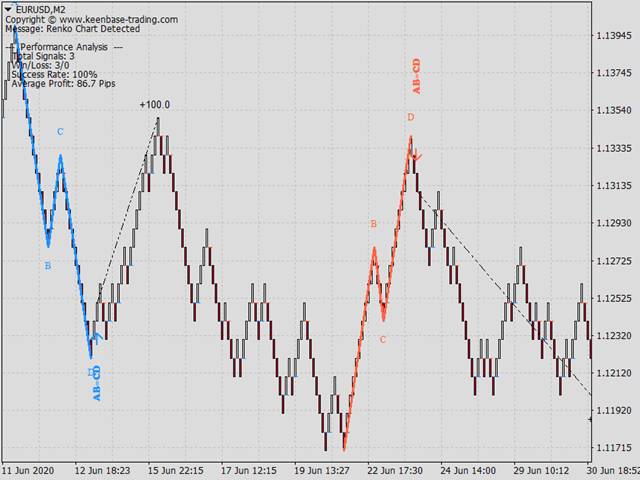
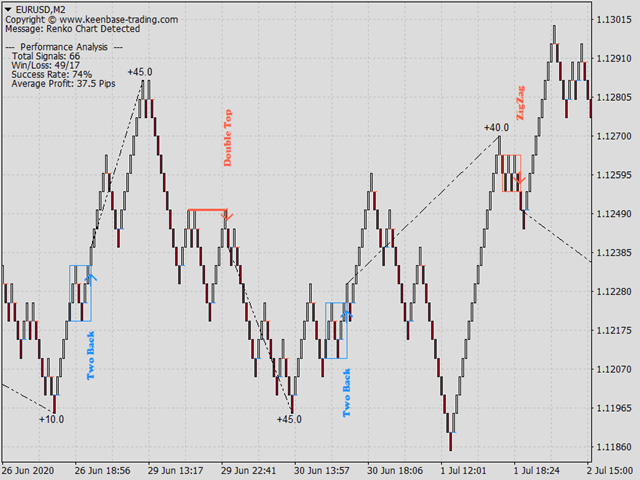
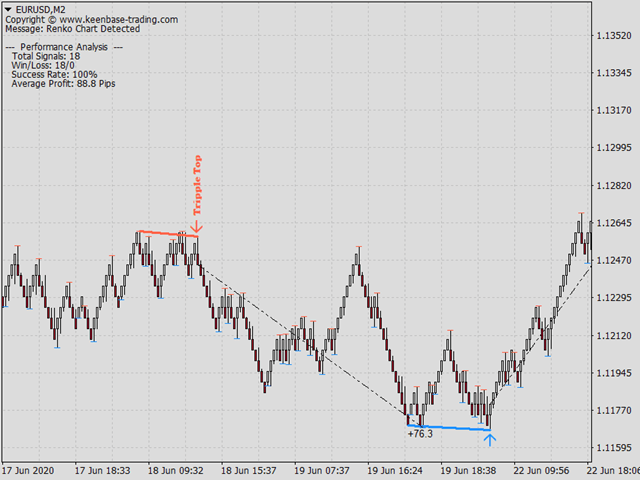
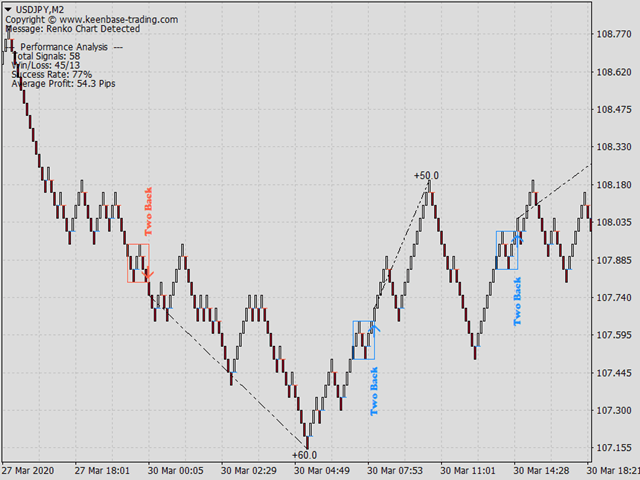
  • KT Renko Patterns mide continuamente la precisión de cada patrón y muestra estadísticas clave en el gráfico.
  • Los retrocesos de los ladrillos Renko son marcados y se generan alertas para facilitar salidas anticipadas ante un giro repentino.
  • Los patrones identificados no se redibujan ni se modifican una vez formados.


Patrones incluidos

  • Patrón W-M
  • Triángulos de poder
  • Patrón AB=CD
  • Triple techo / Triple suelo
  • Doble techo / Doble suelo
  • Two Back Strike
  • Ladrillos ZigZag
  • Ruptura de oscilación

Optimización de la precisión de las señales 

KT Renko Patterns muestra múltiples patrones, pero no todos son adecuados para cada símbolo. Puedes mejorar la precisión de las señales siguiendo estos pasos:

  1. Asegúrate de que cada patrón esté activado (True).
  2. Elige un "Criterio de tasa de éxito" (recomendamos el segundo TP).
  3. Desactiva un patrón a la vez y observa la tasa de éxito.
  4. Si mejora, mantenlo desactivado.
  5. Si empeora, vuelve a activarlo.
  6. Ajusta "Barras mínimas entre patrones" entre 20 y 100.
Aumentar la distancia entre patrones generalmente mejora la tasa de éxito, pero también reduce la cantidad de señales. Se recomienda un valor equilibrado entre 20 y 100.


Parámetros de entrada

  • Barras mínimas entre patrones:  Número mínimo de barras entre cada patrón. Ayuda a mejorar la precisión.
  • Marcar reversión de ladrillo:  Marca los retrocesos en los ladrillos Renko.
  • Alertas de reversión:  Si está activado, genera alertas en cada reversión.
  • Mostrar nombre del patrón:  Dibuja el nombre del patrón junto a la señal.
  • Análisis de rendimiento:  El indicador muestra métricas clave de su desempeño.
  • Criterio de tasa de éxito:  Parámetro usado para medir la efectividad de los patrones.


Preguntas frecuentes

Q. ¿Funciona en gráficos estándar basados en tiempo?

A. El indicador KT Renko Patterns está diseñado específicamente para gráficos Renko. Aunque puede usarse en gráficos de tiempo, no se recomienda.


Q. ¿Es posible optimizar la precisión de las señales?

A. Sí, las instrucciones de optimización están descritas arriba.


Q. Tengo una sugerencia de patrón, ¿pueden incluirlo en la próxima versión?

A. Por favor envíanos un mensaje. Si el patrón es útil, lo incluiremos en la próxima versión.


Q. ¿Puedo importar este indicador en un EA?

A. Sí, por favor contáctanos para obtener el código de desarrollador.

Productos recomendados
El indicador SMC Venom Model BPR es una herramienta profesional para operadores que trabajan con el concepto de Dinero Inteligente (SMC). Identifica automáticamente dos patrones clave en el gráfico de precios: FVG   (Fair Value Gap) es una combinación de tres velas, con un gap entre la primera y la tercera. Forma una zona entre niveles donde no hay soporte de volumen, lo que suele provocar una corrección del precio. BPR   (Balanced Price Range) es una combinación de dos patrones FVG que forman
Este es posiblemente el indicador de reconocimiento automático de formación de precios más completo que puede encontrar para la plataforma MetaTrader. Detecta 19 patrones diferentes, toma las proyecciones de Fibonacci tan en serio como usted, muestra la zona de reversión potencial (PRZ) y encuentra niveles adecuados de stop-loss y take-profit. [ Guía de instalación | Guía de actualización | Solución de problemas | FAQ | Todos los productos ] Detecta 19 formaciones de precios armónicos diferen
The Penta-O is a 6-point retracement harmonacci pattern which usually precedes big market movements. Penta-O patterns can expand and repaint quite a bit. To make things easier this indicator implements a twist: it waits for a donchian breakout in the right direction before signaling the trade. The end result is an otherwise repainting indicator with a very reliable trading signal. The donchian breakout period is entered as an input. [ Installation Guide | Update Guide | Troubleshooting | FAQ | A
KT Pin Bar MT5
KEENBASE SOFTWARE SOLUTIONS
KT Pin Bar identifies the pin bar formation which is a type of price action pattern which depicts a sign of reversal or rejection of the trend. When combined with support and resistance, BRN and other significant levels, Pin Bar pattern proved to be a very strong sign of reversal. Basically, a pin bar is characterized by a small body relative to the bar length which is closed either in upper or lower 50% part of its length. They have very large wicks and small candle body. A pin bar candlestic
Monster Harmonics Indicator is a harmonic pattern indicator. It recognizes Gartley, Bat, Crab, Butterfly, Cypher, White Swan, Black Swan, Shark and AB=CD patterns. Projected patterns that are not yet completed are recognized, too. Monster even shows the PRZ (Potential Reversal Zone). Users can add their own user defined patterns to Monster. Besides the current pattern, Monster also shows all patterns in the symbols history. Monster will provide alerts for developing patterns. Introduced by H.M.
Mean Reversion Supply Demand Indicator Mean Reversion Supply Demand is the indicator to detect the important supply demand zone in your chart. The concept of supply demand trading relies on the quantity mismatching between buying and selling volumes in the financial market. Typically, supply demand zone serves to predict the turning point. The wave pattern, for any supply demand zone to work as an successful trade, looks like the price must touch the base zone, move away and then return to zone
Noize Absorption Index - is the manual trading system that measures the difference of pressure between bears forces and bulls forces. Green line - is a noize free index that showing curent situation. Zero value of index shows totally choppy/flat market.Values above zero level shows how powerfull bullish wave is and values below zero measures bearish forces.Up arrow appears on bearish market when it's ready to reverse, dn arrow appears on weak bullish market, as a result of reverse expectation.
ProEngulfing For MT5
Ashkan Hazegh Nikrou
La versión gratuita de ProEngulfing es QualifiedEngulfing, con una limitación de una señal por día y menos funciones. Únete al canal de Koala Trading Solution en la comunidad de mql5 para conocer las últimas novedades sobre todos los productos de Koala. Enlace de acceso: https ://www .mql5 .com /en /channels /koalatradingsolution La versión MT4 de este producto ya está disponible para descargar en el siguiente enlace: https ://www .mql5 .com /en /market /product /52023 Presentamos ProEngulfing
El indicador DYJ BoS identifica y marca automáticamente los elementos esenciales de los cambios en la estructura del mercado, incluidos: Ruptura de estructura (BoS): se detecta cuando el precio realiza un movimiento significativo, rompiendo un punto de estructura anterior. Marca posibles líneas de tendencia alcista y líneas de tendencia bajista (UP & DN, es decir, nuevos máximos y nuevos mínimos continuos), y una vez que el precio rompe estas líneas, marca flechas rojas (BEAR) y verdes (BULL)
KT Double Top Bottom MT5
KEENBASE SOFTWARE SOLUTIONS
1 (1)
The double top bottom pattern is arguably one of the technical analysis's most popular chart patterns. These patterns are used to capitalize on recurring patterns and identify trend reversal patterns, thereby creating well-placed entry and exit levels. The KT Double Top Bottom is based on these patterns and fine-tunes the trade signal development process for traders. Features It's based on one of the most reliable trading patterns and brings some fine-tuning and automation to the process. Also
Range Directional Force Indicator – Designed for You to Optimize! The Range Directional Force Indicator is a cutting-edge tool designed to empower traders by visualizing market dynamics and directional strength. Built to offer insights into market trends and reversals, this indicator is an invaluable asset for traders seeking precision in their strategies. However, it is important to note that this indicator is not optimized, leaving room for you to tailor it to your unique trading preferences.
Indicador único que implementa un enfoque profesional y cuantitativo para el comercio de reversión a la media. Aprovecha el hecho de que el precio se desvía y vuelve a la media de manera predecible y medible, lo que permite reglas claras de entrada y salida que superan ampliamente las estrategias comerciales no cuantitativas. [ Installation Guide | Update Guide | Troubleshooting | FAQ | All Products ] Señales comerciales claras Sorprendentemente fácil de operar Colores y tamaños personalizables
Price Breakout pattern Scanner is the automatic scanner for traders and investors. It can detect following patterns automatically from your chart. Head and Shoulder - Common tradable pattern. Reverse Head and Shoulder - This pattern is the reverse formation of the Head and Shoulder. Double Top - When the price hits resistance level twice and decline toward the support level, the trader can anticipate sudden bearish breakout through the support level. Double Bottom - The double bottom pattern is
¿Cansado de trazar líneas de soporte y resistencia? La resistencia de soporte es un indicador de marco de tiempo múltiple que detecta y traza automáticamente los soportes y las líneas de resistencia en el gráfico con un giro muy interesante: a medida que los niveles de precios se prueban con el tiempo y aumenta su importancia, las líneas se vuelven más gruesas y oscuras. [ Guía de instalación | Guía de actualización | Solución de problemas | FAQ | Todos los productos ] Mejora tu análisis técnic
¡El nivel Premium es un indicador único con más del 80% de precisión de predicciones correctas! ¡Este indicador ha sido probado por los mejores especialistas en comercio durante más de dos meses! ¡El indicador del autor no lo encontrarás en ningún otro lugar! ¡A partir de las capturas de pantalla, puede ver por sí mismo la precisión de esta herramienta! 1 es ideal para operar con opciones binarias con un tiempo de vencimiento de 1 vela. 2 funciona en todos los pares de divisas, acciones, m
Statistical Arbitrage Spread Generator for Cointegration [MT5] What is Pair Trading? Pair trading is a market-neutral strategy that looks to exploit the relative price movement between two correlated assets — instead of betting on the direction of the market. The idea? When two assets that usually move together diverge beyond a statistically significant threshold, one is likely mispriced. You sell the expensive one, buy the cheap one , and profit when they converge again. It’s a statistica
FREE
Cumulative delta indicator As most traders believe, the price moves under the pressure of market buying or selling. When someone redeems an offer standing in the cup, the deal is a "buy". If someone pours into the bid standing in the cup - the deal goes with the direction of "sale". The delta is the difference between purchases and sales. A cumulative delta - the difference between the cumulative sum of purchases and sales for a certain period of time. It allows you to see who is currently contr
This Indicator enhances the default Relative Strength Index (RSI) by introducing several improvements. First, it visually highlights overbought and oversold regions by changing the RSI color from white to red. Second, it includes additional reference lines at 20, 40, 50, 60, and 80, providing a clearer framework for assessing RSI values. The most notable feature is the use of the middle 50-line to indicate the current market cycle. The color of the 50-line dynamically reflects the cycle: green f
WAPV Weis Wave Chart Forex
Eduardo Da Costa Custodio Santos
El Weis Wave Chart Forex para MT5 es un indicador de precio y volumen. La lectura de Precio y Volumen fue ampliamente difundida a través de Richard Demille Wyckoff en base a las tres leyes creadas por él: Oferta y Demanda, Causa y Efecto y Esfuerzo vs. Resultado. En 1900, R.Wyckoff ya utilizaba el gráfico de ondas en sus análisis. Muchos años después, alrededor de 1990, David Weis Automatizó el gráfico de ondas de R. Wyckoff y hoy os traemos la evolución del gráfico de ondas de David Weis. Muest
To download MT4 version please click here . - This is the exact conversion from TradingView: "Trend Direction Force Index - TDFI [wm]" By "causecelebre". - The screenshot shows similar results from tradingview and Metatrader when tested on ICMarkets on both platforms. - This indicator uses multiple levels of averaging to detect trend strength. - You can optimize filter low and filter high levels to achieve best results. - You have access to buffers to use in EAs. - This is a light-load processin
UR Gamma MT5
Krzysztof Jan Debski
Gama UR (impulsado por cálculos similares que se encuentran en los sistemas de aprendizaje automático) UR Gamma es una herramienta de análisis financiero de vanguardia que ofrece una versión nueva y mejorada del indicador clásico WaveTrend. Al incorporar técnicas avanzadas de procesamiento de señales digitales, UR Gamma aborda algunas de las limitaciones de los algoritmos WaveTrend tradicionales y brinda un enfoque más preciso, sólido y dinámico para identificar y medir tendencias en la acción
Was: $249  Now: $149   Market Profile defines a number of day types that can help the trader to determine market behaviour. A key feature is the Value Area, representing the range of price action where 70% of trading took place. Understanding the Value Area can give traders valuable insight into market direction and establish the higher odds trade. It is an excellent addition to any system you may be using. Inspired by Jim Dalton’s book “Mind Over Markets”, this indicator is designed to suit the
Best SAR MT5
Ashkan Hazegh Nikrou
4.33 (3)
Descripción :  nos complace presentar nuestro nuevo indicador gratuito basado en uno de los indicadores profesionales y populares en el mercado de divisas (PSAR). Este indicador es una nueva modificación del indicador Parabolic SAR original. En el indicador pro SAR puede ver el cruce entre puntos y el gráfico de precios. el cruce no es una señal, pero habla sobre el final del potencial de movimiento, puede comenzar a comprar con un nuevo punto azul y colocar un límite de pérdidas un atr antes
FREE
Awesome Oscillator by Bill Williams with the ability to fine-tune and replace the averaging algorithms of the indicator, which significantly expands the possibilities of using this oscillator in algorithmic trading and brings it closer in its properties to such an indicator as the MACD. To reduce price noise, the final indicator is processed with an additional Smooth averaging. The indicator has the ability to give alerts, send mail messages and push signals when the direction of movement of th
This is the famous Sunflower indicator for Metatrader5. This indicator marks possible tops and bottoms on price charts. The indicator identifies tops and bottoms in the asset's price history, keep in mind that the current sunflower of the last candle repaints, as it is not possible to identify a top until the market reverses and it is also not possible to identify a bottom without the market stop falling and start rising. If you are looking for a professional programmer for Metatrader5, please
Owl Smart Levels MT5
Sergey Ermolov
4 (29)
Versión MT4  |  FAQ El Indicador Owl Smart Levels es un sistema comercial completo dentro de un indicador que incluye herramientas de análisis de mercado tan populares como los fractales avanzados de Bill Williams , Valable ZigZag que construye la estructura de onda correcta del mercado y los niveles de Fibonacci que marcan los niveles exactos de entrada. en el mercado y lugares para tomar ganancias. Descripción detallada de la estrategia Instrucciones para trabajar con el indicador Asesor de c
No Demand No Supply MT5
Trade The Volume Waves Single Member P.C.
No Demand No Supply   This indicator identifies   No Demand –No Supply candles to your chart and plots volume bars colored according to the signal. It can be applied to all timeframes or to a specific one only. It can also be used as regular volume indicator  with exceptional future of WEIGHTED VOLUME. Furthermore is has an alert notification, sound and email when a signals occurs. The indicator does not repaint but the alert will come on two candles back due to the definition of No Demand No Su
The   Supply and Demand Zones indicator   is one of the best tools we have ever made. This great tool automatically draws supply and demand zones, the best places for opening and closing positions. It has many advanced features such as multi timeframe zones support, displaying the width of zones, alert notifications for retouched zones, and much more. Because of market fractality, this indicator can be used for any kind of trading. Whether you are a positional, swing, or intraday trader does no
Surf Board
Mohammadal Alizadehmadani
Benefits of the Surfboard indicator : Entry signals without repainting If a signal appears and is confirmed, it does NOT disappear anymore, unlike indicators with repainting, which lead to major financial losses because they can show a signal and then remove it. perfect opening of trades The indicator algorithms allow you to find the Peak and floor position to enter a deal (buy or sell an asset), which increases the success rate for each and every trader using it. Surfboard works with any asset
- This is the exact conversion from TradingView: "Support/Resistance" By "BarsStallone". - This indicator lets you read the buffers for R/S values. - This is a non-repaint and light processing load indicator. - This is not a multi time frame indicator If you want the multi time frame version you should create a personal order and I deliver two files that you need them both to have the multi time frame indicator running on your system. - The MT4 version of the indicator is not light load from pr
Los compradores de este producto también adquieren
NOTE: CYCLEMAESTRO is distributed only on this website, there are no other distributors. Demo version is for reference only and is not supported. Full versione is perfectly functional and it is supported. CYCLEMAESTRO , the first and only indicator of Cyclic Analysis, useful for giving signals of TRADING, BUY, SELL, STOP LOSS, ADDING. Created on the logic of   Serghei Istrati   and programmed by   Stefano Frisetti ;   CYCLEMAESTRO   is not an indicator like the others, the challenge was to inter
MonetTrend — Премиум-индикатор для торговли по тренду (M30, H1, H4) MonetTrend — это мощный и визуально понятный трендовый индикатор, созданный для торговли на таймфреймах M30, H1 и H4. Он идеально подходит для работы с волатильными инструментами, такими как: • Золото (XAUUSD) • Криптовалюты (BTCUSD) • Валютные пары (EURUSD, USDJPY и др.) Ключевые особенности MonetTrend: • Автоматическое отображение Take Profit 1 (TP1) и Stop Loss (SL): После появления сигнала индикатор сразу показывает: • TP
RelicusRoad Pro MT5
Relicus LLC
4.79 (19)
Ahora $ 147 (aumentando a $ 499 después de algunas actualizaciones) - Cuentas ilimitadas (PC o Mac) Manual de usuario de RelicusRoad + Videos de capacitación + Acceso al grupo privado de Discord + Estado VIP UNA NUEVA MANERA DE VER EL MERCADO RelicusRoad es el indicador comercial más poderoso del mundo para divisas, futuros, criptomonedas, acciones e índices, y brinda a los comerciantes toda la información y las herramientas que necesitan para mantenerse rentables. Brindamos análisis técnico
Gold Stuff mt5
Vasiliy Strukov
4.93 (178)
Gold Stuff mt5: un indicador de tendencia diseñado específicamente para el oro, también se puede usar en cualquier instrumento financiero. El indicador no se vuelve a dibujar ni se retrasa. El marco de tiempo recomendado es H1. IMPORTANTE! Póngase en contacto conmigo inmediatamente después de la compra para obtener instrucciones y bonificación!   Puede obtener una copia gratuita de nuestro indicador Strong Support y Trend Scanner, por favor envíe un mensaje privado. ¡a mí! PARÁMETROS Draw Ar
TPSpro RFI Levels MT5
Roman Podpora
4.55 (20)
Zonas de reversión / Volúmenes máximos / Zonas activas de un jugador importante =       SISTEMA TS TPSPRO INSTRUCCIONES RUS       /       INSTRUCCIONES       ESP       /           Versión MT4        Cada comprador de este indicador recibe adicionalmente GRATIS: 3 meses de acceso a señales comerciales del servicio RFI SIGNALS: puntos de entrada listos para usar según el algoritmo TPSproSYSTEM. Materiales de formación con actualizaciones periódicas: sumérgete en la estrategia y haz crecer tu niv
Quantum TrendPulse
Bogdan Ion Puscasu
5 (13)
Presentamos   Quantum TrendPulse   , la herramienta de trading definitiva que combina el poder de   SuperTrend   ,   RSI   y   Stochastic   en un indicador integral para maximizar su potencial de trading. Diseñado para traders que buscan precisión y eficiencia, este indicador le ayuda a identificar tendencias del mercado, cambios de impulso y puntos de entrada y salida óptimos con confianza. Características principales: Integración con SuperTrend:   siga fácilmente la tendencia predominante del
MONEYTRON – ТВОЙ ЛИЧНЫЙ СИГНАЛ НА УСПЕХ! XAUUSD | AUDUSD | USDJPY | BTCUSD Поддержка таймфреймов: M5, M15, M30, H1 Почему трейдеры выбирают Moneytron? 82% успешных сделок — это не просто цифры, это результат продуманной логики, точного алгоритма и настоящей силы анализа. Автоматические сигналы на вход — не нужно гадать: когда покупать, когда продавать. 3 уровня Take Profit — ты сам выбираешь свой уровень прибыли: безопасный, уверенный или максимум. Четкий Stop Loss — контролируешь риск
CBT Quantum Maverick Sistema de Comercio de Opciones Binarias de Alta Eficiencia CBT Quantum Maverick es un sistema de opciones binarias de alto rendimiento diseñado para traders que buscan precisión, simplicidad y un enfoque disciplinado. No requiere personalización: el sistema está optimizado para resultados efectivos desde el primer momento. Simplemente sigue las señales, que se pueden dominar con un poco de práctica. Características clave: Precisión de señales: Señales basadas en la próxim
IQ Gold Gann Levels a non-repainting, precision tool designed exclusively for XAUUSD/Gold intraday trading. It uses W.D. Gann’s square root method to plot real-time support and resistance levels, helping traders spot high-probability entries with confidence and clarity. William Delbert Gann (W.D. Gann) was an exceptional market analyst, whose trading technique was based on a complex blend of mathematics, geometry, astrology, and ancient mathematics which proved to be extremely accurate. Download
Elliott Wave Trend was designed for the scientific wave counting. This tool focuses to get rid of the vagueness of the classic Elliott Wave Counting using the guideline from the template and pattern approach. In doing so, firstly Elliott Wave Trend offers the template for your wave counting. Secondly, it offers Wave Structural Score to assist to identify accurate wave formation. It offers both impulse wave Structural Score and corrective wave Structure Score. Structural Score is the rating to sh
MTF Supply Demand Zones MT5
Georgios Kalomoiropoulos
5 (1)
Próxima generación de zonas de oferta y demanda automatizadas. Algoritmo nuevo e innovador que funciona en cualquier gráfico. Todas las zonas se crean dinámicamente de acuerdo con la acción del precio del mercado. DOS TIPOS DE ALERTAS --> 1)CUANDO EL PRECIO LLEGA A UNA ZONA 2)CUANDO SE FORMA UNA NUEVA ZONA No obtienes un indicador inútil más. Obtiene una estrategia comercial completa con resultados probados.     Nuevas características:     Alertas cuando el precio llega a la zona de ofert
MetaForecast M5
Vahidreza Heidar Gholami
5 (3)
MetaForecast predice y visualiza el futuro de cualquier mercado basándose en las armonías de los datos de precios. Aunque el mercado no siempre es predecible, si existe un patrón en el precio, MetaForecast puede predecir el futuro con la mayor precisión posible. En comparación con otros productos similares, MetaForecast puede generar resultados más precisos al analizar las tendencias del mercado. Parámetros de entrada Past size (Tamaño del pasado) Especifica el número de barras que MetaForecast
FxaccurateLS
Shiv Raj Kumawat
WHY IS OUR FXACCCURATE LS MT5 THE PROFITABLE ? PROTECT YOUR CAPITAL WITH RISK MANAGEMENT Gives entry, stop and target levels from time to time. It finds Trading opportunities by analyzing what the price is doing during established trends. POWERFUL INDICATOR FOR A RELIABLE STRATEGIES We have made these indicators with a lot of years of hard work. It is made at a very advanced level. Established trends provide dozens of trading opportunities, but most trend indicators completely ignore them! The
Blahtech Supply Demand MT5
Blahtech Limited
4.54 (13)
Was: $299  Now: $149  Supply Demand uses previous price action to identify potential imbalances between buyers and sellers. The key is to identify the better odds zones, not just the untouched ones. Blahtech Supply Demand indicator delivers functionality previously unavailable on any trading platform. This 4-in-1 indicator not only highlights the higher probability zones using a multi-criteria strength engine, but also combines it with multi-timeframe trend analysis, previously confirmed swings
El Oscilador de Índice de Precisión (Pi-Osc) de Roger Medcalf de Precision Trading Systems La versión 2 ha sido cuidadosamente recodificada para cargar rápidamente en su gráfico y se han incorporado algunas otras mejoras técnicas para mejorar la experiencia. El Pi-Osc fue creado para proporcionar señales precisas de temporización de operaciones diseñadas para encontrar puntos de agotamiento extremos, los puntos a los que los mercados se ven obligados a llegar solo para eliminar las órdenes de
The   Time_Price_SQ9_Degree   indicator is based on the 9 Gann square. Using this indicator, you can identify strong time and price zones. The indicator displays the levels as a degree value. The degrees can be set in the settings. After launching, the MENU button appears. If it is highlighted, it can be moved to any point on the graph, and after double-clicking on it, it stops being highlighted and menu buttons appear. To hide the menu, just double-click on the button, it will become highlight
Introduciendo       Quantum Breakout PRO   , el innovador indicador MQL5 que está transformando la forma en que comercia con Breakout Zones. Desarrollado por un equipo de comerciantes experimentados con experiencia comercial de más de 13 años,       Desglose cuántico PRO       está diseñado para impulsar su viaje comercial a nuevas alturas con su innovadora y dinámica estrategia de zona de ruptura. El indicador de ruptura cuántica le dará flechas de señal en las zonas de ruptura con 5 zonas ob
DESCRIPCIÓN ICSM (Impulse-Correction SCOB Mapper) es el indicador que analiza el movimiento del precio e identifica impulsos válidos, correcciones y SCOBs (Single Candle Order Block). Es una herramienta poderosa que se puede utilizar con cualquier tipo de análisis técnico porque es flexible, informativa, fácil de usar y mejora sustancialmente la conciencia del trader sobre las zonas de interés más líquidas. CONFIGURACIÓN General | Visuales Tema de color — define el tema de color del ICSM.
¿Está buscando un potente indicador de compraventa de divisas que pueda ayudarlo a identificar oportunidades comerciales rentables con facilidad? No busque más allá de Beast Super Signal. Este indicador basado en tendencias fácil de usar monitorea continuamente las condiciones del mercado, buscando nuevas tendencias en desarrollo o saltando sobre las existentes. Beast Super Signal da una señal de compra o venta cuando todas las estrategias internas se alinean y están en 100% de confluencia entre
Volume by Price MT5
Brian Collard
3.25 (4)
Volume Profile, Footprint and Market Profile TPO (Time Price Opportunity). Volume and TPO histogram bar and line charts. Volume Footprint charts. TPO letter and block marker collapsed and split structure charts. Static, dynamic and flexible range segmentation and compositing methods with relative and absolute visualizations. Session hours filtering and segment concatenation with Market Watch and custom user specifications. Graphical layering, positioning and styling options to suit the user's a
TPA True Price Action indicator reveals the true price action of the market makers through 100% non-repainting signals strictly at the close of a candle! TPA shows entries and re-entries, every time the bulls are definitely stronger than the bears and vice versa. Not to confuse with red/green candles. The shift of power gets confirmed at the earliest stage and is ONE exit strategy of several. There are available now two free parts of the TPA User Guide for our customers. The first "The Basics"
AT Forex Indicator MT5
Marzena Maria Szmit
5 (5)
The AT Forex Indicator MT5 is a sophisticated trading tool designed to provide traders with a comprehensive analysis of multiple currency pairs. This powerful indicator simplifies the complex nature of the forex market, making it accessible for both novice and experienced traders. AT Forex Indicator uses advanced algorithms to detect trends, patterns and is an essential tool for traders aiming to enhance their forex trading performance. With its robust features, ease of use, and reliable signal
[ MT4 Version ]  [ Order Blocks ]  [ Kill Zones ]  [ SMT Divergences ] How to trade using Order Blocks :  Click here User Interface Performance:  During testing in the strategy tester, the UI may experience lag. Rest assured, this issue is specific to the testing environment and does not affect the indicator's performance in live trading. Elevate your trading strategy with the  Order Blocks ICT Multi TF  indicator, a cutting-edge tool designed to enhance your trading decisions through advanced o
[ MT4 Version ]  [ Kill Zones ]  [ SMT Divergences ] How to trade using Order Blocks:  Click here User Interface Performance:  During testing in the strategy tester, the UI may experience lag. Rest assured, this issue is specific to the testing environment and does not affect the indicator's performance in live trading. Elevate your trading strategy with the  Order Blocks ICT Multi TF  indicator, a cutting-edge tool designed to enhance your trading decisions through advanced order block analysis
MT4 Version SMT Divergences MT5 SMT Divergences is one of the most innovative indicators in the market. It offers the possibility of analyzing price divergences between 2 pairs. These divergences highlight and help to foresee what banks and institutions are planning to do. SMT divergences also provides you with a kill zones indicator and the possibility of filtering divergences occurring during these kill zones.  This indicator is specially powerful if applied in 2 highly correlated pairs. A pri
[ MT4 Version ] Are you tired of spending months on demo or live accounts to test your trading strategies? The Backtesting Simulator is the ultimate tool designed to elevate your backtesting experience to new heights. Utilizing Metatrader historical symbol information, it offers an unparalleled simulation of real market conditions. Take control of your testing speed, test ideas quickly or at a slower pace, and witness remarkable improvements in your testing performance. Forget about wasting tim
How to use Pair Trading Station Pair Trading Station is recommended for H1 time frame and you can use it for any currency pairs. To generate buy and sell signal, follow few steps below to apply Pair Trading Station to your MetaTrader terminal. When you load Pair Trading Station on your chart, Pair Trading station will assess available historical data in your MetaTrader platforms for each currency pair. On your chart, the amount of historical data available will be displayed for each currency pai
The Naveen Dynamic Square  MT5  is one of the best known  technical analysis tools  inspired  by WD Gann along with the Gann Fan and Gann Box. It is considered a cornerstone of his trading technique that is based on time and price symmetry. The Naveen Dynamic Square MT5   is a powerful tool in finance for determining support and resistance levels based on a stock's extreme price points. It works by extrapolating probable price levels from a central value, typically an all-time or cyclical high o
Reversal ALGO
Muhammad Abdullah Bhatti
Reversal Algo es un indicador técnico diseñado para ayudar a los traders a identificar posibles puntos de reversión en la tendencia del mercado. A través de un análisis profundo de los datos históricos de precios, este indicador detecta máximos y mínimos clave que podrían indicar un cambio en la dirección del mercado. Su sistema de señales visuales claras permite a los traders identificar zonas críticas donde podría producirse una reversión de tendencia. Características principales Detección de
Super Zone indicator
Dmitriy Sotnikov
5 (1)
Super Zone   For several years of observing the principles of the market, Super Zone worked, both then and now, because the indicator  allows you to see the trading range of the  week and even the month that major market participants use. It’s very easy to use, we work on H4 in the weekly range (  in the tester it doesn’t work in the demo mode  ) - we sell from the upper zones, we buy from the lower ones. It marks the zones from the beginning of the week (month) that are  not redrawn  , works on
Otros productos de este autor
Si operas en Forex, tener información detallada sobre la fortaleza de las divisas y la correlación entre los pares de divisas puede llevar tu trading a un nuevo nivel. La correlación te ayudará a reducir el riesgo a la mitad, mientras que el análisis de fortaleza te permitirá maximizar las ganancias. Este indicador ofrece un enfoque híbrido para seleccionar los pares de divisas más adecuados, combinando el análisis de fortaleza y la correlación entre pares de divisas. Cómo usar el análisis de f
KT Asian Breakout Indicator
KEENBASE SOFTWARE SOLUTIONS
El indicador KT Asian Breakout analiza una parte clave de la sesión asiática para generar señales de compra y venta en ambas direcciones, basadas en la ruptura del precio. Se genera una señal de compra cuando el precio rompe por encima del máximo de la sesión y una señal de venta cuando el precio rompe por debajo del mínimo de la sesión. Cosas a tener en cuenta Si la caja de la sesión es demasiado ancha verticalmente, se recomienda evitar nuevas operaciones, ya que la mayor parte de la acción d
KT Auto Fibo
KEENBASE SOFTWARE SOLUTIONS
KT Auto Fibo dibuja automáticamente los niveles de retroceso de Fibonacci basándose en la dirección actual de la tendencia. Los máximos y mínimos se seleccionan automáticamente utilizando los puntos más altos y más bajos disponibles en el gráfico. Puedes hacer zoom y desplazarte para ajustar los niveles de Fibonacci según sea necesario. Modos Automático:  Dibuja automáticamente los niveles de Fibonacci en función del área visible del gráfico. Manual: Dibuja los niveles de Fibonacci solo una vez
KT Volatility Oscillator
KEENBASE SOFTWARE SOLUTIONS
El oscilador de volatilidad KT analiza los datos de mercado pasados y actuales utilizando una fórmula matemática para mostrar el resultado en forma de oscilador. Las ondas crecientes y decrecientes equivalen a una alta y baja volatilidad del activo.  En pocas palabras, la volatilidad es simplemente una medida de las fluctuaciones de precio de un activo durante un determinado período de tiempo. Sin volatilidad, habría poco movimiento en el mercado y los traders no podrían beneficiarse de los camb
KT Psar Arrows
KEENBASE SOFTWARE SOLUTIONS
KT Psar Arrows dibuja flechas en el gráfico utilizando el indicador estándar Parabolic SAR. Se traza una flecha alcista cuando el máximo de la vela toca el SAR. Se traza una flecha bajista cuando el mínimo de la vela toca el SAR. Las señales se generan en tiempo real sin necesidad de esperar al cierre de la vela.  Características Una herramienta útil para traders que desean experimentar con estrategias de trading que incorporan el indicador Parabolic SAR.  Puede ser utilizado para identificar p
KT MA Crossover MT5
KEENBASE SOFTWARE SOLUTIONS
KT MA Crossover dibuja flechas de compra y venta basadas en el cruce de las medias móviles seleccionadas. Además, genera alertas correspondientes y muestra el valor MFE (Excursión Más Favorable) para cada señal consecutiva. El cruce de medias móviles es una de las estrategias más utilizadas por los traders en todo el mundo. Generalmente, se compone de una media móvil rápida y una lenta para identificar señales de compra y venta según la dirección del cruce. Señal de compra - cuando la media móv
KT Momentum Arrows MT5
KEENBASE SOFTWARE SOLUTIONS
5 (2)
El indicador KT Momentum Arrows se basa en una ruptura momentánea que se calcula mediante la desviación de las bandas y la volatilidad emergente en una dirección determinada. Se genera una señal de compra cuando el precio cierra por encima de la banda superior y una señal de venta cuando el precio cierra por debajo de la banda inferior. Se utiliza un coeficiente de magnitud como parámetro de entrada, el cual afecta tanto la desviación de las bandas como la medición de la volatilidad. Este valor
KT RSI Divergence robot is a 100% automated expert advisor that trades regular and hidden divergence built between the price and Relative Strength Index (RSI) oscillator. The divergence signals are fetched from our freely available RSI divergence indicator. Not every divergence ends up in a successful price reversal, that's why this ea combines the raw divergences signals with its inbuilt technical analysis module to exploit the price inefficiency that occurs after some selected divergence sig
Use of support and resistance in systematic trading is very subjective. Every trader has their own idea and way to plotting the support and resistance levels on the chart. KT Support and Resistance indicator take out this ambiguity out of the situation and automatically draws support and resistance levels following an algorithmic approach using a unique multi-timeframe analysis. When launched on the chart, It immediately scan the most significant extreme points across all the available timefra
KT Stoch Divergence MT5
KEENBASE SOFTWARE SOLUTIONS
La divergencia es una de las señales clave que indica una posible reversión del precio en el mercado. KT Stoch Divergence muestra las divergencias regulares y ocultas que se forman entre el precio y el oscilador estocástico. Limitaciones de KT Stoch Divergence Usar divergencias estocásticas como única señal de entrada puede ser arriesgado. No todas las divergencias indican una reversión fuerte. Para obtener mejores resultados, es recomendable combinarlas con acción del precio y dirección de la
KT Trend Magic MT5
KEENBASE SOFTWARE SOLUTIONS
KT Trend Magic shows the trend depiction on chart using the combination of market momentum and volatility. A smoothing coefficient is used to smooth out the noise from the signal.It can be used to find out the new entries or confirm the trades produced by other EA or indicator. Features Drag n drop MTF scanner which scans for the new signals across multiple time-frames. Find new entries in the trend direction. Improve the accuracy of other indicators when used in conjunction. Can be used as a d
KT Trend Magic
KEENBASE SOFTWARE SOLUTIONS
KT Trend Magic shows the trend depiction on chart using the combination of market momentum and volatility. A smoothing coefficient is used to smooth out the noise from the signal.It can be used to find out the new entries or confirm the trades produced by other EA/Indicators. Usage Drag n drop MTF scanner which scans for the new signals across multiple time-frames. Find new entries in the trend direction. Improve the accuracy of other indicators when used in conjunction. Can be used as a dynami
KT COG Advanced MT4
KEENBASE SOFTWARE SOLUTIONS
1 (1)
KT COG is an advanced implementation of the center of gravity indicator presented by John F. Ehlers in the May 2002 edition of Technical Analysis of Stocks & Commodities magazine. It's a leading indicator which can be used to identify the potential reversal points with the minimum lag. The COG oscillator catches the price swings quite effectively. MT5 version of the same indicator is available here KT COG Advanced MT5 Calculation of COG The COG indicator is consist of the two lines. The main l
KT CCI Divergence MT4
KEENBASE SOFTWARE SOLUTIONS
KT CCI Divergence shows the regular and hidden divergence created between the price and CCI oscillator. Divergence is one of the vital signals that depicts the upcoming price reversal in the market. Manually spotting the divergence between price and CCI can be a hectic and ambiguous task. Limitations of KT CCI Divergence   Using the CCI divergence as a standalone entry signal can be risky. Every divergence can't be interpreted as a strong reversal signal. For better results, try to combine it w
ACB Breakout Arrows
KEENBASE SOFTWARE SOLUTIONS
4.15 (34)
The ACB Breakout Arrows indicator provides a crucial entry signal in the market by detecting a special breakout pattern. The indicator constantly scans the chart for a settling momentum in one direction and provide the accurate entry signal right before the major move.  Get multi-symbol and multi-timeframe scanner from here - Scanner for ACB Breakout Arrows MT4 Key features Stoploss and Take Profit levels are provided by the indicator. Comes with a MTF Scanner dashboard which tracks the breako
ACB Trade Filter MT4
KEENBASE SOFTWARE SOLUTIONS
5 (1)
The ACB Trade Filter indicator provides a solution for filtering out the low probability trading setups in a trading strategy. The indicator uses a sophisticated filtration algorithm based on the market sentiment and trend. Applications Works great with our indicator " ACB Breakout Arrows ". Filter out low probability signals from any indicator. Avoid overtrading and minimize the losses. Trade in the direction of market sentiment and trend. Avoid the choppiness in the market. How to use Only L
KT Momentum Arrows
KEENBASE SOFTWARE SOLUTIONS
El indicador KT Momentum Arrows se basa en una ruptura momentánea que se calcula mediante la desviación de las bandas y la volatilidad emergente en una dirección determinada. Se genera una señal de compra cuando el precio cierra por encima de la banda superior y una señal de venta cuando el precio cierra por debajo de la banda inferior. Se utiliza un coeficiente de magnitud como parámetro de entrada, el cual afecta tanto la desviación de las bandas como la medición de la volatilidad. Este valor
KT Pin Bar
KEENBASE SOFTWARE SOLUTIONS
KT Pin Bar identifies the pin bar formation which is a type of price action pattern which depicts a sign of reversal or rejection of the trend. When combined with support and resistance, BRN and other significant levels, Pin Bar pattern proved to be a very strong sign of reversal. Basically, a pin bar is characterized by a small body relative to the bar length which is closed either in upper or lower 50% part of its length. They have very large wicks and small candle body. A pin bar candlestic
KT Ichimoku Trader
KEENBASE SOFTWARE SOLUTIONS
1 (1)
KT Ichimoku Trader is a fully automated expert advisor that offers five popular trading strategies based on the Ichimoku indicator. Each strategy has it's own entry and exit method without any interference to other strategies. The Ichimoku system can be applied to all major currency pairs and metals. However, we found that it performs reasonably well mainly on two pairs.   MT5 Version is available here  https://www.mql5.com/en/market/product/35043 Features Trade up to 5 famous trading strategi
KT COG Robot
KEENBASE SOFTWARE SOLUTIONS
KT COG Robot is a fully automated Expert Advisor based on the KT COG Indicator . The COG indicator was originally presented by John F. Ehlers in the May 2002 edition of Technical Analysis of Stocks & Commodities magazine. The EA fires a long trade when COG line cross above the signal line and a short trade is fired when the COG line cross below the signal line.  Adaptive Filtration Our adaptive filtration algorithm combines the original COG formula with the major trend direction and market acce
ACB Breakout Arrows EA
KEENBASE SOFTWARE SOLUTIONS
This is a 100% automated expert advisor based on our custom indicator named "ACB Breakout Arrows" . The entries are based on a breakout pattern that constantly occurs in a bi-directional manner. The intensity of entry signals can be manipulated using the external input called "Signal Sensitivity". MT5 Version is available here  https://www.mql5.com/en/market/product/35785 Trades Confirmation ACB Breakout Arrows EA provides an ability to filter the entries using our another custom indicator nam
KT Asian Breakout
KEENBASE SOFTWARE SOLUTIONS
4 (1)
KT Asian Breakout carefully analyzes the range-bound market during the Asian session and then fires a long or short trade after doing some preassessment based on its inbuilt technical analysis module. The executed orders are closed within a day before the completion of the next day session. The inbuilt technical analysis module checks for the session range and compares it with the last 20 days price movement. If it finds any erratic price movement within the session, the orders are not executed
KT London Breakout
KEENBASE SOFTWARE SOLUTIONS
First thirty minutes are essential for a trading session. The early reaction of traders and market players sets a path for the rest of the day. KT London Breakout EA takes advantage of this phenomenon, and after analyzing the first thirty minutes of London session, it places two bidirectional pending orders. One of pending order is eventually canceled after realizing the market direction with certainty. It has been strictly tested and developed for EUR/JPY using 30-Min Time Frame. You can expe
MACD Divergence Seeker
KEENBASE SOFTWARE SOLUTIONS
KT MACD Divergence Seeker trades the regular and hidden divergence signals generated by our free indicator named KT MACD Divergence indicator. Trading the standalone divergences can be a risky affair that's why the KT MACD Divergence Seeker combines the standard divergence signals with an advanced analysis module to exploit the price inefficiencies on some FX pairs. What is the Divergence exactly? As a general conception if the price is making higher highs, then macd should also be making hig
MACD Divergence MT4
KEENBASE SOFTWARE SOLUTIONS
KT MACD Divergence shows the regular and hidden divergences build between the price and oscillator. If your trading strategy anticipates the trend reversal, you can include the MACD regular divergence to speculate the potential turning points. And if your trading strategy based on the trend continuation, MACD hidden divergence would be a good fit. Limitations of KT MACD Divergence Using the macd divergence as a standalone entry signal can be a risky affair. Every divergence can't be interprete
KT Bollinger Bands Trader is a 100% automated expert advisor that's incorporated a mean reversion trading strategy using the Bollinger bands during the period of low volatility. Price often reacts at the upper or lower line of Bollinger bands, but a reversal not always occurs. However, there is more chance of price reversal during the time of low volatility. Entries A buy trade is activated when price correctly aligns below the bottom line of Bollinger bands. A sell trade is activated when pric
KT Heiken Ashi Smoothed MT4
KEENBASE SOFTWARE SOLUTIONS
KT Heiken Ashi Smoothed is a smoothed version of the standard Heiken Ashi. Moreover, it also plots buy/sell arrows on a trend change. A buy arrow is plotted when it change to a bullish state from bearish state. A sell arrow is plotted when it change to a bearish state from bullish state. Mobile notifications, Email, Sound and Pop-up alerts included. What exactly is Heiken Ashi Smoothed? It filters out the false signals and noise in the standard Heiken Ashi. It applies the set of two moving ave
KT MA Crossover MT4
KEENBASE SOFTWARE SOLUTIONS
KT MA Crossover dibuja flechas de compra y venta basadas en el cruce de las medias móviles seleccionadas. Además, genera alertas correspondientes y muestra el valor MFE (Excursión Más Favorable) para cada señal consecutiva. El cruce de medias móviles es una de las estrategias más utilizadas por los traders en todo el mundo. Generalmente, se compone de una media móvil rápida y una lenta para identificar señales de compra y venta según la dirección del cruce. Señal de compra - cuando la media móv
KT Round Numbers MT4
KEENBASE SOFTWARE SOLUTIONS
KT Round Numbers plots the round number levels which are also commonly known as psychological levels in the Forex world. In the context of Forex trading, round number levels are those levels in which there are two or more zeroes at the end. They are named as 00 levels on the chart. Some traders also consider the halfway points as a valid round number level. They are named as 50 levels on the chart. Use of round number levels in trading Round number levels work as strong support and resistance
Filtro:
No hay comentarios
Respuesta al comentario
Versión 2.3 2021.02.15
- fixes the bug that was causing the lag.
Versión 2.1 2021.01.19
- speed optimizations.
- bugs removal.
Versión 2.0 2021.01.06
- Code optimization that increases the execution speed.
- Addresses the minor bugs.
Versión 1.5 2020.10.13
- Added SL and TPs to the buffers to provide an optimal way to fetch the SL and targets via EA.
- However, It is not recommended, but now the indicator can work on normal time-based charts with a warning message.
- Profit lines now appear on the tester.
- Addresses a bug that was causing the indicator to break on the tester.
- Addresses a bug that was causing the disappearance of pennant patterns sometimes.
- Added more weightage to complex patterns.
- Source code optimization.