• Información general
  • Comentarios
  • Discusión

Volume Speedometer

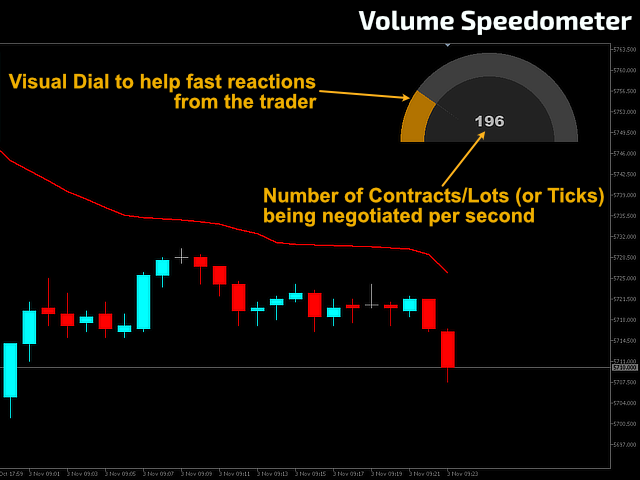
Imagine the ability to have Volume Speed second by second presented to you in the form of a speedometer...

Well, imagine no more... Welcome to the new Minions Labs creation: Volume Speedometer.

Volume Speedometer is a Minions Labs idea that was born trying to show in realtime what is happening with the Volume Flow of orders (or Ticks, if you don't have that) during the day. This indicator was created to be used in Intraday trading and the goal is to give you a "heads up" when the Volume flow is probably going "your way".

Since it is a totally "visual" tool, it was designed to manual traders.

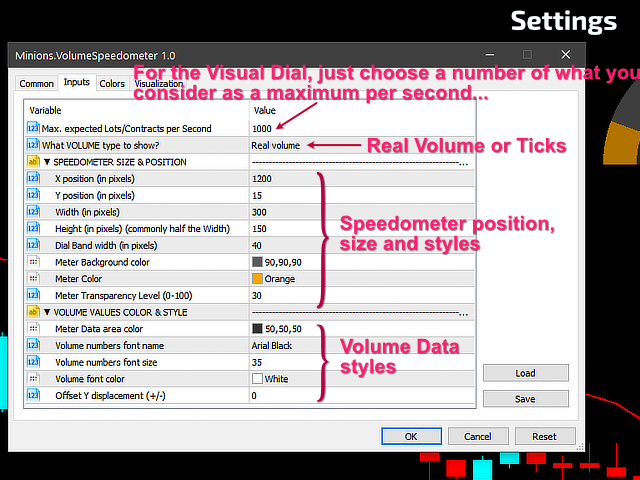
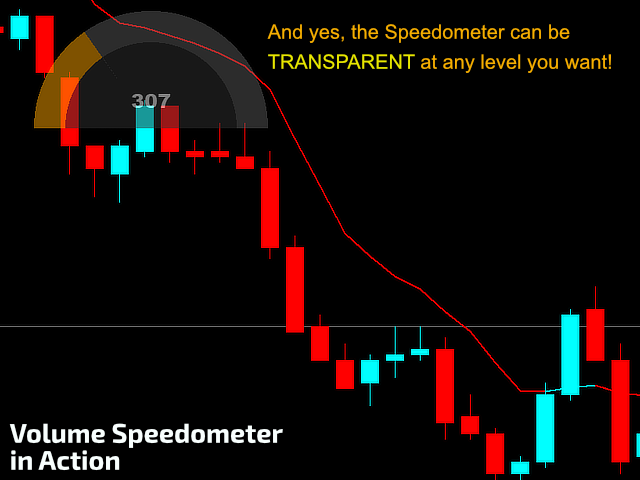
With its simplicity, there is no calibration process, it just shows the volume flow second by second. You can obviously cumstomize all aspects of the indicator appearance and location, and even its transparency level on your chart, so it will be gently blended into your chart causing no additional "information overload".


Maybe Volume Speedometer may be the confirmation tool you ever wanted to have...

If you are not right away convinced of its usefullness in your trading strategy, give the FREE DEMO version a try:

Volume Speedometer DEMO


SETTINGS

  • Maximum expected Lots/Contracts (This is for the calculation of the Speedometer scale)
  • Type of Volume to be analyzed (Real Volume or Ticks)
  • Speedometer Size, Color, Transparency and Position in the Chart
  • Volume  Values Colors & Style


Didn't Find a Feature You Need?

No product is perfect for everyone. If you think you need a missing feature from our product just send us a message. We love feedback!


Productos recomendados
Volume Profile Indicator used by professional Traders at Traders Inside Ltd. If you want to succeed in trading you need to know if current price is cheap, expensive or fair valued. Key features: Fair price (Point of control, POC), high and low price zones (POH, POL) POC in different timeframes for better orientation Symbol and timeframe Chart resize on open positions/orders, VPRmax/min Historic POC - see, how POC has changed the last periods Button to show/hide VPR Calculated Bars (best results
HiLo Activator Plus
Rodrigo Galeote
5 (1)
HiLo Activator es uno de los indicadores más utilizados para determinar tendencia. Encuéntrelo aquí esta versión personalizada de Gekko con la capacidad de personalizar el período y los colores. Este indicador también traza flechas hacia arriba y hacia abajo cuando hay un cambio en la tendencia, lo que indica puntos de entrada y salida muy fuertes HiLo se adapta bien a diferentes tipos de períodos para la negociación intradiaro. Puedes entender fácilmente cuándo es el momento de comprar o vender
The moving average is the easiest indicator to recognize changes in the price of a currency. It is excellent to set multiple indicators for each period or type and see the transition. However, setting multiple moving averages is very troublesome, isn't it? Moreover, displaying multiple currency pairs will increase the time and effort. It is an indicator that saves you the trouble. You can display multiple moving averages at once. You can freely set up to 4 lines, line thickness,
XCalper HiLo Activator
Aecio de Feo Flora Neto
HiLo Activator v1.02 by xCalper The HiLo Activator is similar to moving average of previous highs and lows. It is a trend-following indicator used to display market’s direction of movement. The indicator is responsible for entry signals and also helps determine stop-loss levels. The HiLo Activator was first introduced by Robert Krausz in the Feb. 1998 issue of Stocks & Commodities Magazine.
Este innovador indicador de medición de la fuerza de la moneda de INFINITY es un ayudante indispensable para los revendedores y comerciantes que negocian en el largo plazo. El sistema de Análisis de fortaleza / debilidad de las monedas ha sido conocido y utilizado en el mercado por los principales operadores del mundo. Cualquier comercio de arbitraje no está completo sin este análisis. Nuestro indicador determina fácilmente la fuerza de las monedas subyacentes entre sí. Muestra gráficos de líne
Extrend
Ignacio Agustin Mene Franco
Extrend !  es un indicador oscilador ,  Donde mide las tendencias alcistas y bajistas  ideal para hacer scalping y largos !  la estrategia consta de el cruce de lineas ,  donde lleva 2 tipos de lineas , una azul y una verde ! donde la linea azul da el cruce por arriba de la verde  da señal de entrada ,  donde la linea verde cruza por abajo la linea azul da señal de venta ! Sirve para todas las temporalidades !  Buen Profit ! World Inversor  . 
Fractals
Mikhail Nazarenko
The Fractals indicator displays on the chart only fractals with the specified parameters in the indicator settings. This allows you to more accurately record a trend reversal, excluding false reversals. According to the classical definition of a fractal, it is a candlestick - an extremum on the chart, which was not crossed by the price of 2 candles before and 2 candles after the appearance of a fractal candle. This indicator provides the ability to adjust the number of candles before and after t
Recognizer 1 2 3 Patterns
Gennadiy Stanilevych
5 (2)
Este indicador está destinado para reconocer y marcar en el gráfico 1-2-3 patrones de compra y de venta. El indicador ayudará al trader a detectar los fractales de inicio y de señal, indicar los posibles puntos de entrada en el mercado en todos los períodos de tiempo del programa МetaTrader 5. En el gráfico se dibujan las líneas de Fibonachi que indican supuestos objetivos del movimiento partiendo de la teoría de ondas. Las formaciones 1-2-3 adquieren una especial importancia después de la forma
Setup 9.1 strategy created by the North American trader Larry Williams . SIMPLE setup, effective, with a good level of accuracy and excellent return. Attention : The Demo version only works on the tester, if you are interested in running it in real time, please contact me and I will provide another version. Buy Signal: Exponential moving average of 9 (MME9) is falling, wait it to TURN UP (in closed candle). Place a buy stop order 1 tick above the HIGH of the candle that caused the turn to occur
Atomic Analyst MT5
Issam Kassas
4.42 (19)
En primer lugar, vale la pena enfatizar que este Indicador de Trading no repinta, no redibuja y no se retrasa, lo que lo hace ideal tanto para el trading manual como para el automatizado. Manual del usuario: configuraciones, entradas y estrategia. El Analista Atómico es un Indicador de Acción del Precio PA que utiliza la fuerza y el impulso del precio para encontrar una mejor ventaja en el mercado. Equipado con filtros avanzados que ayudan a eliminar ruidos y señales falsas, y aumentan el poten
MTF Lines PRO
Renato Fiche Junior
5 (1)
This indicator was developed to support multiple timeframe analysis. In the indicator settings, the user can set the color, width, and style of the horizontal lines for each timeframe. This way, when the horizontal lines are inserted into the chart, they will be plotted with the timeframe settings. MTF Lines also allows visibility control of another objets like rectangles, trend lines and texts. This is a product developed by Renato Fiche Junior and available to all MetaTrader 4 and 5 users!
Best Tested Pairs :-  Step Index (Also can use on other pairs which spread is lowest) How does the Magic Storm work The Magic Storm will commence only if the Initial Trade becomes a losing trade. In case the initial trade is a profitable one, or has been closed by the trader there is no need for the Magic Stormto be initiated. Let’s assume that the initial trade was a 1 lot buy trade with Recovery Zone Range Pips is 50 and Recovery Zone Exit Pips is 150 pips. The take profit fo
The Inside Bar e one is a reversal/continuation candle formation, and is one of the most traded candle patterns. Robot F1 allows you to configure different trading strategies, Day Trade or swing trade, based on the Inside Bar as a starting point.  This pattern only requires two candles to perform. Robot F1 uses this extremely efficient pattern to identify trading opportunities. To make operations more effective, it has indicators that can be configured according to your strategy. Among th
Noize Absorption Index - is the manual trading system that measures the difference of pressure between bears forces and bulls forces. Green line - is a noize free index that showing curent situation. Zero value of index shows totally choppy/flat market.Values above zero level shows how powerfull bullish wave is and values below zero measures bearish forces.Up arrow appears on bearish market when it's ready to reverse, dn arrow appears on weak bullish market, as a result of reverse expectation.
This indicator was creating a perfect structure to not re-paint or recalculate, all signals are accurate. I can create a robotic version of this indicator but I need more precision in the signals. So appreciate this work. Tips to use when trading, do not buy at the top or sell at the bottom, always buy at the bottom  and sell at the top. Risk 1 to 3. In the settings you can adjust the size of the shadow or trail of the candle, you can change the colors and sizes of the arrows.
FREE
Description : Rainbow EA MT5 is a simple Expert advisor based on   Rainbow MT5 indicator witch is based on Moving average with period 34. The indicator is incorporated in the EA, therefore, it is not required for the EA to operate, but if you wish, you can download it from   my product page . The Expert Advisor settings are as follows : Suitable for Timeframes up to H1 The parameters below can be set according to your trading rules. StopLoss ( Stop Loss in pips) TakeProfit ( Take Profit in pi
Heiken Ashi Smoothed Strategy is a very simple but powerful system to get forex market trend direction. This indicator is actually 2 indicators in 1 pack, Heiken Ashi and Heiken Ashi Smoothed Moving Average both included. Because HA (Heiken Ashi) and HAS (Heiken Ashi Smoothed) are calculated in the same one system event with necessary buffers and loop only, so it is the FAST, OPTIMIZED and EFFICIENT HA having the combined indicator of MetaTrader 5. You can choose to display HA and HAS in the sam
This indicator displays buy or sell signals according to Bill Williams' definition of the Trading Zone. [ Installation Guide | Update Guide | Troubleshooting | FAQ | All Products ] Easy to use and understand Avoid trading flat markets Deterministic indicator with clear rules The indicator is non-repainting It implements alerts of all kinds It has straightforward trading implications. A blue arrow is a buy signal A red arrow is a sell signal According to Bill Williams trading in the zone helps t
The GJ_H1_220100009_S_HD_CF_SQX_SL20 is an algorithmic trading strategy for MetaTrader, tested on GBPJPY using the H1 timeframe from April 1, 2004, to April 24, 2024.  There is no need to set up parameters, all settings are already optimized and fine-tuned. Recommended broker  RoboForex  because of EET timezone. You can find the strategy source code for StrategyQuant at the link:   http://quantmonitor.net/listing/gbpjpy-macd-trader/ Key details are: Parameters MagicNumber: 220100009 M
FREE
This plots  Fibonacci deviation levels above and below a moving average of the price. Companion indicator to the " Golden Bull Wave Trader "  expert advisor which uses volume\price trend to determine price reversals. https://www.mql5.com/en/market/product/56291 The expert advisor and this indicator were created in order to: Identify ideal and repeatable trade entries with high level of certainty Create a day trading strategy which doesn’t require a hard SL and TP Use alternate risk management me
This indicator builds upon the previously posted Nadaraya-Watson smoothers. Here we have created an envelope indicator based on Kernel Smoothing with integrated alerts from crosses between the price and envelope extremities. Unlike the Nadaraya-Watson estimator, this indicator follows a contrarian methodology. Please note that by default this indicator can be subject to repainting. Users can use a non-repainting smoothing method available from the settings. The triangle labels are designed
Master Calendar Osw
William Oswaldo Mayorga Urduy
MASTER CALENDAR OSW Este Indicador fue creado inicialmente para mi uso personal, pero lo he ido mejorando poco a poco e implementando funciones para ayudas de mi trading del día a día y se seguirán implementando funciones si son de utilidad. DETALLES DEL CALENDARIO. >Calendario móvil y detallado de las noticias cercanas a la fecha actual, con datos como: fecha, País, Moneda, Sector de la noticia, Nombre de la Noticia, y datos Previo, Predicción y Actual. >El Calendario se actualiza automáticamen
Cybertrade Auto Fibonacci retraction and projection  - MT5 Auto Fibonacci is an indicator that automatically plots the Fibonacci retracement and projection based on the number of bars you select in the indicator setting. You can customize nine different levels of retraction and three levels of projection. It works on periods longer than the period visible on the chart. All values ​​are available in the form of buffers to simplify possible automations. This indicator is the same one we use in o
FREE
Trading patterns on Forex is considered to be the highest level of trading, since it usually requires years of mastering various patterns (shapes and candle combinations) and the ways they affect the price. Patterns are different combinations of Japanese candles on a chart, shapes of classical technical analysis, as well as any regularities of the market behavior repeating many times under the same conditions. After the patterns appear on a chart, the price starts behaving in a certain way allow
Your Pointer is no ordinary Forex channel. This corridor is built on the basis of the analysis of several candles, starting from the last one, as a result of which the extremes of the studied interval are determined. They are the ones who create the channel lines. Like all channels, it has a middle line as well as a high and low line. This channel is worth watching for its unusual behavior. The use of the Your Pointer indicator allows the trader to react in time to the price going beyond the bo
Supply and Demand Monster
Tsog Erdene Borjigon Enkhkhudulmur
Supply and demand zones are at the heart of   supply and demand trading . These zones are areas that show  liquidity at a specific price.  The supply zone is also called the distribution zone, while the demand zone is called the accumulation zone.   Our indicator automatically draw supply and demand zones in Metatrader 5. It give opportunity to understand trading zone and avoiding risk.
Supertrend indicator uses a combination of a moving average and average true range to detect the trend of a trading instrument. Supertrend indicator for MetaTrader 5 easily shows the trend as a line following the price. Triple SuperTrend Histo indicator  calculate  three supertrends to show the trend as a histogram. Changing the color from red to green means you can BUY , from green to red means you can SELL . Description of the method of drawing a histogram. The price is above the EMA 20
AI Ichimoku Cloud
Miss Preeyanut Budsarakham
The AI Ichimoku Cloud trading system is an automated trading that uses the indicator Ichimoku Cloud to trade, combines with the neural network martingale method, and makes trading safer by trading the main trend of the chart. By backtest the data from 2003-2022, the results were very good. Very low point of loss and has a satisfactory high total profit By trading, there are not many trades each week. Instead, it chooses the period when the graph is trending, so it trades and there is a correctio
Volality Index Scalper
Lesedi Oliver Seilane
5 (1)
Volality Index scalper indicator  Meant for Volality pairs such as Volality 10, 25, 50, 75 and 100 The indicator works on all timeframes from the 1 minute to the monthly timeframe the indicator is non repaint the indicator has 3 entry settings 1 color change on zero cross 2 color change on slope change 3 color change on signal line cross Orange line is your sell signal Blue line is your buy signal.
Was: $249  Now: $99   Market Profile defines a number of day types that can help the trader to determine market behaviour. A key feature is the Value Area, representing the range of price action where 70% of trading took place. Understanding the Value Area can give traders valuable insight into market direction and establish the higher odds trade. It is an excellent addition to any system you may be using. Inspired by Jim Dalton’s book “Mind Over Markets”, this indicator is designed to suit the
Los compradores de este producto también adquieren
TPSpro RFI Levels MT5
Roman Podpora
4.73 (11)
INSTRUCCIONES       RUSO   -   ING        Se   recomienda utilizar con un indicador.       -       TPSpro   TENDENCIA PRO -   Versión MT5 Un elemento clave en el trading son las zonas o niveles desde los que se toman las decisiones de compra o venta de un instrumento de trading. A pesar de los intentos de los principales actores de ocultar su presencia en el mercado, inevitablemente dejan rastros. Nuestra tarea era aprender a identificar estos rastros e interpretarlos correctamente. Funciones p
TPSproTREND PrO MT5
Roman Podpora
4.89 (9)
TPSpro TREND PRO  - is a trend indicator that automatically analyzes the market and provides information about the trend and each of its changes, as well as giving signals for entering trades without redrawing! The indicator uses each candle, analyzing them separately. referring to different impulses - up or down impulse. Exact entry points into transactions for currencies, crypto, metals, stocks, indices!  Version MT4               DETAILED DESCRIPTION               R ecommended to use with an
Atbot
Zaha Feiz
4.91 (35)
AtBot: Cómo funciona y cómo usarlo ### Cómo funciona El indicador "AtBot" para la plataforma MT5 genera señales de compra y venta utilizando una combinación de herramientas de análisis técnico. Integra la Media Móvil Simple (SMA), la Media Móvil Exponencial (EMA) y el índice de Rango Verdadero Promedio (ATR) para identificar oportunidades de trading. Además, puede utilizar velas Heikin Ashi para mejorar la precisión de las señales. Deja una reseña después de la compra y recibe un regalo especia
Primero que todo, vale la pena enfatizar que este Sistema de Trading es un Indicador No Repintado, No Redibujado y No Retrasado, lo que lo hace ideal tanto para el trading manual como para el automatizado. Curso en línea, manual y descarga de ajustes preestablecidos. El "Sistema de Trading Inteligente MT5" es una solución completa de trading diseñada para traders nuevos y experimentados. Combina más de 10 indicadores premium y presenta más de 7 estrategias de trading robustas, lo que lo convie
Gold Stuff mt5
Vasiliy Strukov
4.92 (167)
Gold Stuff mt5: un indicador de tendencia diseñado específicamente para el oro, también se puede usar en cualquier instrumento financiero. El indicador no se vuelve a dibujar ni se retrasa. El marco de tiempo recomendado es H1. IMPORTANTE! Póngase en contacto conmigo inmediatamente después de la compra para obtener instrucciones y bonificación!   Puede obtener una copia gratuita de nuestro indicador Strong Support y Trend Scanner, por favor envíe un mensaje privado. ¡a mí! PARÁMETROS Draw
Trend Screener Pro MT5
STE S.S.COMPANY
4.87 (63)
Desbloquee el poder del comercio de tendencias con el indicador Trend Screener: ¡su solución definitiva para el comercio de tendencias impulsada por lógica difusa y un sistema multidivisa!Mejore su comercio de tendencias con Trend Screener, el revolucionario indicador de tendencias impulsado por lógica difusa. Es un poderoso indicador de seguimiento de tendencias que combina más de 13 herramientas y funciones premium y 3 estrategias comerciales, lo que lo convierte en una opción versátil para co
Quantum Trend Sniper
Bogdan Ion Puscasu
4.8 (49)
Introduciendo       Indicador Quantum Trend Sniper   , el innovador indicador MQL5 que está transformando la forma en que identificas y negocias los cambios de tendencia. Desarrollado por un equipo de comerciantes experimentados con experiencia comercial de más de 13 años,       Indicador de francotirador de tendencia cuántica       está diseñado para impulsar su viaje comercial a nuevas alturas con su forma innovadora de identificar cambios de tendencia con una precisión extremadamente alta.
FX Power MT5 NG
Daniel Stein
5 (5)
Obtenga su actualización diaria del mercado con detalles y capturas de pantalla a través de nuestro Morning Briefing aquí en mql5 y en Telegram ! FX Power MT5 NG es la nueva generación de nuestro popular medidor de fuerza de divisas, FX Power. ¿Y qué ofrece este medidor de fuerza de nueva generación? Todo lo que le encantaba del FX Power original PLUS Análisis de fuerza de ORO/XAU Resultados de cálculo aún más precisos Períodos de análisis configurables individualmente Límite de cálculo persona
FxaccurateLS
Shiv Raj Kumawat
WHY IS OUR FXACCCURATE LS MT5 THE PROFITABLE ? PROTECT YOUR CAPITAL WITH RISK MANAGEMENT Gives entry, stop and target levels from time to time. It finds Trading opportunities by analyzing what the price is doing during established trends. POWERFUL INDICATOR FOR A RELIABLE STRATEGIES We have made these indicators with a lot of years of hard work. It is made at a very advanced level. Established trends provide dozens of trading opportunities, but most trend indicators completely ignore them!
Este tablero muestra los últimos   patrones armónicos   disponibles para los símbolos seleccionados, por lo que ahorrará tiempo y será más eficiente /   versión MT4 . Indicador gratuito:   Basic Harmonic Pattern Columnas del indicador Symbol:   aparecerán los símbolos seleccionados Trend :   alcista o bajista Pattern :   tipo de patrón (gartley, mariposa, murciélago, cangrejo, tiburón, cifrado o ABCD) Entry :   precio de entrada SL:   precio de stop loss TP1:   1er precio de toma de benefici
Ante todo, vale la pena enfatizar que esta Herramienta de Trading es un Indicador No Repintado, No Redibujado y No Retrasado, lo que la hace ideal para el trading profesional. Curso en línea, manual del usuario y demostración. El Indicador de Conceptos de Acción del Precio Inteligente es una herramienta muy potente tanto para traders nuevos como experimentados. Combina más de 20 indicadores útiles en uno solo, combinando ideas avanzadas de trading como el Análisis del Trader del Círculo Inte
PZ Swing Trading MT5
PZ TRADING SLU
5 (4)
Swing Trading es el primer indicador diseñado para detectar oscilaciones en la dirección de la tendencia y posibles oscilaciones de reversión. Utiliza el enfoque de intercambio de línea de base, ampliamente descrito en la literatura comercial. El indicador estudia varios vectores de precios y tiempos para rastrear la dirección de la tendencia agregada y detecta situaciones en las que el mercado está sobrevendido o sobrecomprado y listo para corregir. [ Guía de instalación | Guía de actualización
Blahtech Supply Demand MT5
Blahtech Limited
4.54 (13)
Was: $299  Now: $99   Supply Demand uses previous price action to identify potential imbalances between buyers and sellers. The key is to identify the better odds zones, not just the untouched ones. Blahtech Supply Demand indicator delivers functionality previously unavailable on any trading platform. This 4-in-1 indicator not only highlights the higher probability zones using a multi-criteria strength engine, but also combines it with multi-timeframe trend analysis, previously confirmed swings
Este es un genial indicador para MT5 que ofrece señales precisas para entrar en una transacción sin redibujar. Se puede aplicar a cualquier activo financiero: fórex, criptomonedas, metales, acciones, índices. Nos dará valoraciones bastante precisas y nos dirá cuándo es mejor abrir y cerra una transacción. Eche un vistazo  al vídeo  (6:22), ¡contiene un ejemplo de procesamiento de una sola señal que ha amortizado el indicador! La mayoría de los tráders mejoran sus resultados comerciales durante l
Advanced Supply Demand MT5
Bernhard Schweigert
4.5 (14)
¡Actualmente con 33% de descuento! ¡La mejor solución para cualquier tráder principiante o experto! Este indicador es una herramienta comercial única, de alta calidad y asequible, porque incorpora una serie de características patentadas y una nueva fórmula. Con esta actualización, podrá mostrar zonas de doble marco temporal. No solo podrá mostrar un marco temporal más alto, sino también mostrar ambos, el marco temporal del gráfico MÁS el marco temporal más alto: MOSTRANDO ZONAS ANIDADAS. A todos
ICT, SMC, SMART MONEY CONCEPTS, SMART MONEY, Smart Money Concept, Support and Resistance, Trend Analysis, Price Action, Market Structure, Order Blocks, BOS/CHoCH,   Breaker Blocks ,  Momentum Shift,   Supply&Demand Zone/Order Blocks , Strong Imbalance,   HH/LL/HL/LH,    Fair Value Gap, FVG,  Premium  &   Discount   Zones, Fibonacci Retracement, OTE, Buy Side Liquidity, Sell Side Liquidity, BSL/SSL Taken, Equal Highs & Lows, MTF Dashboard, Multiple Time Frame, BigBar, HTF OB, HTF Market Structure
Fxaccurate TCT
Shiv Raj Kumawat
WHY IS OUR FXACCCURATE TCT MT5 THE PROFITABLE ? Gives entry, stop and target levels from time to time. It finds Trading opportunities by analyzing what the price is doing during established trends. We have made these indicators with a lot of years of hard work. It is made at a very advanced level. Established trends provide dozens of trading opportunities, but most trend indicators completely ignore them! The trend reveals trading indicator represents an average of 10 different trades per trend
Auto Order Block with break of structure based on ICT and Smart Money Concepts (SMC) Futures Break of Structure ( BoS )             Order block ( OB )            Higher time frame Order block / Point of Interest ( POI )    shown on current chart           Fair value Gap ( FVG ) / Imbalance   -  MTF      ( Multi Time Frame )    HH/LL/HL/LH  -  MTF      ( Multi Time Frame )  Choch  MTF      ( Multi Time Frame )  Volume Imbalance     ,  MTF          vIMB Gap’s Power of 3 Equal High
FX Volume MT5
Daniel Stein
4.93 (14)
Obtenga su actualización diaria del mercado con detalles y capturas de pantalla a través de nuestro Morning Briefing aquí en mql5 y en Telegram ! FX Volume es el PRIMER y ÚNICO indicador de volumen que proporciona una visión REAL del sentimiento del mercado desde el punto de vista de un bróker. Proporciona una visión impresionante de cómo los participantes institucionales del mercado, como los brokers, están posicionados en el mercado Forex, mucho más rápido que los informes COT. Ver esta info
** All Symbols x All Timeframes scan just by pressing scanner button ** *** Contact me  to send you instruction and add you in "123 scanner group" for sharing or seeing experiences with other users. After 17 years of experience in the markets and programming, Winner indicator is ready. I would like to share with you! Introduction The 123 Pattern Scanner indicator with a special enhanced algorithm is a very repetitive common pattern finder with a high success rate . Interestingly, this Winner in
MetaForecast M5
Vahidreza Heidar Gholami
5 (2)
MetaForecast predice y visualiza el futuro de cualquier mercado basándose en las armonías de los datos de precios. Aunque el mercado no siempre es predecible, si existe un patrón en el precio, MetaForecast puede predecir el futuro con la mayor precisión posible. En comparación con otros productos similares, MetaForecast puede generar resultados más precisos al analizar las tendencias del mercado. Parámetros de entrada Past size (Tamaño del pasado) Especifica el número de barras que MetaForecas
Stratos Pali mt5
Michela Russo
5 (1)
Stratos Pali Indicator is a revolutionary tool designed to enhance your trading strategy by accurately identifying market trends. This sophisticated indicator uses a unique algorithm to generate a complete histogram, which records when the trend is Long or Short. When a trend reversal occurs, an arrow appears, indicating the new direction of the trend. Important Information Revealed Leave a review and contact me via mql5 message to receive My Top 5 set files for Stratos Pali at no cost ! Do
Gartley Hunter Multi
Siarhei Vashchylka
5 (8)
Gartley Hunter Multi - An indicator for searching for harmonic patterns simultaneously on dozens of trading instruments and on all possible timeframes. Manual (Be sure to read before purchasing) | Version for MT4 Advantages 1. Patterns: Gartley, Butterfly, Shark, Crab. Bat, Alternate Bat, Deep Crab, Cypher 2. Simultaneous search for patterns on dozens of trading instruments and on all possible timeframes 3. Search for patterns of all possible sizes. From the smallest to the largest 4. A
Easy By Sell is a market indicator for opening and closing positions. It becomes easy to track market entries with alerts. It indicates trend reversal points when a price reaches extreme values ​​and the most favorable time to enter the market. it is as effective as a Fibonacci to find a level but it uses different tools such as an algorithm based on ATR indicators and Stochastic Oscillator. You can modify these two parameters as you wish to adapt the settings to the desired period. My othe
ICT, SMC, Smart Money Concept, Soporte y Resistencia, Análisis de Tendencias, Acción del Precio, Estructura del Mercado, Bloques de Órdenes, Bloques Rompedores, Cambio de Momentum, Fuerte Desbalance, HH/LL/HL/LH, Brecha de Valor Justo, FVG, Zonas de Prima y Descuento, Retroceso de Fibonacci, OTE, Liquidez en el Lado Comprador, Liquidez en el Lado Vendedor, Vacíos de Liquidez, Sesiones de Mercado, NDOG, NWOG, Bala de Plata, Plantilla ICT. En el mercado financiero, el análisis de mercado precis
TPA True Price Action indicator reveals the true price action of the market makers through 100% non-repainting signals strictly at the close of a candle! TPA shows entries and re-entries, every time the bulls are definitely stronger than the bears and vice versa. Not to confuse with red/green candles. The shift of power gets confirmed at the earliest stage and is ONE exit strategy of several. There are available now two free parts of the TPA User Guide for our customers. The first "The Basics"
IX Power MT5
Daniel Stein
4.17 (6)
IX Power   lleva por fin la insuperable precisión de FX Power a los símbolos que no son de Forex. Determina con exactitud la intensidad de las tendencias a corto, medio y largo plazo de tus índices, acciones, materias primas, ETF e incluso criptodivisas favoritas. Puede   analizar todo lo   que su terminal le ofrece. Pruébalo y experimenta cómo   tu timing mejora significativamente   a la hora de operar. Características principales de IX Power Resultados de cálculo 100% precisos y sin rep
Golden Spikes Premium
Kwaku Bondzie Ghartey
5 (1)
Golden Spikes Detector Acknowledgement and Dedications:  The name of this indicator was Inspired by an Original; Mr Grant Koopman; a Knowledgeable and experienced Synthetics trader. I dedicate this indicator to Mr Grant.  Overview: The Golden Spikes Premium is a groundbreaking trading indicator meticulously crafted for the Boom and Crash indices on the Deriv market. Tailored to meet the needs of discerning traders, this powerful tool operates exclusively on the one-minute timeframe, providin
Support And Resistance Screener está en un indicador de nivel para MetaTrader que proporciona múltiples herramientas dentro de un indicador. Las herramientas disponibles son: 1. Cribador de estructura de mercado. 2. Zona de retroceso alcista. 3. Zona de retroceso bajista. 4. Puntos pivotes diarios 5. Puntos de pivote semanales 6. Puntos Pivotes mensuales 7. Fuerte soporte y resistencia basado en patrón armónico y volumen. 8. Zonas de nivel de banco. OFERTA POR TIEMPO LIMITADO: El indicador de so
Trend Line Map Pro MT5
STE S.S.COMPANY
4.09 (11)
El indicador Trend Line Map es un complemento para Trend Screener Indicator. Funciona como un escáner para todas las señales generadas por el evaluador de tendencias (Trend Line Signals). Es un escáner de líneas de tendencia basado en el indicador de evaluación de tendencias. Si no tiene el indicador Trend Screener Pro, Trend Line Map Pro no funcionará. It's a Trend Line Scanner based on Trend Screener Indicator. If you don't have Trend Screener Pro Indicator,     the Trend Line Map Pro will
Otros productos de este autor
Mini POC
Flavio Javier Jarabeck
4.95 (22)
For those who struggle with overbloated Volume Profile/Market Profile indicators, here is a solution that contains only the Point of Control (POC) information. Super-fast and reliable, the Mini POC indicator presents this vital information visually within your chart. Totally customizable in splittable timeframes, type of Volume, calculation method, and how many days back you need. SETTINGS Timeframe to split the POCs within the day. Volume type to use: Ticks or Real Volume. Calculation method
FREE
Tabajara V5
Flavio Javier Jarabeck
4.84 (32)
Metatrader 5 version of the famous Andre Machado's Tabajara indicator. If you don't know Andre Machado's Technical Analysis work you don't need this indicator... For those who need it and for those several friend traders who asked this porting from other platforms, here it is... FEATURES 8-period Moving Average 20-period Moving Average 50-period Moving Average 200-period Moving Average Colored candles according to the inflexion of the 20-period MA SETTINGS You can change the Period of all M
FREE
Auto Support and Resistances
Flavio Javier Jarabeck
4.55 (69)
Are you tired of drawing Support & Resistance levels for your Quotes? Are you learning how to spot Support & Resistances? No matter what is your case, Auto Support & Resistances will draw those levels for you! AND, it can draw them from other timeframes, right into you current chart, no matter what timeframe you are using... You can also Agglutinate regions/zones that are too much closer to each other and turning them into one single Support & Resistance Level. All configurable. SETTINGS Time
FREE
Economic Markers
Flavio Javier Jarabeck
4.77 (13)
Easily get all relevant economic events of the current day right into your chart, as markers. Filter what kind of markers do you want: by country (selected individually) and by Importance (High relevance, Medium, Low or any combination of these). Configure the visual cues to your liking. If there is more than one event set to the very same time, their Names will be stacked and you will see the messages merged with the plus (+) sign on the marker. Obviously that long or too much events on the sam
FREE
Inside Bar Radar
Flavio Javier Jarabeck
4.6 (5)
The Inside Bar pattern is a very well known candlestick formation used widely by traders all over the world and in any marketplace. This approach is very simple and adds a little confirmation candle, so it adds a third past candlestick to the count to confirm the direction of the move (upward or downward). Obviously, there is no power on this candlestick formation if the trader has no context on what it is happening on the market he/she is operating, so this is not magic, this "radar" is only a
FREE
Closing Price Reversal
Flavio Javier Jarabeck
5 (8)
Closing Price Reversal is a very well known and traded candlestick pattern. This little indicator paints with specific (user-selected) colors the Closing Price Reveral Up and Down patterns, as well as the Inside Bars (as a bonus). Higher timeframes are more effective  as with all other candlesticks patterns. Do NOT trade solely on this indicator. Search the web for "Closing Price Reversal" to learn about the several approaches that can be used with this pattern. One of them is combining short/me
FREE
Weis Waves
Flavio Javier Jarabeck
2.76 (17)
The original author is David Weis, an expert in the Wyckoff Method. The Weis Wave is a modern adaptation of the 1930's Wyckoff Method, another expert in Tape Reading techniques and Chart Analysis. Weis Waves takes market volume and stacks it into waves according to price conditions giving the trader valuable insights about the market conditions. If you want to learn more about this subject you can find tons of videos in YouTube. Just look for "The Wickoff Method", "Weis Wave" and "Volume Spread
FREE
Aggression Volume
Flavio Javier Jarabeck
4.14 (14)
Aggression Volume Indicator is the kind of indicator that is rarely found in the MQL5 community because it is not based on the standard Volume data provided by the Metatrader 5 platform. It requires the scrutiny of all traffic Ticks requested on the platform... That said, Aggression Volume indicator requests all Tick Data from your Broker and processes it to build a very special version of a Volume Indicator, where Buyers and Sellers aggressions are plotted in a form of Histogram. Additionally,
FREE
Big Player Candles
Flavio Javier Jarabeck
4.91 (22)
If you heard about The Wyckoff Method, Volume Spread Analysis, etc... You are probably searching for the candlestick indicator that shows you the Volume spread all over the current bar, signaling every types of market status... You can control the several Market Levels with custom colors... It is up to you to decide how to use it. Our job is provide you with the indicator... If you like this indicator, all I am asking is a little Review (not a Comment, but a REVIEW! )...    This will mean A
FREE
MIDAS Super VWAP
Flavio Javier Jarabeck
4.44 (9)
Imagine VWAP, MVWAP and MIDAS in one place... Well, you found it! Now you can track the movement of Big Players in various ways, as they in general pursue the benchmarks related to this measuring, gauging if they had good execution or poor execution on their orders. Traders and analysts use the VWAP to eliminate the noise that occurs throughout the day, so they can measure what prices buyers and sellers are really trading. VWAP gives traders insight into how a stock trades for that day and deter
FREE
Symbol Watermark
Flavio Javier Jarabeck
4.5 (10)
Another request from my brotherhood was putting the name of the Symbol being seen - a little bigger - on the Chart, just to get sure that they are seeing the correct one... Mistakes pay a high price on the market... It is a very effective, and almost resource-null-consuming indicator that displays the current Symbol Name and Timeframe in almost any position of your Chart, with any color, and any Font Size... And also you can change the divisor character that is presented between the Symbol Name
FREE
Market Momentum
Flavio Javier Jarabeck
4.2 (5)
The Market Momentum indicator is based on the Volume Zone Oscillator (VZO), presented by Waleed Aly Khalil in the 2009 edition of the International Federation of Technical Analysts journal, and presents a fresh view of this market valuable data that is oftenly misunderstood and neglected: VOLUME. With this new approach of "seeing" Volume data, traders can infer more properly market behavior and increase their odds in a winning trade. "The VZO is a leading volume oscillator; its basic usefulnes
FREE
Waves Sizer
Flavio Javier Jarabeck
3.4 (5)
Wyckoff fans, enjoy! Ideally to be used with the Weis Waves indicator, but it can be easily used alone, the Waves Sizer puts the range (in resulting Price movement) done by the Price on its market swings. You can control how accurate or loose will be the swings. This tool is very helpful for visually know how much the Price has traveled in your Timeframe. This way you can confront this level of effort with the resulting Volume, etc... Weis Waves indicator: https://www.mql5.com/en/market/pro
FREE
Money Flow Index EA Friendly
Flavio Javier Jarabeck
3.5 (2)
The traditional Money Flow Index indicator, this time, EA friendly . There are 3 buffers exposed that can be used by EAs to automatically analyze the Overbought and Oversold conditions of the quote. Just use the traditional iCustom() function to get these signals. This Money Flow Index calculation is based on the traditional Metaquote's MFI indicator. SETTINGS MFI Period Volume type to analyze (Real Volume or Ticks) Starting Overbought region Starting Oversold region USING WITH EAs Buffer
FREE
Stackable VWAP
Flavio Javier Jarabeck
3.5 (4)
Volume Weighted Average Price (VWAP) is a trading benchmark commonly used by Big Players that gives the average price a Symbol has traded throughout the day. It is based on both Volume and price. Additionally we put in this indicator the MVWAP (Moving Volume Weighted Average Price). For those who do not know the usage and the importance od this indicator I recommend a great article about this subject at Investopedia ( https://www.investopedia.com/articles/trading/11/trading-with-vwap-mvwap.asp
FREE
Force Numbers
Flavio Javier Jarabeck
Several assets in several markets have the behavior of using specific numbers as Force Numbers, where support, resistance and price thrust is created. Let this indicator draw those levels of support and resistance for you. You can also stack it to show different level of Prices! This technique is being used by Tape Readers and Order Flow traders all over the world for a long time. Give it a try. Challenge yourself to study new ways of Price Action! SETTINGS What Price reference to use in th
FREE
VWAP and MVWAP
Flavio Javier Jarabeck
4 (5)
Volume Weighted Average Price (VWAP) is a trading benchmark commonly used by Big Players that gives the average price a Symbol has traded throughout the day. It is based on both Volume and price. Additionally we put in this indicator the MVWAP (Moving Volume Weighted Average Price). For those who do not know the usage and the importance od this indicator I recommend a great article about this subject at Investopedia ( https://www.investopedia.com/articles/trading/11/trading-with-vwap-mvwap.asp )
FREE
Price Momentum
Flavio Javier Jarabeck
5 (10)
Value Chart indicator presents the Price evolution in a new form. This indicator, Price Momentum , was developed taking all the calculations presented in the book " Dynamic Trading Indicators " by Mark W. Helweg and David Stendahl (2002). The technique involves de-trended Prices from a user-defined Period of analysis and the addition of a Volatility index correction. The result is an Oscillator with 3 zones: Fair Price Value, Overbought/Oversold and Extremely Overbought/Oversold zones. Adding th
FREE
Flux Diffuser
Flavio Javier Jarabeck
4.33 (6)
Based on Brazilian trader André Moraes' Difusor de Fluxo theory, the indicator is a more reliable version of the original MACD. It is a great confirmation indicator for Swing Trading and also can be used as a Day Trading tool. If you are not familiar with the concept or André's trading strategies, I strongly recommend his excelent book named "Se Afastando da Manada" in which he explains in detail how this indicator is used. Even if you don't know the Portuguese language it is not difficult to un
FREE
Candle Zones
Flavio Javier Jarabeck
You probably heard about Candlesticks behaviors, which in most of the times could denote and trace Volume behaviors even if you are not watching Volume itself... Well, this indicator will do this. Naked traders love to rely solely on candlesticks patterns and with Candle Zones you can trap special patterns and DRAW THEM on your chart. As simple as that. There are several filters you can tweak in order to achieve the analysis you want. Just give it a try. After several months of testing, we think
FREE
Server Clock
Flavio Javier Jarabeck
5 (4)
Many friends asked me for a simple, non-obtrusive, resource-friendly clock to track the time during their trades. It seems pretty obvious, but it is a must-have for those trading the market manually, waiting for the Market News, or just to visually know what time it is... Trading is an absorbing endeavor! So, here it is... Totally configurable, including Font Type, Font Size and Chart Location: Upper Left/Center/Right OR Lower Left/Center/Right, with a little twist of adjusting the Offset, just
FREE
Price Trail Chart
Flavio Javier Jarabeck
5 (2)
For those who hate candlesticks in lower timeframes (M1 through M15) we "invented" a clean new way to follow Price movement and displacement (volatility) called Price Trail Chart . The big "secret" is to get rid of those annoying candle wicks and draw the whole complete candle without them, this way we get a cleaner chart and a new view of the Price Path. No Open or Close markings, just LOW's and HIGH's, full body candle. Additionaly we inserted a Volume monitor from our Best Downloaded indicat
FREE
ATR Monitor EA Friendly
Flavio Javier Jarabeck
ATR Monitor ATR is a measure of volatility introduced by market technician J. Welles Wilder Jr. in his book, "New Concepts in Technical Trading Systems". In general, traders are accustomed to seeing the ATR in the form of a sub-window indicator. What I am presenting here is a simplified version of ATR - just the current ATR number - very useful for monitoring just the very moment of the current chart. And, by default, this indicator will not show up on screen, you can just use the buffers thems
FREE
Time Spaced Moving Averages
Flavio Javier Jarabeck
5 (3)
The concept is simple: Plotting Price behavior within several periods of time. Some Symbols behave very well during the trading day - with this I mean Intraday trading - and this behavior ends up plotting effectively well with the proposed Exponential Moving Averages in this indicator... Obviously that this behavior could not be seen in all Symbols, but you can give it a try... Just drop this indicator in a chart and you will see for yourself... This indicator is intended for "Feeling the Trend
FREE
Mini Chart Indicators
Flavio Javier Jarabeck
The Metatrader 5 has a hidden jewel called Chart Object, mostly unknown to the common users and hidden in a sub-menu within the platform. Called Mini Chart, this object is a miniature instance of a big/normal chart that could be added/attached to any normal chart, this way the Mini Chart will be bound to the main Chart in a very minimalist way saving a precious amount of real state on your screen. If you don't know the Mini Chart, give it a try - see the video and screenshots below. This is a gr
Economic Markers PRO
Flavio Javier Jarabeck
1 (1)
Easily get all relevant economic events of the current day right into your chart, as markers. Filter what kind of markers do you want: by country (selected individually) and by Importance (High relevance, Medium, Low or any combination of these). Configure the visual cues to your liking. Additionaly you have the ability to add up to 5 personal markers of your own agenda. With Alerts and/or with blackout periods, if you are using it within an Expert Advisor! All in one Economic Calendar indicator
ATR Monitor
Flavio Javier Jarabeck
4.8 (5)
ATR is a measure of volatility introduced by market technician J. Welles Wilder Jr. in his book, "New Concepts in Technical Trading Systems". In general, traders are accustomed to seeing the ATR in the form of a sub-window indicator. What I am presenting here is a simplified version of ATR - just the current ATR number - very useful for monitoring just the very moment of the current chart. If you want to monitor several timeframes in the same chart, just add the ATR Monitor indicator several tim
FREE
Arrows Cleaner
Flavio Javier Jarabeck
5 (3)
For those who use the Trading Arrows on the chart for later study, but use the Triple Screen approach and got all those arrows everywhere on all additional charts, here it is: Arrows Cleaner! Just drop it on the chart and leave it there. When needed, just with 1-click you get rid of all those annoying arrows... SETTINGS You can position the little Button on any corner of the chart. Additionally you can displace it with the Offset settings. You can enlarge or shrink its size, as well as the tex
FREE
Candlestick Pattern Teller
Flavio Javier Jarabeck
5 (1)
Minions Labs' Candlestick Pattern Teller It shows on your chart the names of the famous Candlesticks Patterns formations as soon as they are created and confirmed. No repainting. That way beginners and also professional traders who have difficulties in visually identifying candlestick patterns will have their analysis in a much easier format. Did you know that in general there are 3 types of individuals: Visual, Auditory, and Kinesthetic? Don't be ashamed if you cannot easily recognize Candlest
Market Momentum PRO
Flavio Javier Jarabeck
The Market Momentum indicator is based on the Volume Zone Oscillator (VZO), presented by Waleed Aly Khalil in the 2009 edition of the International Federation of Technical Analysts journal, and presents a fresh view of this market valuable data that is oftenly misunderstood and neglected: VOLUME. With this new approach of "seeing" Volume data, traders can infer more properly market behavior and increase their odds in a winning trade. "The VZO is a leading volume oscillator; its basic usefulnes
Filtro:
No hay comentarios
Respuesta al comentario