Netsrac ADR Dashboard MT5
- Indicadores
- Carsten Pflug
- Versión: 4.6
- Actualizado: 20 abril 2023
- Activaciones: 20
Big summer sale. Save up to 40% on my products. ADR Dashboard - save 9$!
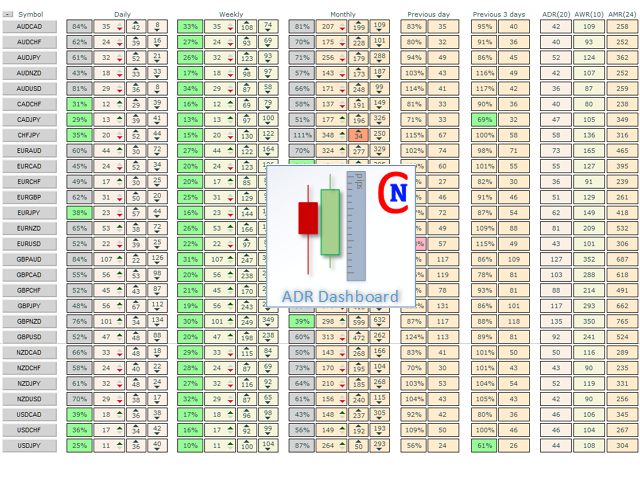
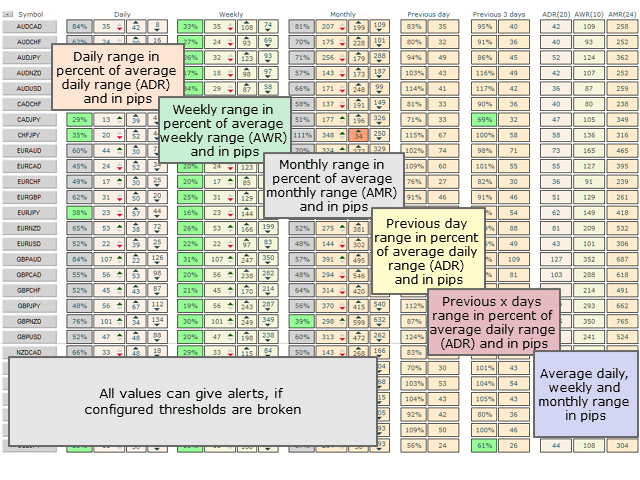
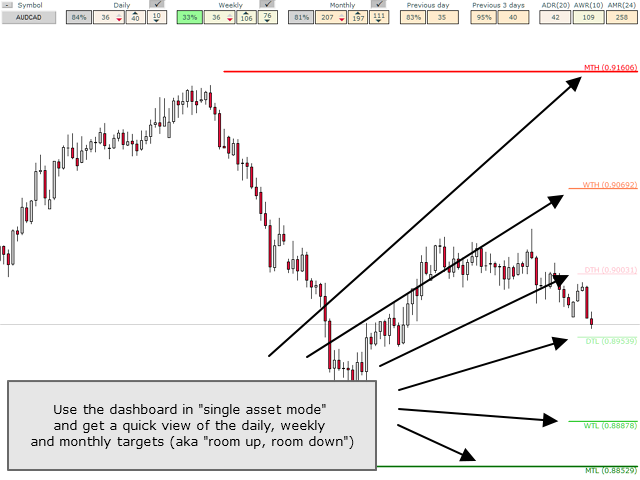
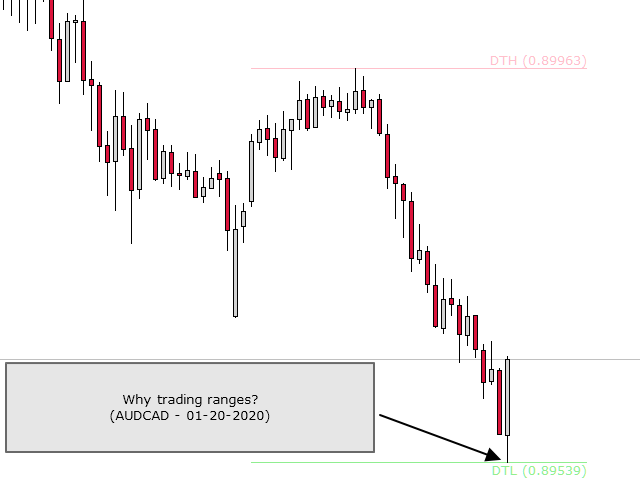
The intention of the dashboard is to provide a quick overview of the daily, weekly and monthly range of configured assets. In "single asset mode" the dashboard shows you possible reversal points directly in the chart, thus making statistics directly tradable. If a configured threshold is exceeded, the dashboard can send a screen alert, a notification (to the mobile MT5) or an email.
There are various ways of using this information. One approach is that an asset that has completed nearly 100% of its average daily movement shows a tendency to reverse. Another approach is to observe the assets, which has a very low volatility compared to the average. Now the challenge is to trade the breakout from this low volatility.
These are just two possible strategies for which the dashboard can be an important aid. Discover the possibilities!
For full description of the controls, please watch my blog entry (https://www.mql5.com/en/blogs/post/732999).
This is the MT5-Version of the ADR-Dashboard. If you want to have it for MT4, go to https://www.mql5.com/en/market/product/33805

Very good product. If you know how to use ADR, this is the best. And the owner is very responsive and very helpful.