• Información general
  • Comentarios
  • Discusión

TMoney Interquarile Range I

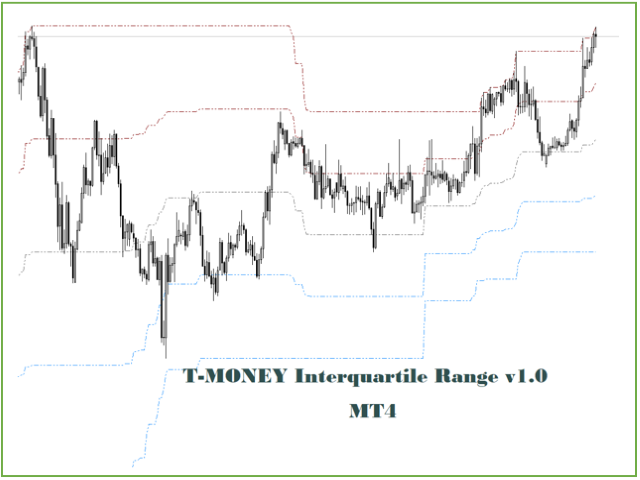
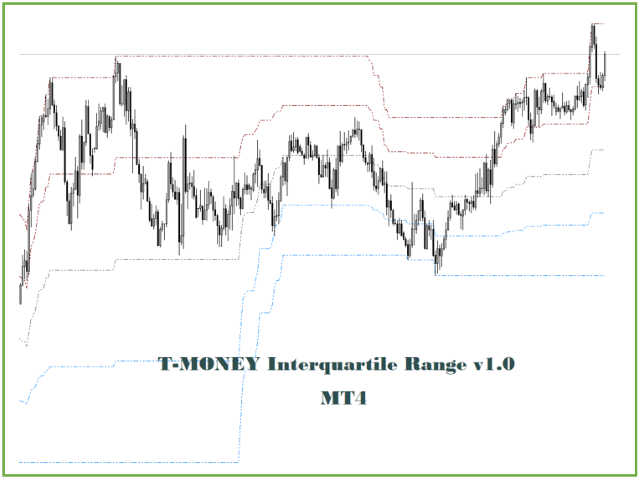
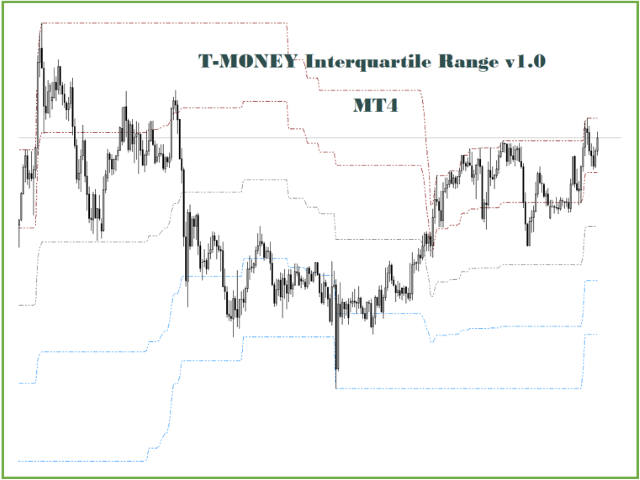
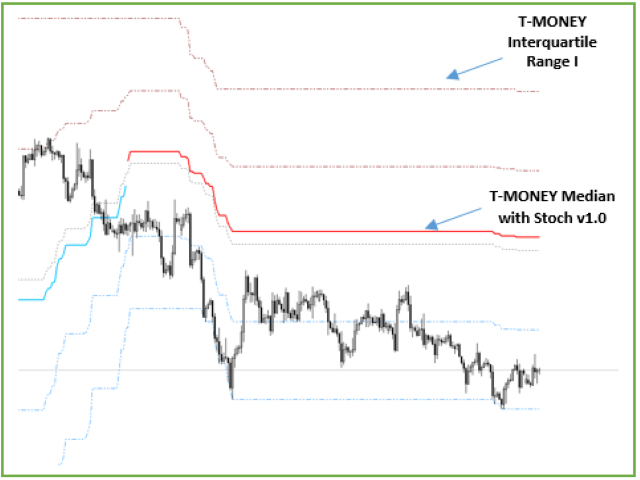
El presente indicador grafica canales formados por el Máximo Local y Mínimo Local de "n" períodos y a partir de dicho canal agrega la Mediana y el Rango Intercuartil. Es importante destacar que cuando el precio entra en rango, el rango intercuartil se reduce considerablemente respecto a su nivel histórico, lo que puede ser advertido visualmente con este indicador y el operador tendrá la posibilidad de decidir mantenerse al margen de las operaciones en dichas condiciones de mercado.

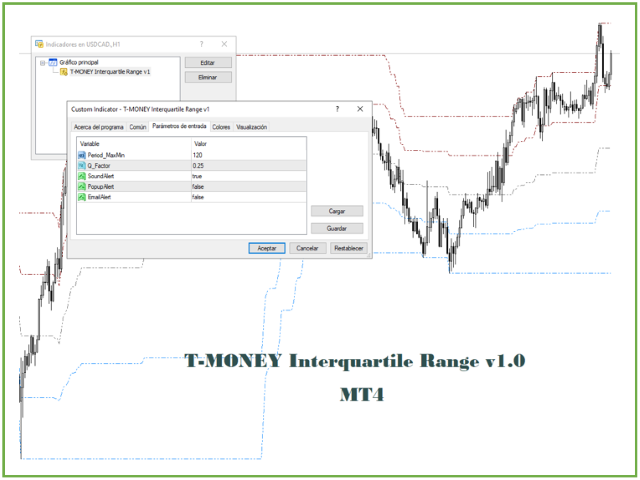
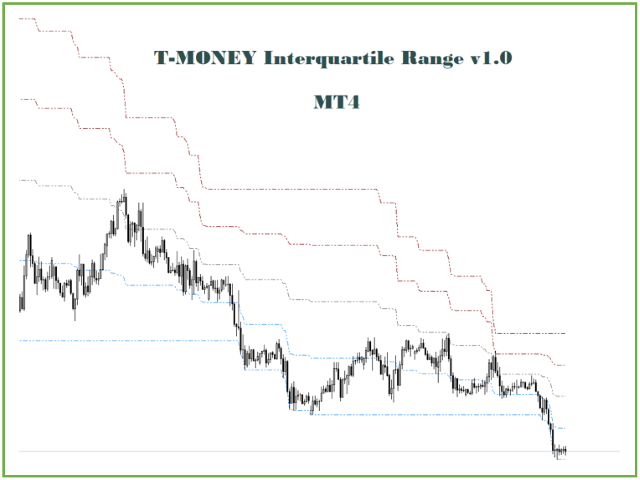
El Factor Q (por default en 0.25 por tratarse de cuartiles), puede ajustarse a las necesidades del operador para mostrar zonas de máximos y mínimos mas ajustadas (ver capturas de pantalla).

Productos recomendados
Tract
Andriy Sydoruk
Tract - Channel indicator, by which you can place orders like a classic channel indicator. Trading can be carried out inside the channel when the price reaches its borders and turns in the opposite direction from them. In such cases, reversal strategies are used. The channel indicator is designed to work with support and resistance levels and help traders find opportunities to enter the market. Another way to trade a breakout - assumes a situation when the price, upon reaching one or another cha
Flip Flops
Tatiana Savkevych
The Flip Flop indicator tracks market trends, ignoring sharp fluctuations and market noise. The indicator can work both for entry points and as a filter. The Flip Flop indicator displays information in a visual way. Helps in finding entry points during analysis. Suitable for trading on small time frames because it ignores sudden price spikes or corrections in price movements by reducing market noise around the average price.
Utility for show on charts the visual informations about: - a vertical line at start of each bar of selected timeframe - a vertical line at start of each day - a vertical line at start of each week - vertical lines at start / end of trading sessions selected - bid / ask prices, spread, money value for each point (of 1 standard lot) and last tick time recived" You can enable / disable each information and set the color for each line
FREE
Robust Filter
Aleksey Ivanov
5 (1)
The Robust filter   indicator is based on the robust filtering algorithm developed by the author using the multi-period averaged moving median. The algorithm for this averaging is shown in the last screenshot.                The indicator calculates and shows: 1. The direction of the trend; 2. Entry and exit points of positions; 3. StopLoss   lines calculated from current price probability distributions and selected probability of closing an order by StopLoss before the trend revers
PnF Charts
Marcin Konieczny
5 (1)
This indicator displays Point & Figure charts (PnF charts) in the indicator window. PnF charts show only price movements that are bigger than the specified box size. It helps to eliminate noise and allows focusing on main trends. Time is not a factor here. Only price movements are taken into account. That is why PnF chart is not synchronized with the main chart it is attached to. More about PnF charts: http://stockcharts.com/school/doku.php?id=chart_school:chart_analysis:pnf_charts Indicator wor
FREE
Hot Zones
Innovicient Limited
This indicator simplifies your entry zones by displaying the areas where you can plan your entry that potentially could give you high risk/reward ratios. Other than picking the most optimal entry points, the Hot Zone indicator can act as your typical support/resistance indicator for pullbacks for all timeframes. You can use this indicator as the only trading indicator or use it with another indicator for reentry purposes.  Besides, when using Hot Zones, the risk/reward ratio should be well abov
Alert Stochastic
Eadvisors Software Inc.
Modification of the Stochastic indicator with several types of alerts added to aid in your search for better opportunities in the market. Product Features Email Alert Sound alert Push Notification (Alerts can be sent to your mobile phone) Signs on chart Alert box Indicator Parameters Push Notification - This option enables your MetaTrader 4 to send alerts to your smartphone (IOS or Android). Email Alert - Configure your alerts to receive in your e-mail adress. SignOnChart - Enable drawing aler
BotAGI MT4
Franck Martin
4.31 (35)
BotAGI is the first next-generation AGI Forex robot. It is a basic version of BotGPT, simplified and without options, it is ideal for beginners. Its success rate is exceptional, download it and see the results for yourself ! Tested on (EURUSD) , find its   backtest in the video below .  Is an intraday, he prefers to take his time and not miss his target. It performs an average of 5 to 15 transactions per month. Why use BotAGI: The EA is an extremely simplified version of BotGPT,   a basic ver
FREE
This is a professional multi currency tool. Its main purpose is semi-automatic Forex trading following Elder's Triple Screen strategy. Its wide functionality and ability to quickly change some essential parameters makes it an ideal market interpretation tool, which is indispensable in the common trade analysis. Its main advantage is almost unlimited number of simultaneously analyzed instruments. If the potential technical limits of your monitor resolution allow, multiple indicators can be used.
The YFX Symbol Selector indicator is used to easily change the chart symbol and period with a click of a button. This is done by using a selector GUI object that can be placed on any corner of the chart. The GUI selector contains the following information: Descriptive header for GUI selector panel Symbol information and controls for changing the chart symbol Period information and controls for changing the chart period Footer containing the current bid/ask quote for the currently selected symbol
Weis Wave Indicator
Dhabaleswar Prasad Jena
This indicator is based on the Weis wave principle of wave volume. Below are few features of the indicator It draws the wave on the chart while the accumulated volume per wave in a different window at the bottom of the chart You can configure the turning point move It displays the accumulated volume (in thousands, eg for 15000 volume it will show 15) at the end of each wave You can also configure to show number of candles in the wave along with the wave volume The indicator calculates the distin
HighLowOpenClose
Ahmet Metin Yilmaz
HLOC Trend Indicator This indicator helps you to determine trend direction on your trade. Default parameters for H1 time frame. You can use this indicator both bigger time frame and smaller time frame to open a trade. The calculation is based on high, low, opening and closing price values of each bar in the selected time period. When the values found in the Indicator custom formula are exceeded, the buy or sell signal falls on the screen. There are two extern inputs; RiskFactor: Early but risky
HLOCTrend
Ahmet Metin Yilmaz
HLOC Trend Indicator This indicator helps you to determine trend direction on your trade. Default parameters for H1 time frame. You can use this indicator both bigger time frame and smaller time frame to open a trade. The calculation is based on high, low, opening and closing price values of each bar in the selected time period. When the values found in the Indicator custom formula are exceeded, the buy or sell signal falls on the screen. There are two extern inputs; RiskFactor: Early but risky
FRB Time MT4
Fernando Baratieri
FRB Time - FRB Trader Indicator that shows the server's time of operation. You can edit the font color and size of the timetable. Settings font color Font size Background color To move the Timetable, just click on it and move the mouse to where you want to leave it. After placing the Time where you want it, click again or press "ESC" and the time will stay where you left it.
Crosshair Local Time
Alberto Gauer Borrego
If you ever wanted to know your local time (or NY time) at any bar on the chart without needing to waste time with mental calculations, look no further. This indicator creates a crosshair which you can drag anywhere on the chart and will show you the local time in a label on top of the time axis. Press the "c" key to show/hide the crosshair. Left click it to pick it up and drag anywhere, left click again let it go. You can't hide the crosshair without letting it go first. Time setting inputs
MT4CandleTime index introduction MT4CandleTime is an indicator for the MT4 platform, which can display the remaining time of the current K line in the form of an intuitive digital countdown, which is convenient for traders to grasp the trading rhythm. Precise time control: The MT4CandleTime indicator provides traders with extremely accurate K-line remaining time data, enabling them to fine manage the time rhythm in the trading process, avoiding the hasty or delayed trading decisions caused by
Advanced Signal System is an indicator that generates trade arrows. It generates trade arrows with its own algorithm. These arrows give buying and selling signals.  Can be used in all pairs. Sends a signal to the user with the alert feature. The indicator certainly does not repaint. Trade rules Enter the signal when the buy signal arrives. In order to exit from the transaction, an opposite signal must be received. It is absolutely necessary to close the operation when an opposite signal is rece
Este indicador sigue la tendencia del mercado con una confiabilidad inigualable, al ignorar las fluctuaciones repentinas y el ruido del mercado. Ha sido diseñado para intercambiar gráficos intradía de tendencia y plazos pequeños. Su relación ganadora es de alrededor del 85%. [ Guía de instalación | Guía de actualización | Solución de problemas | FAQ | Todos los productos ] Increíblemente fácil de comerciar Encuentra situaciones de sobreventa / sobrecompra Disfrute de operaciones sin ruido en to
CAP Channel Trading
MEETALGO LLC
3.87 (122)
The CAP Channel Trading is a volatility-based indicator that makes use of the “advanced envelope theory”. These envelopes consist of two outer lines. Envelope theory states that the market price will generally fall between the boundaries of the envelope (or channel). If prices move outside the envelope, it is a trading signal or trading opportunity. Benefits of the Channel Trading Indicator CAP Channel Trading works with any asset It can be applied to any financial assets: forex, cryptocurren
FREE
KT Advanced Ichimoku MT4
KEENBASE SOFTWARE SOLUTIONS
KT Advance Ichimoku plot the arrows and provide alerts for the four trading strategies based on Ichimoku Kinko Hyo indicator. The generated signals can be filtered by other Ichimoku elements.  Four Strategies based on the Ichimoku Kinko Hyo 1.Tenkan-Kijun Cross Buy Arrow: When Tenkan-Sen cross above the Kijun-Sen. Sell Arrow: When Tenkan-Sen cross below the Kijun-Sen. 2.Kumo Cloud Breakout Buy Arrow: When price close above the Kumo cloud.  Sell Arrow: When price close below the Kumo cloud. 3.C
LordAutoFibonnaci
Igor Pereira Calil
5 (2)
Lord Auto Fibonnaci is a free indicator for Meta Trader, in order to show the most famous chart in the financial market known as "Fibonnaci". As we can see in the images below, the fibonnaci table will automatically analyze the graph for you, with trend factors through percentage, almost infallible use, you can always work when the percentage is low or high, start shopping and sales on time, great for analyzing entries! In the images below we can see an example in gold in H4, where we are at
FREE
The system automatically draws resistance and support lines, The system automatically draws resistance and support lines, so you can see at a glance the price range where you are most likely to encounter resistance. Therefore, you can trade in price zones where you are less likely to encounter resistance. We are live-streaming the actual operation of the system. Please check for yourself if it is usable. Please check it out for yourself. https://www.youtube.com/@ganesha_forex We do not guaran
Tipu Trend
Kaleem Haider
4.5 (8)
Tipu Trend is a non-lag, non-repaint, smart indicator, that shows the trend of selected time frames. Features Customizable Buy/Sell alerts, push alerts, email alerts, or visual on-screen alerts. As easy to trade indicator that smooths the noise in the price action. Highlights ranging markets. Add Tipu Panel (found here ) and unlock the following additional features. An easy to use Panel that shows the trend + signal of the selected time frames. Customizable Panel. The panel can be moved to any
FREE
ATR Channels
Ahmet Metin Yilmaz
ATR Channel is an indicator. It shows us ATR ( depends on selected period ) Line on main chart. It also draw 3 up ATR channels (ATRu) and 3 down ATR channels (ATRd) on the same window. All they helps you to trade with a ATR indicator. There are 6 extern inputs; PeriodsATR   : You can change ATR Period default is 13. MA_Periods   : Use for draw ATR channels MA periods. Default is 34. MA_Type       : You can change MA_method here. Default is Linear weighted. Mult_Factor1 : It is for first up and d
Vous pouvez   par exemple   surveiller le croisement MA en D1, pour la tendance de fond, les niveaux de surachat et de survente du RSI en H4 et du Stochastique en H4. Cet indicateur surveille: les croisement de moyennes mobiles le niveau de surachat / survente du RSI le niveau de surachat / survente du stochastique IL vous alerte quand les trois filtres correspondent à vos paramètres (push, pop, mail) Vous pouvez choisir de l’utiliser sur un graphique pour une seule unité ou suivre plusieurs p
Marker Bands
Ramon Sobrevals Arce
4 (1)
This indicator consists in two different algorithms, in order to profit all fast movements created during noises of the market. First of all, it plots normalized trend bands to can filter the possible trades. The normalized trend bands are calcualted using an exclusive mathematical algorithm to has both the correct trend and the fast adaptability to the change of trends. With those bands you can know when you are inside the trend, or when you are outside. The second alhorithm uses a private fo
Rule Plotter Expert MT4
Francisco Gomes Da Silva
5 (1)
Operando tus Estrategias Creadas con Rule Plotter Indicador con Rule Plotter Expert: Ya has creado tus estrategias personalizadas utilizando Rule Plotter Indicador y has visualizado las flechas que indican puntos de entrada y salida en el gráfico, ahora es momento de dar vida a esas estrategias en los mercados financieros. Con Rule Plotter Expert, puedes operar de manera autónoma y precisa basándote en esas flechas, aprovechando al máximo el potencial de tus estrategias. Transformando Flechas en
FREE
This is a new strategy for SUPPLY DEMAND areas It is based on a calculation using the tick volume to detect the big price action in market for both bear /bull actions this smart volume action candles are used to determine the supply and demand areas prices in between main supply and demand lines indicate sideway market  up arrows will be shown when prices moves above the main supply and the secondary supply lines Down arrows will be shown when prices moves below the main demand and the secondary
To get access to MT5 version please click here . - This is the exact conversion from TradingView: "Twin Range Filter" by "colinmck". - The screenshot shows similar results from tradingview and Metatrader when tested on ICMarkets on both platforms. - This is a light-load processing and non-repaint indicator. - All input options are available.  - Buffers are available for processing in EAs. - You can message in private chat for further changes you need. Here is the sample code of EA that operates
TMoney TrendCycle MTF
Moises Orlando Urbina Sojo
El presente indicador es similar a TrendCycle pero permite graficar en cualquier TimeFrame el ciclo-tendencia de un TimeFrame Superior. Por ejemplo, puede incluir en el TimeFrame H1, el ciclo-tendencia correspondiente a H4 o D1. Esto es de particular importancia para los operadores Swing o que buscan tendencias de mediana duración. Puede utilizarse como indicador de apoyo para confirmar tendencias o cambios de tendencia de mediano plazo y evitar las falsas rupturas.
Los compradores de este producto también adquieren
Gann Made Easy
Oleg Rodin
4.79 (109)
Gann Made Easy es un sistema de comercio de Forex profesional y fácil de usar que se basa en los mejores principios de comercio utilizando la teoría del Sr. W. D. Gann. El indicador proporciona señales precisas de COMPRA y VENTA, incluidos los niveles de Stop Loss y Take Profit. Puede comerciar incluso sobre la marcha utilizando notificaciones PUSH. ¡Por favor, póngase en contacto conmigo después de la compra! ¡Compartiré mis consejos comerciales con usted y excelentes indicadores de bonificació
Dynamic Forex28 Navigator
Bernhard Schweigert
5 (4)
Dynamic Forex28 Navigator: la herramienta de trading de Forex de última generación. ACTUALMENTE CON UN 49 % DE DESCUENTO. Dynamic Forex28 Navigator es la evolución de nuestros indicadores populares de larga data, que combina el poder de tres en uno: Indicador avanzado Currency Strength28 (695 reseñas) + Indicador avanzado Currency IMPULSE con ALERT (520 reseñas) + Señales combinadas CS28 (bonificación). Detalles sobre el indicador https://www.mql5.com/en/blogs/post/758844 ¿Qué ofrece el indi
-   Real price is 80$   - 40% Discount ( It is 49$ now ) - Lifetime update free Contact me for instruction, add group and any questions! Related Products:  Bitcoin Expert , Gold Expert - Non-repaint - I just sell my products in Elif Kaya profile, any other websites are stolen old versions, So no any new updates or support. Introduction The breakout and retest strategy is traded support and resistance levels. it involves price breaking through a previous level.  The break and retest strategy is
Scalper Inside PRO
Alexey Minkov
4.75 (61)
!SPECIAL SALE!  An exclusive indicator that utilizes an innovative algorithm to swiftly and accurately determine the market trend. The indicator automatically calculates opening, closing, and profit levels, providing detailed trading statistics. With these features, you can choose the most appropriate trading instrument for the current market conditions. Additionally, you can easily integrate your own arrow indicators into Scalper Inside Pro to quickly evaluate their statistics and profitability
FX Levels MT4
Daniel Stein
5 (2)
FX Levels: Zonas de Soporte y Resistencia con Precisión Excepcional para Todos los Mercados Resumen Rápido ¿Busca una manera confiable de identificar niveles de soporte y resistencia en cualquier mercado — ya sean divisas, índices, acciones o materias primas? FX Levels combina el método tradicional “Lighthouse” con un enfoque dinámico vanguardista, ofreciendo una precisión casi universal. Gracias a nuestra experiencia real con brokers y a las actualizaciones automáticas diarias más las de tiem
IX Power MT4
Daniel Stein
4.67 (6)
IX Power: Descubre perspectivas de mercado para índices, materias primas, criptomonedas y forex Descripción general IX Power es una herramienta versátil diseñada para analizar la fortaleza de índices, materias primas, criptomonedas y símbolos de forex. Mientras que FX Power ofrece la máxima precisión para pares de divisas mediante el uso de datos de todos los pares disponibles, IX Power se centra exclusivamente en los datos del mercado del símbolo subyacente. Esto convierte a IX Power en una e
FX Power MT4 NG
Daniel Stein
4.94 (18)
FX Power: Analiza la Fuerza de las Divisas para Decisiones de Trading Más Inteligentes Descripción General FX Power es tu herramienta esencial para comprender la fuerza real de las principales divisas y el oro en cualquier condición de mercado. Al identificar divisas fuertes para comprar y débiles para vender, FX Power simplifica las decisiones de trading y descubre oportunidades de alta probabilidad. Ya sea que quieras seguir las tendencias o anticipar reversiones utilizando valores extremos
FX Volume
Daniel Stein
4.59 (34)
FX Volume: Experimente el Verdadero Sentimiento del Mercado desde la Perspectiva de un Bróker Resumen Rápido ¿Desea llevar su estrategia de trading a otro nivel? FX Volume ofrece información en tiempo real sobre cómo los traders minoristas y los brókers están posicionados, mucho antes de que aparezcan informes retrasados como el COT. Ya sea que busque beneficios consistentes o simplemente quiera una ventaja más profunda en los mercados, FX Volume le ayuda a identificar desequilibrios important
Gold Venamax MT4
Sergei Linskii
5 (1)
Gold Venamax : este es el mejor indicador técnico de acciones. El algoritmo del indicador analiza el movimiento del precio de un activo y refleja la volatilidad y las posibles zonas de entrada. Características del indicador: Este es un súper indicador con Magia y dos bloques de flechas de tendencia para un comercio cómodo y rentable. El botón rojo para cambiar de bloque se muestra en el gráfico. La magia se establece en la configuración del indicador, por lo que puede instalar el indicador en
Scalper Vault
Oleg Rodin
5 (28)
Scalper Vault es un sistema profesional de reventa que le brinda todo lo que necesita para una reventa exitosa. Este indicador es un sistema comercial completo que puede ser utilizado por operadores de divisas y opciones binarias. El marco de tiempo recomendado es M5. El sistema le proporciona señales de flecha precisas en la dirección de la tendencia. También le proporciona señales superiores e inferiores y niveles de mercado de Gann. Los indicadores proporcionan todo tipo de alertas, incluidas
Advanced Supply Demand
Bernhard Schweigert
4.91 (294)
¡Actualmente con 33% de descuento! ¡La mejor solución para cualquier tráder principiante o experto! Este indicador es una herramienta comercial única, de alta calidad y asequible, porque incorpora una serie de características patentadas y una nueva fórmula. Con esta actualización, podrá mostrar zonas de doble marco temporal. No solo podrá mostrar un marco temporal más alto, sino también mostrar ambos, el marco temporal del gráfico MÁS el marco temporal más alto: MOSTRANDO ZONAS ANIDADAS. A todos
Currency Strength Exotics
Bernhard Schweigert
4.87 (31)
¡ACTUALMENTE 20% DE DESCUENTO ! ¡La mejor solución para cualquier operador novato o experto! Este indicador está especializado en mostrar la fuerza de la divisa para cualquier símbolo como Pares Exóticos, Materias Primas, Índices o Futuros. Es el primero de su clase, cualquier símbolo se puede añadir a la 9 ª línea para mostrar la verdadera fuerza de la moneda de Oro, Plata, Petróleo, DAX, US30, MXN, TRY, CNH etc. Se trata de una herramienta de trading única, de alta calidad y asequible porqu
Easy Breakout
Mohamed Hassan
5 (9)
After your purchase, feel free to contact me for more details on how to receive a bonus indicator called VFI, which pairs perfectly with Easy Breakout for enhanced confluence!   Easy Breakout is a powerful price action trading system built on one of the most popular and widely trusted strategies among traders: the Breakout strategy ! This indicator delivers crystal-clear Buy and Sell signals based on breakouts from key support and resistance zones. Unlike typical breakout indicators, it levera
Pruebe "Chart Patterns All in One" en modo demo y obtenga un bono. Envíeme un mensaje después de probarlo en modo demo para recibir su bono. Deja un comentario después de la compra para recibir 8 indicadores de alta calidad como bono. El indicador Chart Patterns All-in-One ayuda a los traders a visualizar varios patrones de gráficos comúnmente utilizados en el análisis técnico. Este indicador apoya la identificación de posibles comportamientos del mercado, pero no garantiza rentabilidad. Se rec
System Trend Pro
Aleksandr Makarov
5 (2)
System Trend Pro - This is the best trend trading indicator!!! You can get this indicator for free -  Quantum Entry PRO The indicator no repaint!!!   The indicator has   MTF   mode, which adds confidence to trading on the trend (   no repaint   ). How to trade? Everything is very simple, we wait for the first signal (big arrow), then wait for the second signal (small arrow) and enter the market in the direction of the arrow. (See screens 1 and 2.) Exit on the opposite signal or take 20-30 pips
Golden Trend Indicator
Noha Mohamed Fathy Younes Badr
4.9 (10)
Golden Trend indicator  is The best indicator for predicting trend movement this indicator never lags and never repaints and never back paints    and give  arrow buy and sell    before the candle appear  and it will help you and  will make your trading decisions clearer its work on all currencies and  gold and crypto and all time frame This unique  indicator uses very secret algorithms to catch the  trends, so you can trade using this indicator and see the trend clear on charts  manual guide and
Ante todo, vale la pena enfatizar que esta Herramienta de Trading es un Indicador No Repintado, No Redibujado y No Retrasado, lo que la hace ideal para el trading profesional. Curso en línea, manual del usuario y demostración. El Indicador de Conceptos de Acción del Precio Inteligente es una herramienta muy potente tanto para traders nuevos como experimentados. Combina más de 20 indicadores útiles en uno solo, combinando ideas avanzadas de trading como el Análisis del Trader del Círculo Interio
Trend Screener
STE S.S.COMPANY
4.78 (93)
Indicador de tendencia, solución única e innovadora para el comercio y filtrado de tendencias con todas las funciones de tendencias importantes integradas en una sola herramienta. Es un indicador 100% sin repintar de marcos temporales y monedas múltiples que se puede usar en todos los símbolos/instrumentos: divisas, materias primas, criptomonedas, índices y acciones. OFERTA POR TIEMPO LIMITADO: El indicador de detección de soporte y resistencia está disponible por solo 50$ y de por vida. (Precio
Special offer : ALL TOOLS , just $35 each! New tools   will be   $30   for the   first week   or the   first 3 purchases !  Trading Tools Channel on MQL5 : Join my MQL5 channel to update the latest news from me Presentamos el revolucionario RSI Kernel Optimized with Scanner, una herramienta de vanguardia que redefine el análisis tradicional de RSI al integrar el poderoso algoritmo de Estimación de Densidad de Núcleo (KDE). Este avanzado indicador no solo proporciona información en tiempo real s
Legacy of Gann
Pavel Zamoshnikov
4.83 (12)
The indicator very accurately determines the levels of the possible end of the trend and profit fixing. The method of determining levels is based on the ideas of W.D.Gann, using an algorithm developed by his follower Kirill Borovsky. Extremely high reliability of reaching levels (according to K. Borovsky  - 80-90%) Indispensable for any trading strategy – every trader needs to determine the exit point from the market! Precisely determines targets on any timeframes and any instruments (forex, met
TPSpro RFI Levels
Roman Podpora
4.85 (27)
INSTRUCCIONES      RUSO  -  ING     Se recomienda utilizar con un indicador.   -    TPSpro   TENDENCIA PRO -   Versión MT5 Un elemento clave en el trading son las zonas o niveles desde los que se toman las decisiones de compra o venta de un instrumento de trading. A pesar de los intentos de los principales actores de ocultar su presencia en el mercado, inevitablemente dejan rastros. Nuestra tarea era aprender a identificar estos rastros e interpretarlos correctamente. Funciones principales: ¡Mo
Gold Stuff
Vasiliy Strukov
4.86 (249)
Gold Stuff: un indicador de tendencia diseñado específicamente para el oro, también se puede usar en cualquier instrumento financiero. El indicador no se vuelve a dibujar ni se retrasa. El marco de tiempo recomendado es H1. Este indicador está escrito por EA Gold Stuff Advisor, puede encontrarlo en mi perfil.  Puede obtener una copia gratuita de nuestro indicador Strong Support y Trend Scanner, por favor envíe un mensaje privado. ¡a mí! IMPORTANTE! Póngase en contacto conmigo inmediatamente de
Bull versus Bear
Mohamed Hassan
4.5 (18)
Send us a message after your purchase to receive more information on how to get your  BONUS  for FREE  that works in great combination with Bull vs Bear ! Bull versus Bear is an easy-to-use Forex indicator that gives traders clear and accurate signals based on clear trend retests . Forget about lagging indicators or staring at charts for hours because  Bull vs Bear provides real-time entries with no lag and no repaint, so you can trade with confidence. Bull vs Bear  helps you enter trades durin
ACTUALMENTE 31% DE DESCUENTO Este indicador es una herramienta de transacción única, de alta calidad y asequible porque hemos incorporado una serie de características propias y una fórmula secreta. Con solo un gráfico, da Alertas para los 28 pares de divisas. ¡Imagina cómo mejorarás porque puedes identificar el punto de activación exacto de una nueva tendencia u oportunidad de crecimiento! Basado en nuevos algoritmos subyacentes , hace que sea aún más fácil identificar y confirmar operaciones po
Special offer : ALL TOOLS , just $35 each! New tools   will be   $30   for the   first week   or the   first 3 purchases !  Trading Tools Channel on MQL5 : Join my MQL5 channel to update the latest news from me ¡Descubre el poder del concepto de Inversion Fair Value Gap (IFVG) de ICT con el Inversion Fair Value Gaps Indicator ! Esta herramienta de última generación lleva los Fair Value Gaps (FVG) al siguiente nivel al identificar y mostrar zonas de FVG invertidas, que son áreas clave de soporte
PZ Harmonacci Patterns
PZ TRADING SLU
3.17 (6)
Este es posiblemente el indicador de reconocimiento automático de formación de precios más completo que puede encontrar para la plataforma MetaTrader. Detecta 19 patrones diferentes, toma las proyecciones de Fibonacci tan en serio como usted, muestra la zona de reversión potencial (PRZ) y encuentra niveles adecuados de stop-loss y take-profit. [ Guía de instalación | Guía de actualización | Solución de problemas | FAQ | Todos los productos ] Detecta 19 formaciones de precios armónicos diferen
Automated Trendlines
Georgios Kalomoiropoulos
5 (16)
Las líneas de tendencia son la herramienta más esencial del análisis técnico en el comercio de divisas. Desafortunadamente, la mayoría de los comerciantes no los dibujan correctamente. El indicador de líneas de tendencia automatizadas es una herramienta profesional para comerciantes serios que lo ayuda a visualizar el movimiento de tendencia de los mercados. Hay dos tipos de Trendlines Bullish Trendlines y Bearish Trendlines. En la tendencia alcista, la línea de tendencia de Forex se dibuja a
ACTUALMENTE 26% DE DESCUENTO ¡La mejor solución para cualquier operador novato o experto! Este indicador es una herramienta única, de alta calidad y asequible porque hemos incorporado una serie de características propias y una nueva fórmula. ¡Con sólo UN gráfico puede leer la Fuerza de la Divisa para 28 pares de Divisas! Imagínese cómo mejorará su operativa porque podrá señalar el punto exacto de activación de una nueva tendencia o de una oportunidad de scalping. Manual del usuario: haga cli
Stratos Pali
Michela Russo
5 (1)
Stratos Pali Indicator   is a revolutionary tool designed to enhance your trading strategy by accurately identifying market trends. This sophisticated indicator uses a unique algorithm to generate a complete histogram, which records when the trend is Long or Short. When a trend reversal occurs, an arrow appears, indicating the new direction of the trend. Important Information Revealed Leave a review and contact me via mql5 message to receive My Top 5 set files for Stratos Pali at no cost! Dow
TPSproTREND PrO
Roman Podpora
4.71 (28)
TPSpro TREND PRO   es un indicador de tendencia que analiza automáticamente el mercado y proporciona información sobre la tendencia y cada uno de sus cambios, además de dar señales para ingresar operaciones sin volver a dibujar. El indicador utiliza cada vela, analizándolas por separado. refiriéndose a diferentes impulsos: impulso hacia arriba o hacia abajo. ¡Puntos de entrada exactos a transacciones de divisas, criptomonedas, metales, acciones e índices! Versión MT5                   DESCRIPCIÓ
Otros productos de este autor
TMoney TrendCycle
Moises Orlando Urbina Sojo
El indicador grafica la tendencia a partir de una EMA de "n" períodos y el ciclo a partir de otra EMA de "k" períodos de la EMA anterior. Esto permite que los cruces sean mucho más efectivos y la amplitud del ciclo permite verificar la fuerza de la tendencia. Este indicador debe ser utilizado como herramienta complementaria para confirmar señales de entrada a mercado. Es posible agregar tres veces el indicador aplicado a precio máximo, precio mínimo y mediana del precio en TimeFrame de una hora
TMoney TrendCycle MTF
Moises Orlando Urbina Sojo
El presente indicador es similar a TrendCycle pero permite graficar en cualquier TimeFrame el ciclo-tendencia de un TimeFrame Superior. Por ejemplo, puede incluir en el TimeFrame H1, el ciclo-tendencia correspondiente a H4 o D1. Esto es de particular importancia para los operadores Swing o que buscan tendencias de mediana duración. Puede utilizarse como indicador de apoyo para confirmar tendencias o cambios de tendencia de mediano plazo y evitar las falsas rupturas.
TMoney AutoTrends
Moises Orlando Urbina Sojo
El indicador identifica y gráfica las tendencias relevantes (UpTrend y DownTrend) tomando los mínimos y/o máximos relevantes del mercado. Asimismo, proyecta la dirección correspondiente de la tendencia que se constituyen en niveles de apoyo para lo toma de decisiones de operación. Una buena práctica utilizando estas tendencias es operar en las rupturas, ya sea si éstas se confirman y se genera una tendencia contraria o si el precio se reincorpora a la tendencia original luego de una falsa ruptur
TMoney Median with Stoch
Moises Orlando Urbina Sojo
Este indicador grafica la Mediana de "n" períodos y confirma los cruces con el Oscilador Estocástico. Se trata de un indicador que combina la Mediana como nivel determinante del ciclo del precio y el Oscilador Estocástico para la confirmación de los cruces. Debe utilizarse como indicador complementario o de apoyo con Acción del Precio u otras estrategias para validar las entradas a mercado.
TMoney Interquartile Range II
Moises Orlando Urbina Sojo
El presente indicador es similar a "T-MONEY Interquartile I" pero está normalizado (en escala de 0 a 100) y se grafica en una ventana separada. Se puede observar el rango intercuartil normalizado, la mediana y las zonas de máximos y mínimos. Como apoyo visual se ha considerado el color verde en el histograma cuando el activo cotiza por encima de la mediana configurada de "n" períodos y de color rojo cuando el activo cotiza por debajo de ésta. Al igual que su similar, este indicador debe utilizar
TMoney OrderBLockWeek
Moises Orlando Urbina Sojo
El indicador se activa al inicio de cada semana y detecta potenciales ORDERBLOCK tanto alcistas como bajistas. Estos niveles son de alta probabilidad operacional, pudiendo utilizar un ratio mínimo de 3 a 1 para maximizar las ganancias. Se recomienda utilizar órdenes pendientes en los niveles OB del gráfico y colocar el SL hasta un máximo de 20 pips del precio de entrada. Someta el indicador a Backtesting para familiarizarse con su performance y complemente con otros indicadores de tipo tendenc
TMoney OrderblockDay
Moises Orlando Urbina Sojo
El indicador se activa al inicio de cada día de operaciones y detecta potenciales ORDERBLOCK tanto alcistas como bajistas. Estos niveles son de alta probabilidad operacional, pudiendo utilizar un ratio mínimo de 3 a 1 para maximizar las ganancias. Se recomienda utilizar TimeFrame M5 a M30 para una adecuada visualización y considere órdenes pendientes en los niveles OB del gráfico y colocar el SL hasta un máximo de 20 pips del precio de entrada. Someta el indicador a Backtesting para familiariz
Filtro:
No hay comentarios
Respuesta al comentario