Supply Demand
- Indicadores
- Hafis Mohamed Yacine
- Versión: 1.0
- Activaciones: 5
Whether you are trading with indicators, or chart patterns, support and resistance or supply and demand are two main elements that you cannot ignore.
How to trade with the Automatic MT4 supply and demand indicator?
Let’s break the rules of this indicator for Buy and Sell set ups as the following:
Buy Setup – Entries, Exits, and SL
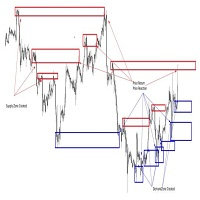
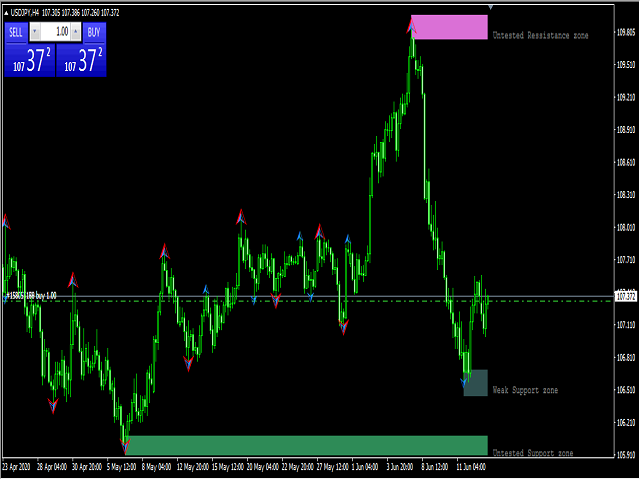
To simplify this strategy, we will be using a Supply and Demand indicator, which conveniently plots these probable supply and demand areas.
Buy Entry: To enter a buy setup, we must observe price as it touches the nearest fresh demand area. Our indicator draws this zone as a blue rectangle. Once the price touches the area, the next candle should bounce off the blue rectangle. This in itself is a strong bullish indication.
Stop Loss: The stop loss should be just a few pips below the blue rectangle.
TP1: The take profit for the first half of the position should be the 50% line in between the demand area (blue rectangle) and the nearest supply area (red rectangle).
TP2: The take profit for the remaining half of the position should be the 80% line between the demand area (blue rectangle) and the nearest supply area (red rectangle).
Trailing Stop: As soon as the price hits the first take profit target, you should trail the stop loss to breakeven plus a few pips.
Sell Setup – Entries, Exits, and SLs
Sell Entry: To enter a buy setup, we must observe price as it touches the nearest fresh supply area. The tool draws this as a red rectangle. As soon as the price touches the area, the next candle should bounce off the red rectangle. This is an indication that the price is likely to drop.
Stop Loss: The stop loss should be just a few pips above the red rectangle.
TP1: The take profit for the first half of the position should be the 50% line in between the supply area (red rectangle) and the nearest demand area (blue rectangle).
TP2: The take profit for the remaining half of the position should be the 80% line between the supply area (red rectangle) and the nearest demand area (blue rectangle).
Trailing Stop – As soon as the price hits the first take profit target, you should trail the stop loss to breakeven plus a few pips.
