TrendWavePattern
- Indicadores
- Wartono
- Versión: 2.2
- Actualizado: 6 agosto 2020
- Activaciones: 10
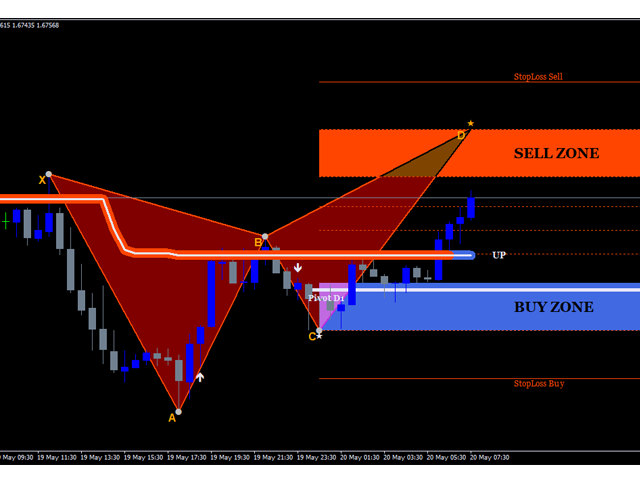
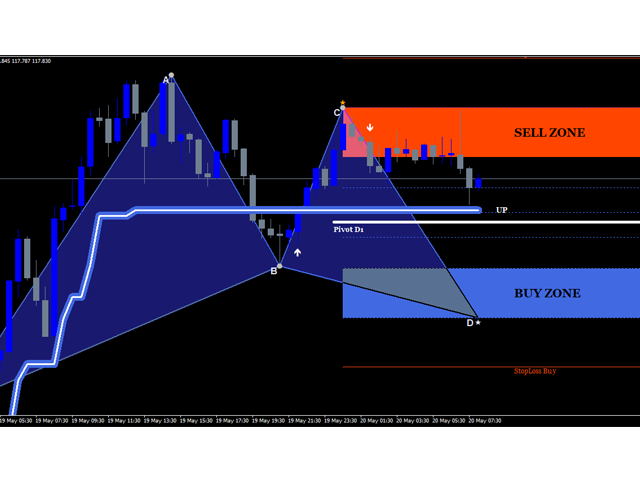
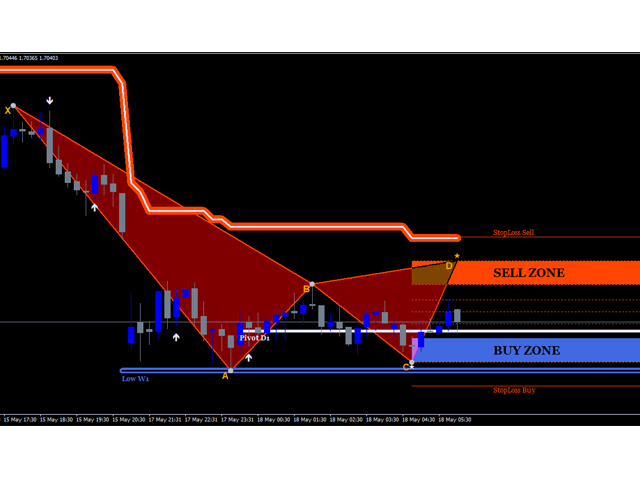
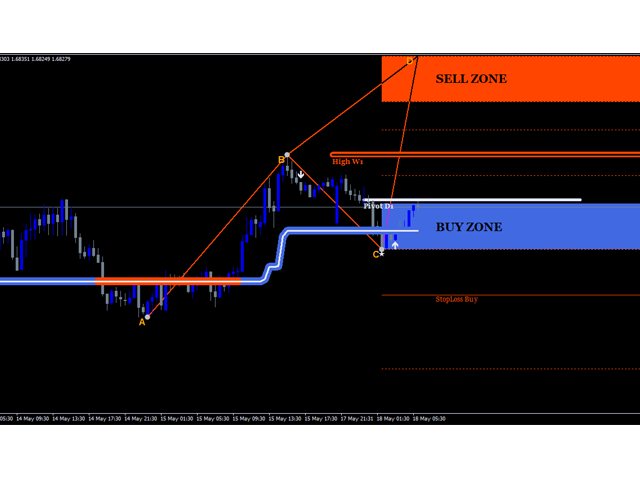
TrendWavePattern an another way to trade with a harmonic pattern, a maestro classic pattern . I made some improvements and combinations with my own strategy. Trend direction, buy-sell signal ,hi-low area and pivot line. These will be helpful for trader to read the current market condition. So it is not blindly following the pattern itself but also following other informations from the market.
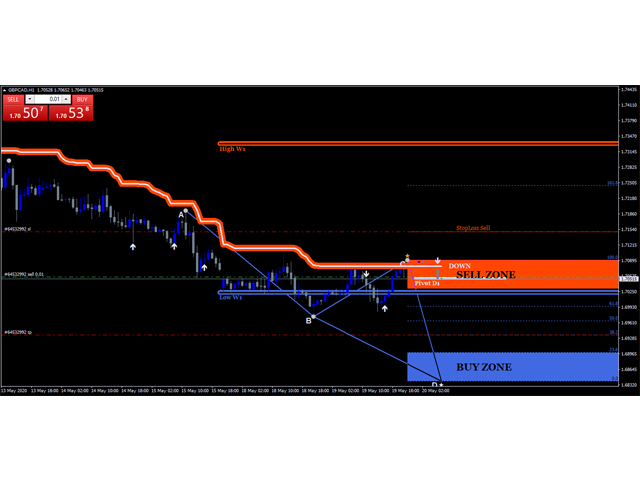
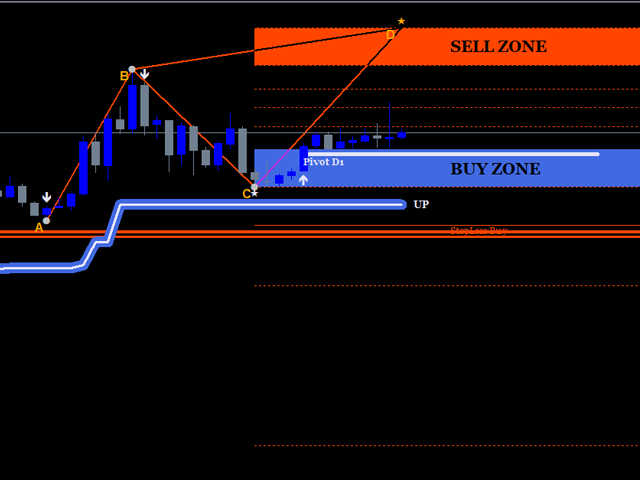
Readable chart appearance. Designed to be user friendly even you are a new trader. BUY-SELL zone, TakeProfit and StopLoss price,current market trend and current bearish and bullish pattern. There are 3 Take Profit levels defined by Fibonacci levels and single stoploss drawn up automatically when the pattern triggered .
FEATURES
- Chart Pattern
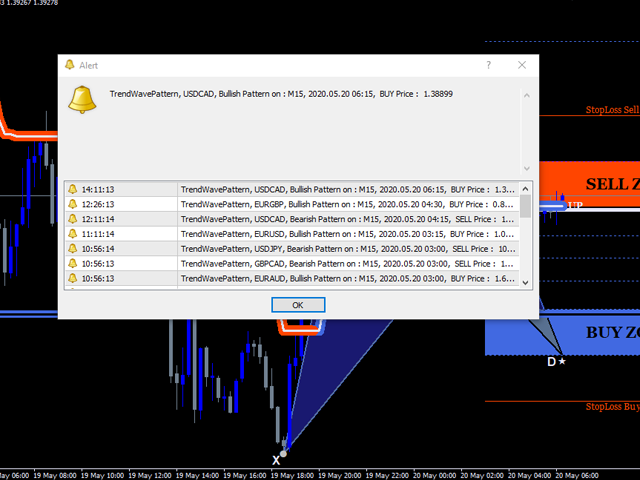
- Alert when pattern triggered
- BUY-SELL zone
- Entry signal arrow
- Multi TimeFrame Hi-Low Lines
- Multi TimeFrame Pivot Line
- Trend Line
- TakeProfit and StopLoss lines
- Easily to change color theme summarized into 2 color groups
- Hide/Show each object/buffer
TimeFrame: Recommended M5 - H4
Currency Pair: Any Currency Pair
Also we ca use it on Renko Chart
HOW TO TRADE
There are 2 ways to trade with TrendWavePattern Indicator
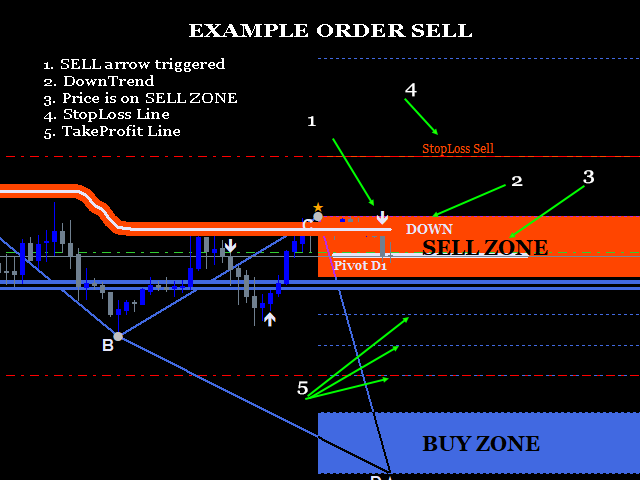
1. Follow Pattern Direction, In case BUY order ( vice versa for SELL ) :
- Bullish Pattern triggered , indicator will provide alert for this.
- Current Trend is UP Trend
- Price is on BUY ZONE , it is closely on Point D.
- Buy signal arrow triggered ( Candle Close ).
- Stop Loss on " StopLoss Buy " line
- TakeProfit on Fibonacci level between BUY ZONE and SELL ZONE. There are 3 levels of TakeProfit line. You can choose one of them or you can place 3 buy orders at the same time and price with 3 different takeprofit for each order.
- Pattern triggered ( No matter Bullish/Bearish Pattern ), indicator will provide alert for this.
- Current Trend is UP Trend
- Price is on BUY ZONE , it can be around Point D or Point C.
- Buy signal arrow triggered ( Candle Close ).
- Stop Loss on " StopLoss Buy " line
- TakeProfit on Fibonacci level between BUY ZONE and SELL ZONE. There are 3 levels of TakeProfit line. You can choose one of them or you can place 3 buy orders at the same time and price with 3 different takeprofit for each order.
PARAMETERS
- Show Target Fibo( True/False ). It is Fibonacci levels that is also TakeProfit levels
- Show Arrows (True/False ). It is entry signal arrow.
- Show Trade Zone (True/False ) . It will show /hide trade zone and StopLoss lines.
- Show Pivot ( True/False). It will will show Pivot Line
- Pivot Period. Define Pivot Period here. It can be from M1- Monthly.
- Show High Low (True/False). It is High Price and Low Price of defined TimeFrame on Point 7 below.
- High Low Period. It is a period of high low , it can be from M1-Monthly.
- Show Texts ( True/ False ). Show/Hide Texts from chart.
- Depth. It is the depth range of pattern
- Histo. The period of bars the indicator will read pattern and zz buffers.
- KPeriod , KPeriod of Stochastic
- DPeriod, D Period of Stochastic
- Slowing, Slowing of Stochastic
- Overbought, Overbought level of Stochastic
- Oversold, Oversold level of Stochastic
- ColorUP, color group of up direction
- ColorDN, color group of Down Direction
- PopUp alert ( true/false ). Alert on current device
- Mobile alert ( true / false). Alert on mobile device using Metaquotes ID
- Email Alert ( true/false ) . Alert thru email. Setting Up email alert on MT4 platform required for this way.
Please feel free to contact me or post it on comment section for any questions.

