Relative Strength Levy Classic
- Indicadores
- Bruno Goncalves Mascarenhas
- Versión: 1.1
- Actualizado: 21 mayo 2020
- Activaciones: 5
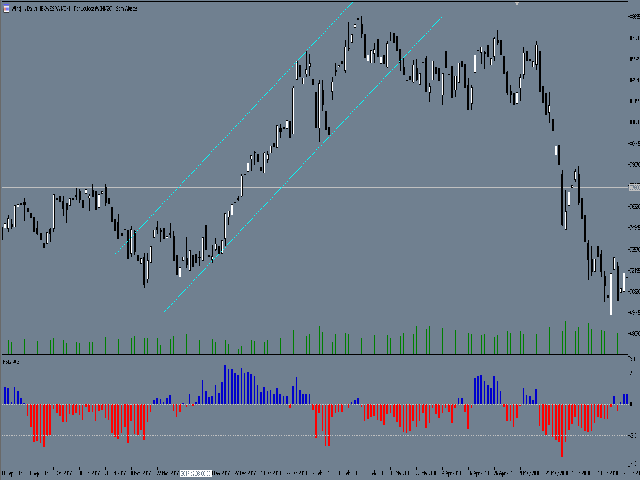
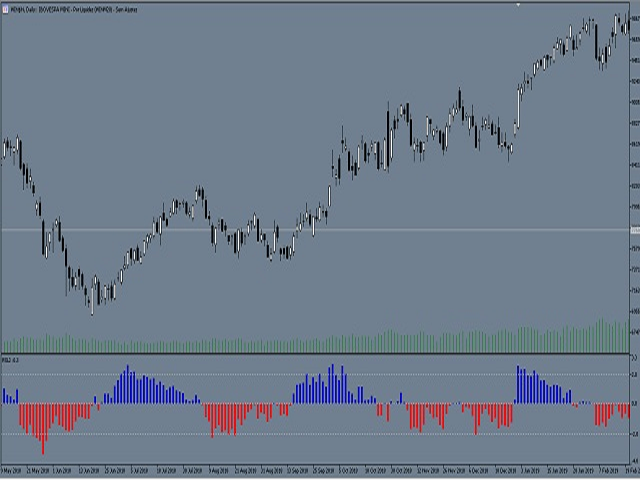
Classic RSL
This is the classic indicator "Relative Strength Levy" (RSL), according to Dr. Robert Levy's study, called "The Relative Strength Concept
of Common Stock Pricing", which was released as a hardcover book in late 60's of the last century.
Key concept
Use this indicator on various instruments to compare their relative strength: The resulting analysis values will fluctuate around 1
The strongest instruments will have the highest RSL values (above 1) and the weakest instruments will have the lowest RSL values (below
1)
You may want to buy the strongest instruments (highest RSL values) and sell the weakest instruments (lowest RSL values) to follow trends.
Resources
Works on all deadlines
Works for all instruments available in your MetaTrader 5 Market Watch window
The buffer output value is shown in the separate indicator window and the Data window.
The indicator can be used in Expert Advisors using the iCustom () function for automated trading systems.
How Dr. Levy Used RSL
Dr. Levy analyzed 200 US stocks (think S&P 200 shares) on a weekly basis and used the output value of his RSL indicator to rank the
strongest stocks (highest RSL values> 1) higher weak (lower RSL) values <1). From this resulting ranking list, he bought the
5% to 7% of the shares with the highest RSL reading. After one week, he reviewed all 200 stocks again and ranked them again according to the
RSL reading.
If a stock fell to the bottom 31% of this reclassified list (he called it "Casting Rank"), it sold the stock and then redistributed free
capital again in the 5% to 7% of the most recent. ranking. As such, he has always invested in the strongest stocks available and
reallocated his capital weekly, according to the RSL ranking list. This is a classic "Momentum" approach and is recommended for medium
and long term investors.
Author
Original concept by Dr. Robert A. Levy (1968).

El usuario no ha dejado ningún comentario para su valoración