• Información general
  • Comentarios (3)
  • Discusión (2)
  • Novedades

Shark Deal Book

4

Term "shark" in the business world denotes a high volume investor who just made a good investment in a highly Potential business deal.So, sharks are the ones who make the market move.

In our case, if an American shark bought a Japanese company, he/she has to convert American dollars into Japanese yen to make the deal. So, the demand for the Japanese yen will increase sharply. Thus USD/JPY will go short rapidly if the deal was from the shark.

Another example, In the case of forex, if fed increased its FED Rate, which is now more attractive than say Great Britain rates, then a considerable volume of demand will be created for USD. Thus Investors and traders who invested in Great Britain bonds will transfer funds to US bonds, and this large fund will move from one country to another. In this deal, GBPUSD will go rapidly short. This deal will be from a shark shoal.


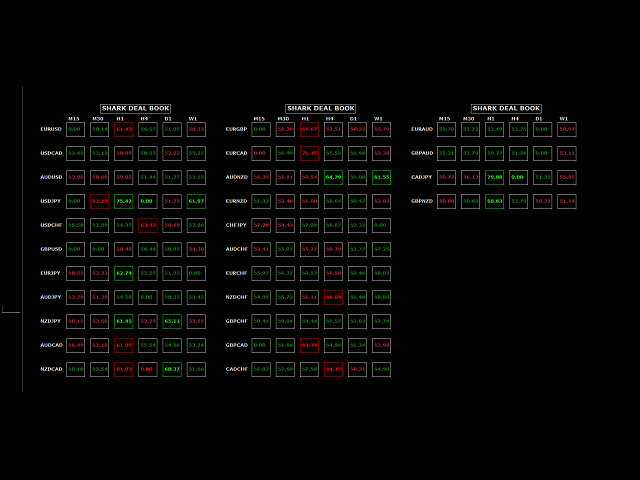
So, now what is Shark Deal Book is all about?

I have formulated a mathematical model to create an intrinsic value score for the underlying asset/symbol. As the intrinsic value increases to 65, it confirms that the underlying currency is being attractive for sharks to enter a deal in the underlying asset/symbol. This behavior indicates a high probability of new trend continuation or trend reversal.

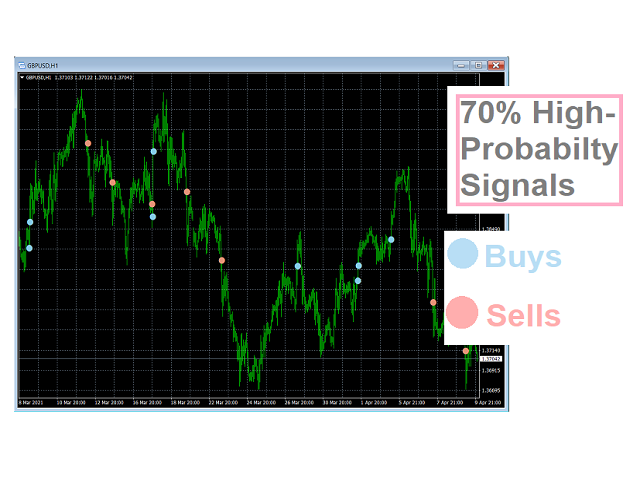
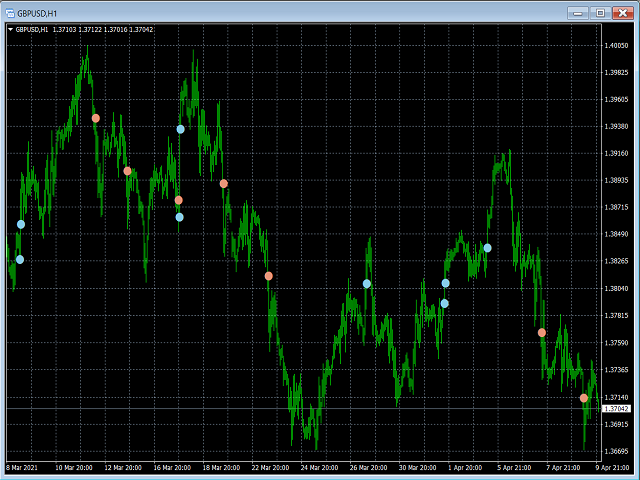
Green 75+ value denotes the Buy signal.

Red 75+ value denotes the Sell signal.

So that each executed trades will be a balanced art of optimism and pessimism. 


Why we have to detect shark deals?

Because sharks are the initiators, who will buy an asset by seeing their intrinsic value, not their extrinsic value, so, they create a trend or enter a pattern as early as possible.

There is a famous saying, "Trend is a friend" But I'll say it depends on when you enter the trade. If you enter a deal late, then you have to pay for the mistake because the trend will not see you as a loyal friend, it'll see you as a gold digger. (I hope you can understand what I mean.)


So, now let me introduce myself?

I'm Philip Pankaj, and I have done my graduation as an electrical engineer, but later I shifted my skills to finance and finished Research analyst with trade advisor certifications. During life, I felt more affinity with financial data, so I use to develop multiple strategies and cross-validate different ideas. During these processes, I finished my data science and machine learning certifications, followed by learning various programming languages, which also include mq4 and mq5.


Now the main question.

How To Trade?

Execute your trades in 2 Easy Steps!

Step 1: Trade Setup

Enter a signal if Shark Deal Book greater than 65.And confirm at-least one candlestick reacts in our direction(bull candlestick for buy signal and bear candlestick for sell signal).

Green - Buy & Red - Sell

Step 2: Trade Exit

Step One 1: Stop loss Price – Recent Swing low/High for buy/sell (Depends on Signal generated TimeFrame).

Step One 2: Take Profit Price -

       For Buy – Entry Level + (Entry Level – Recent Low).

       For Sell – Entry Level + (Entry Level – Recent High).


Benefits You Get

Quickly identify the Intrinsic value of Assets/Symbols.

Enter the trend at the right time, like a shark.

Analyze Multiple Timeframes & Multiple Symbols on one chart.

This Indicator is the Ideal combination with any trading strategy.

Never repaints, never back paints, never recalculates.

Works in all symbols and all timeframes.

Integrated pop-up, email, push notification, and sound alerts.
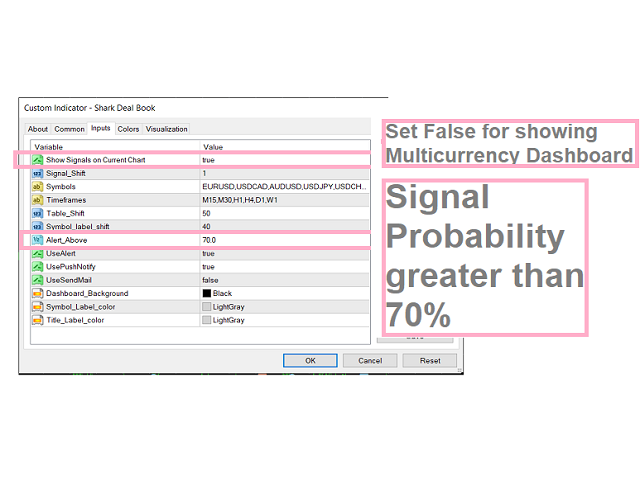
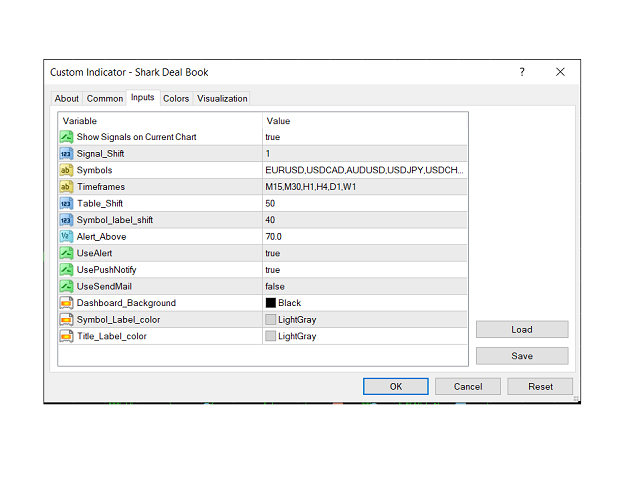

Parameters

Symbols Parameters - Add multiple number of symbols separated with comma(",").

TimeFrame Parameters - Add multiple number of Timeframe seperated with comma(",").

M1 - 1minute

M5 - 5 minute

M15 - 15 minute

M30 - 30 minute

H1 - 1 hour

H4 - 4 hour

D1 - 1 day

W1 - 1 week

MN1 - 1 month

Position Parameters - controls the position of objects drawn on the chart.

Graphics Parameters - controls the appearance and colors of drawn objects on the chart.

Alert Parameters - controls the alert options enabled.

Comentarios 3
Aravind Kolanupaka
8900
Aravind Kolanupaka 2020.06.06 18:25 
 

Very Good

Paulus Nangoy
3551
Paulus Nangoy 2020.05.15 15:42 
 

Another great indicator by the author and as always, he is there to help and answer your queries. Thank you!

Productos recomendados
VR Cub
Vladimir Pastushak
VR Cub es un indicador para obtener puntos de entrada de alta calidad. El indicador fue desarrollado para facilitar los cálculos matemáticos y simplificar la búsqueda de puntos de entrada a una posición. La estrategia comercial para la cual se diseñó el indicador ha demostrado su eficacia durante muchos años. La simplicidad de la estrategia comercial es su gran ventaja, que permite que incluso los operadores novatos negocien con éxito con ella. VR Cub calcula los puntos de apertura de posiciones
Le presentamos el indicador "Candle closing counter", que se convertirá en su asistente indispensable en el mundo del trading. Es por eso que saber cuándo se cerrará la vela puede ayudar: Si usted tiene gusto de negociar usando patrones de la vela, usted sabrá cuando la vela será cerrada. Este indicador le permitirá comprobar si se ha formado un patrón conocido y si hay una posibilidad de negociación. El indicador le ayudará a prepararse para la apertura del mercado y el cierre del mercado.
Noize Absorption Index MT4
Ekaterina Saltykova
5 (1)
Noize Absorption Index - is the manual trading system that measures the difference of pressure between bears forces and bulls forces. Green line - is a noize free index that showing curent situation. Zero value of index shows totally choppy/flat market.Values above zero level shows how powerfull bullish wave is and values below zero measures bearish forces.Up arrow appears on bearish market when it's ready to reverse, dn arrow appears on weak bullish market, as a result of reverse expectation. S
Trend Ray
Andriy Sydoruk
The indicator shows the potential trend direction by cyclical-wave dependence. Thus, all the rays of the intersection will be optimal rays, in the direction of which the price is expected to move, taking into account the indicator period. Rays can be used as a direction for potential market movement. But we must not forget that the approach must be comprehensive, the indicator signals require additional information to enter the market.
KT Renko Patterns MT4
KEENBASE SOFTWARE SOLUTIONS
2.33 (3)
KT Renko Patterns scans the Renko chart brick by brick to find some famous chart patterns that are frequently used by traders across the various financial markets. Compared to the time-based charts, patterns based trading is easier and more evident on Renko charts due to their uncluttered appearance. KT Renko Patterns features multiple Renko patterns, and many of these patterns are extensively explained in the book titled Profitable Trading with Renko Charts by Prashant Shah. A 100% automate
Forex Gump
Andrey Kozak
2.83 (6)
Forex Gump is a fully finished semi-automatic trading system. In the form of arrows, signals are displayed on the screen for opening and closing deals. All you need is to follow the instructions of the indicator. When the indicator shows a blue arrow, you need to open a buy order. When the indicator shows a red arrow, you need to open a sell order. Close orders when the indicator draws a yellow cross. In order to get the most effective result, we recommend using the timeframes H1, H4, D1. There
Daily Candle Predictor es un indicador que predice el precio de cierre de una vela. El indicador está destinado principalmente para su uso en gráficos D1. Este indicador es adecuado tanto para el comercio de divisas tradicional como para el comercio de opciones binarias. El indicador se puede utilizar como un sistema de negociación independiente o puede actuar como una adición a su sistema de negociación existente. Este indicador analiza la vela actual, calculando ciertos factores de fuerza dent
Intraday Levels Advanced fragmenta cada sesión en zonas para trading intradía. Realiza una rejilla de las zonas de precios de cada sesión, sirve como guía para establecer la tendencia de la sesión, las mejores zonas para realizar entradas y las distancias para stop-loss y take-profit. Los parámetros son: Levels Mode: Uno entre los siguientes: Modo Basic: Dibuja los niveles máximo, mínimo y medio de la sesión. Modo Advanced: Dibuja los niveles máximo, mínimo, central e intermedios de la sesi
Owl smart levels
Sergey Ermolov
4.63 (54)
Versión MT5  |   FAQ El   Indicador Owl Smart Levels   es un sistema comercial completo dentro de un indicador que incluye herramientas de análisis de mercado tan populares como   los fractales avanzados de Bill Williams , Valable ZigZag que construye   la estructura de onda correcta   del mercado y   los niveles de Fibonacci   que marcan los niveles exactos de entrada. en el mercado y lugares para tomar ganancias. Descripción detallada de la estrategia Instrucciones para trabajar con el indi
ZhiBiCCI MT4
Qiuyang Zheng
5 (1)
Los indicadores [ZhiBiCCI] son ​​adecuados para todos los ciclos de uso y también son adecuados para todas las variedades de mercado. [ZhiBiCCI] La línea verde sólida es una reversión de la divergencia alcista. La línea de puntos verde es una divergencia alcista clásica. [ZhiBiCCI] La línea continua hacia el rojo es una divergencia bajista inversa. La línea roja punteada es una divergencia bajista clásica. [ZhiBiCCI] puede configurarse en los parámetros (Alerta, Enviar correo, Enviar notif
Blahtech Market Profile
Blahtech Limited
4.61 (18)
Was: $249  Now: $99   Market Profile defines a number of day types that can help the trader to determine market behaviour. A key feature is the Value Area, representing the range of price action where 70% of trading took place. Understanding the Value Area can give traders valuable insight into market direction and establish the higher odds trade. It is an excellent addition to any system you may be using. Blahtech Limited presents their Market Profile indicator for the MetaTrader community. Ins
PZ Trend Trading
PZ TRADING SLU
4.8 (5)
Trend Trading es un indicador diseñado para sacar el máximo provecho posible de las tendencias que tienen lugar en el mercado, mediante el cronometraje de retrocesos y rupturas. Encuentra oportunidades comerciales al analizar qué está haciendo el precio durante las tendencias establecidas. [ Guía de instalación | Guía de actualización | Solución de problemas | FAQ | Todos los productos ] Opere en los mercados financieros con confianza y eficiencia Aproveche las tendencias establecidas sin s
nuestro indicador Basic Support and Resistance es la solución que necesita para aumentar su análisis técnico.Este indicador le permite proyectar niveles de soporte y resistencia en el gráfico/ versión mt5 características Integración de los niveles de Fibonacci: Con la opción de mostrar los niveles de Fibonacci junto con los niveles de soporte y resistencia, nuestro indicador le brinda una visión aún más profunda del comportamiento del mercado y las posibles áreas de inversión. Optimización
Gold Bricks FX USES THE TREND WAVE INDICATOR AND IT CAN IDENTIFY THE BEGINNING AND THE END OF A NEW WAVE TREND MOVEMENT. AS AN OSCILLATOR, THE INDICATOR IDENTIFIES THE OVERBOUGHT AND OVERSOLD ZONES. IT WORKS GREAT TO CATCH THE SHORT TERM PRICE REVERSALS AND USES A MARTINGALE STRATEGY TO CLOSE ALL TRADES IN PROFIT. USE DEFAULT SETTINGS ON H1 OR HIGHER TIME FRAME ON ANY PAIR FOR MORE ACCURATE TRADES WHY THIS EA : Smart entries calculated by 4 great strategies The EA can be run on even a
Power Renko is an indicator which plots Renko bricks underneath the chart using a histogram. You can select the brick size and the timeframe of the Renko bricks as well as whether or not to use the close price or the high/low price of the candles. Renko bricks are based on price alone, not time, therefor the Renko bricks will not be aligned with the chart's time. They are extremely useful for trend trading and many different strategies can be formed from them. Buffers are provided allowing you t
How to use Pair Trading Station Pair Trading Station is recommended for H1 time frame and you can use it for any currency pairs. To generate buy and sell signal, follow few steps below to apply Pair Trading Station to your MetaTrader terminal. When you load Pair Trading Station on your chart, Pair Trading station will assess available historical data in your MetaTrader platforms for each currency pair. On your chart, the amount of historical data available will be displayed for each currency pai
The Th3Eng PipFinite indicator is based on a very excellent analysis of the right trend direction with perfect custom algorithms. It show the true direction and the best point to start trading. With StopLoss point and Three Take Profit points. Also it show the right pivot of the price and small points to order to replace the dynamic support and resistance channel, Which surrounds the price. And Finally it draws a very helpful Box on the left side on the chart includes (take profits and Stop loss
Infinity Trend Pro
Yaroslav Varankin
1 (1)
This is a trend indicator without redrawing Developed instead of the binary options strategy (by the color of the Martingale candlestick) Also works well in forex trading When to open trades (binary options) A signal will appear in the place with a candle signaling the current candle It is recommended to open a deal for one candle of the current timeframe M1 and M5 When a blue dot appears, open a deal up When a red dot appears, open a trade down. How to open trades on Forex. When a signal is rec
Introducing the "Magic Trades" for MetaTrader 4 – your ultimate tool for precision trading in dynamic markets. This innovative indicator revolutionizes the way you perceive market trends by harnessing the power of advanced analysis to detect subtle changes in character, paving the way for optimal trading opportunities. The Magic Trades Indicator is designed to empower traders with insightful entry points and well-defined risk management levels. Through its sophisticated algorithm, this indica
For sure, this indicator has become very popular amongst traders. Through coding this indicator will give you the most accurate levels possible for your trading analysis. We have also added in the ability for you to receive alerts when the price breaks above or below a Support or Resistance lines! HOW TO USE The red rectangles represent your resistance/supply zone. The green rectangles represent your support/demand zone.  BONUS FEATURES We coded this indicator with the ability to switch between
The indicator displays the data of the Stochastic oscillator from a higher timeframe on the chart. The main and signal lines are displayed in a separate window. The stepped response is not smoothed. The indicator is useful for practicing "manual" forex trading strategies, which use the data from several screens with different timeframes of a single symbol. The indicator uses the settings that are identical to the standard ones, and a drop-down list for selecting the timeframe. Indicator Parame
Trendiness Index
Libertas LLC
5 (3)
"The trend is your friend" is one of the best known sayings in investing, because capturing large trendy price movements can be extremely profitable. However, trading with the trend is often easier said than done, because many indicators are based on price reversals not trends. These aren't very effective at identifying trendy periods, or predicting whether trends will continue. We developed the Trendiness Index to help address this problem by indicating the strength and direction of price trend
Cosmic Diviner X Planet
Olena Kondratenko
4 (2)
This unique multi-currency strategy simultaneously determines the strength of trends and market entry points, visualizing this using histograms on the chart. The indicator is optimally adapted for trading on the timeframes М5, М15, М30, Н1. For the convenience of users, the indicator renders the entry point (in the form of an arrow), recommended take profit levels (TP1, TP2 with text labels) and the recommended Stop Loss level. The take profit levels (TP1, TP2) are automatically calculated for
Master Scalping M1 es un indicador innovador que utiliza un algoritmo para determinar la tendencia de forma rápida y precisa. El indicador calcula el tiempo de apertura y cierre de posiciones, los algoritmos del indicador le permiten encontrar los momentos ideales para ingresar a una operación (comprar o vender un activo), lo que aumenta el éxito de las transacciones para la mayoría de los comerciantes. Beneficios del indicador: Fácil de usar, no sobrecarga el gráfico con información innecesari
The Sextet Scalper Pro  is an MT4 indicator that gives signals when new waves are starting in a trend. The trends are calculated using the original " The Sextet " indicator method. You get a free EA to trade with The Sextet Scalper Pro: Free EA . Default settings were optimized on GBPUSD H1 from 2017. EA could be tested on free demo version of The Sextet Scalper Pro, before purchase. Key Features: Uses The Sextet Trend Detection Method which is already a good strategy in itself for detecting l
Afeitadora de mercado   revendedor de mercado Este indicador es parte de los sistemas RPTrade Pro Solutions. Market Scalper es un indicador de tendencia diario que utiliza Price Action, Dynamic Support y Resistances. Está diseñado para ser utilizado por cualquier persona, incluso el principiante absoluto en el comercio puede usarlo. NUNCA repintar. Las indicaciones se dan de cierre a cierre. Diseñado para usarse solo, no se requieren otros indicadores. Te da indicaciones claras y sencillas
TrendPlus
Sivakumar Subbaiya
4.21 (14)
Trend Plus   Trendplus  Indicator   Time Frame: Suitable for any time frame.  Purpose: Trend Prediction. Blue and red candle indicate the buy and sell call respectively. Buy: When the blue candle is formed buy call is initiated. close the buy trades when the next red candle will formed.   Sell: When the Red candle is formed Sell call is initiated. close the Sell trades when the next blue candle will formed.   Happy trade!!
FREE
Heiken Ashi candle chart is an improved version of The Japanese candle chart, which can effectively filter the market "noise" of the Japanese candle chart. It is favored by many traders for its simplicity and intuition. For trend traders, the HA candle chart is a magic tool. Unlike the traditional Japanese candle chart, Heikenashi does not reflect the opening price, high price, low price and closing price of the market. Instead, Heikenashi calculates the value of a single K line in the dominant
TWO PAIRS SQUARE HEDGE METER INDICATOR Try this brilliant 2 pairs square indicator It draws a square wave of the relation between your two inputs symbols when square wave indicates -1 then it is very great opportunity to SELL pair1 and BUY Pair2 when square wave indicates +1 then it is very great opportunity to BUY pair1 and SELL Pair2 the inputs are : 2 pairs of symbols         then index value : i use 20 for M30 charts ( you can try other values : 40/50 for M15 , : 30 for M30 , : 10 for H1 ,
Strong Retracement Points Pro demo edition! SRP (Strong Retracement/Reversal Points) is a powerful and unique support and resistance indicator. It displays the closest important levels which we expect the price retracement/reversal! If all level are broken from one side, it recalculates and draws new support and resistance levels, so the levels might be valid for several days depending on the market! If you are still hesitating to start using this wonderful tool, you can check this link to see h
Los compradores de este producto también adquieren
Indicator : RealValueIndicator Description : RealValueIndicator is a powerful tool designed specifically for trading on the EURUSD pair. This indicator analyzes all EUR and USD pairs, calculates their real currency strength values, and displays them as a single realistic value to give you a head start on price. This indicator will tell you moves before they happen if you use it right. RealValueIndicator allows you to get a quick and accurate overview of the EURUSD currency pair tops and bottoms,
TrendMaestro
Stefano Frisetti
5 (3)
note: this indicator is for METATRADER4, if you want the version for METATRADER5 this is the link:  https://www.mql5.com/it/market/product/108106 TRENDMAESTRO ver 2.4 TRENDMAESTRO recognizes a new TREND in the bud, he never makes mistakes. The certainty of identifying a new TREND is priceless. DESCRIPTION TRENDMAESTRO identifies a new TREND in the bud, this indicator examines the volatility, volumes and momentum to identify the moment in which there is an explosion of one or more of these data a
JULY OFFER 80% OFF next price for unlimited version will be 17000$. This is the only time you can get this institutional and professional indicator at this price for unlimited version. Don't dare to miss this. The tool I am about to introduce to you you can't compare it with other tools due to its strategy and accuracy level in predicting the next price directional movement . This tool is designed for serious traders who have decided to make a difference through trading. Be the next person to wi
Enigmera
Ivan Stefanov
5 (4)
ENIGMERA: El núcleo del mercado https://www.enigmera.com Introducción Este indicador y sistema de negociación es un enfoque extraordinario de los mercados financieros. ENIGMERA utiliza los ciclos fractales para calcular con precisión los niveles de soporte y resistencia. Muestra la auténtica fase de acumulación y proporciona dirección y objetivos.  Un sistema que funciona tanto si estamos en una tendencia como en una corrección.  ¿Cómo funciona? ENIGMERA consta de tres líneas: la línea de s
ZeusArrow Smart Liquidity Finder  Smart Liquidity Finder is Ai controlled indicator based on the Idea of Your SL is My Entry. It scan and draws the major Liquidity areas on chart partitioning them with Premium and Discount Zone and allows you find the best possible trading setups and help you decide the perfect entry price to avoid getting your Stop Loss hunted . Now no more confusion about when to enter and where to enter. Benefit from this one of it's kind trading tool powered by Ai an trade
A. ¿Qué es A2SR ?   * Es un indicador técnico líder (sin repintado, sin retraso). -- Guía : -- en https://www.mql5.com/en/blogs/post/734748/page4#comment_16532516 -- y https://www.mql5.com/en/users/yohana/blog A2SR tiene una técnica especial para determinar los niveles de Soporte (demanda) y Resistencia (oferta). A diferencia de la forma ordinaria que vimos en la red, A2SR tiene un concepto original para determinar los niveles reales de SR. La técnica original no se tomó de Internet y tampoco
NAM Order Blocks
NAM TECH GROUP, CORP.
5 (1)
Indicador de detección de Order Blocks multitimeframe para MT4. Características - Panel de control totalmente personalizable, proporciona una interacción completa. - Oculta y muestra el panel de control donde quieras. - Detecta OB en múltiples marcos de tiempo. - Permite seleccionar la cantidad de OB para mostrar. - Interfaz de usuario de diferentes OBs. - Diferentes filtros de OBs (regulares, rejection y sin capitalizar). - Alerta de proximidad de OBs. - Líneas ADR High y Low. - Servicio de not
This indicator uses support and resistance, volume and some special formula to calculate the volume to filter the candles. If the volume reaches a specific value, And at the same time, Candle breaks the support/resistance line, There would be a signal and we can enter the market. Signals appear when the current candle closes. then you can enter the trade when a new candle appears. Please don't forget to follow your money management plan. MT5 Version Support/Resistance Breakout MT5 :   https:
FxBears Powers
Rachid Lafhil
3 (2)
️️ Attention:      The price will soon be raised to what it was before ($500).      No more losses with this indicator, test it for years ago and see if there is losses in one day results. but before testing it please see the explaining video down here.    FxBears Powers is working on all forex pairs, metals, commodities, futures, indices, energies, crypto, and everything...and on all timeframes from M1 to MN.   It's based on supply and demand zones, price action, and some internal indicators,
Por supuesto, aquí tienes la traducción al español: Presentamos el Indicador de Astronomía para MT4: Tu Compañero Celestial Definitivo en el Trading ¿Estás listo para elevar tu experiencia de trading a alturas celestiales? No busques más allá de nuestro revolucionario Indicador de Astronomía para MT4. Esta innovadora herramienta trasciende los indicadores de trading tradicionales, aprovechando el poder de algoritmos complejos para proporcionarte una visión astronómica sin igual y cálculos de pre
Gold Channel is a volatility-based indicator, developed with a specific timing algorithm for the XAUUSD pair, which consists of finding possible corrections in the market. This indicator shows two outer lines, an inner line (retracement line) and an arrow sign, where the theory of the channel is to help identify overbought and oversold conditions in the market. The market price will generally fall between the boundaries of the channel. If prices touch or move outside the channel it is a tra
Please send me Direct message on MQL5 CHAT after purchasing the Indicator for Training and Installation Support There are some additional files that is important to use with the Indicator . So be sure to contact me after purchasing the Indicator So that I can add you for training and support . If you find any difficulty with installation then send me Direct message here So that I can connect with you via Anydesk or Teamview for the product installation. " Smart Order Block Indicator " to find
El indicador " ZigZag on Trend " es un asistente para determinar la dirección del movimiento del precio, así como una calculadora de barras y pips. Consiste en un indicador de tendencia que monitorea la dirección del precio con una línea de tendencia presentada en forma de zigzag y un contador que calcula el número de barras pasadas en la dirección de la tendencia y el número de puntos en una escala vertical. (Los cálculos se realizan mediante la apertura de la barra) El indicador no se vuelve a
ECM Channel MT4
Paulo Rocha
5 (1)
ECM Elite Channel is a volatility-based indicator, developed with a specific time algorithm, which consists of finding possible corrections in the market. This indicator shows two outer lines, an inner line (retracement line) and an arrow sign, where the channel theory is to help identify overbought and oversold conditions in the market. The market price will generally fall between the boundaries of the channel. If prices touch or move outside the channel, it's a trading opportunity. The
Gann Signal
Kirill Borovskii
Gann Signal is a very simple indicator at first glance, but hidden inside is many years of experience in studying W.D.Ganna methods. The indicator gives accurate BUY/SELL signals, without redrawing. The indicator is very easy to use. All you need to do is attach it to your chart and follow its recommendations. The indicator constantly analyzes the market for entry opportunities. When such an opportunity appears, the indicator gives a signal in the form of an arrow. I repeat, all signals are NOT
Presentamos el Indicador Milagroso de Forex: Desata el Poder del Trading Preciso ¿Estás cansado de buscar el mejor indicador de Forex que realmente ofrezca resultados excepcionales en todos los marcos temporales? ¡No busques más! Ha llegado el Indicador Milagroso de Forex para revolucionar tu experiencia de trading y llevar tus ganancias a nuevas alturas. Construido sobre una base de tecnología de vanguardia y años de desarrollo meticuloso, el Indicador Milagroso de Forex se erige como el pinácu
Shepherd Gann Squares
Abdullah Alrai
4.9 (10)
Este indicador es un método de análisis de mercado basado en el artículo "Fórmula matemática para predicciones de mercado" escrito por W.D. Gann según los métodos del cuadrado de nueve y el cuadrado de 144. Manual de usuario: Add Your review And contact us to get it Puede comprar la versión MT5 completa en: https://www.mql5.com/en/market/product/28669 Puede probar en MT4 gratis: https://www.mql5.com/en/market/product/15320?source=Site +Profile+Seller#!tab=reviews Este producto
Dragon Multi Indicator MT4
Mansour Babasafary
5 (4)
3 Indicators in 1 indicator Strategy based on price action Made specifically for the best forex currency pairs Can be used in the best time frame of the market at a very reasonable price This indicator is basically 3 different indicatos . But we have combined these 3 indicators in 1 indicator so that you can use 3 indicators at the lowest price. All three strategies are based on price action. But based on different trends. Long term, medium term and short term Attributes : No repaintin
Introduction to X3 Chart Pattern Scanner X3 Cherart Pattern Scanner is the non-repainting and non-lagging indicator detecting X3 chart patterns including Harmonic pattern, Elliott Wave pattern, X3 patterns, and Japanese Candlestick patterns. Historical patterns match with signal patterns. Hence, you can readily develop the solid trading strategy in your chart. More importantly, this superb pattern scanner can detect the optimal pattern of its kind. In addition, you can switch on and off individu
Max Paynex
Abdulkarim Karazon
Max Payne es un indicador de señal de reversión/tendencia que proporciona señales en forma de flecha, este indicador da su señal al cerrar la misma barra, este indicador puede aparecer varias veces en el gráfico con diferentes períodos para obtener confirmación doble/triple de las señales. El indicador es altamente ajustable para adaptarse a cualquier estilo comercial y nunca se repinta ni se vuelve a pintar. Obtendrá el sistema completo en capturas de pantalla después de la compra junto con la
SNR LEVEL INDICATOR Accurate Snr level indicator will only display Fresh Levels that are close to the Current Market Price. This indicator is very accurate in mapping Support & resistance levels. there is an alert feature when the price TOUCHES the SNR LEVEL, WHEN CLOSE CANDLE BREAK/REJECT SNR LEVEL. INDICATOR MARKING : - SUPPORT LEVEL = V SHAPE - RESISTANCE LEVEL = APEX LEVEL - GAP RESISTANCE & GAP SUPPORT = OPEN CLOSE CANDLE - SUPPORT BECAME RESISTANCE & RESISTANCE BECAME SUPPORT INDICATOR
Presentamos ON Trade Waves Patterns Harmonic Elliot Wolfe, un indicador avanzado diseñado para detectar diversas formas de patrones en el mercado mediante métodos tanto manuales como automáticos. A continuación, te explicamos cómo funciona: Patrones Armónicos: Este indicador puede identificar patrones armónicos que aparecen en tu gráfico. Estos patrones son esenciales para los traders que practican la teoría del trading armónico, tal como se popularizó en el libro de Scott Carney "Harmonic Tradi
Limitless MT4
Dmitriy Kashevich
El MT4 ilimitado es un indicador universal adecuado para todos los operadores principiantes y experimentados. funciona en todos los pares de divisas, criptomonedas, acciones en bruto MT4 ilimitado: ya está configurado y no requiere configuración adicional Y ahora lo principal ¿Por qué MT4 ilimitado? 1 falta total de redibujo 2 dos años de pruebas por los mejores especialistas en comercio 3 la precisión de las señales correctas supera el 80% 4 tuvo un buen desempeño en el comerci
Introduction Excessive Momentum Indicator is the momentum indicator to measure the excessive momentum directly from raw price series. Hence, this is an extended price action and pattern trading. Excessive Momentum Indicator was originally developed by Young Ho Seo. This indicator demonstrates the concept of Equilibrium Fractal Wave and Practical Application at the same time. Excessive Momentum detects the market anomaly. Excessive momentum will give us a lot of clue about potential reversal and
Indicator fantastic Bună ziua! Indicatorul fantastic funcționează cel mai bine pe M5, M15, M1. Rezultatele sunt fantastice. Pe perioade mai lungi de timp, semnalele sunt corecte, dar sunt rare. Marcatorul nu revopsește. Recomand un TPmin. = 5, 10 sâmburi pentru M5. Acest indicator are potențialul de a declanșa tranzacții mult mai lungi. Experimentează-l! Noroc! Note If the indicator is not displayed, add the TMA+CG mladen NRP and Traders_Dynamic_Index III indicators to the Ind
H1 Signal
Teofil Creanga
Semnal H1 Studiați indicatorul de semnal H1. Rezultate foarte bune. Este creat pentru gama H1. Succes! Note If the indicator is not displayed, add the Drake Delay Stochastic and TMA+CG mladen NRP indicators to the Indicators folder. You can download TMA+CG mladen NRP from the link https://forex-station.com/app.php/attach/file/3311524 And the Drake Delay Stochastic indicator, from the link https://forex-station.com/app.php/attach/file/3322414 But let them be on the first download.
Shepherd Harmonic Pattern
Abdullah Alrai
4.68 (59)
Este indicador detectará patrones armónicos que se dibujen en el gráfico mediante métodos manuales y automáticos. Puede consultar el manual del usuario en el siguiente enlace: Agregue su opinión y contáctenos para obtenerlo Existe una versión gratuita para probar este producto en mt4. Puede utilizarlo para detectar patrones de Gartley y Nenstar: https://www.mql5.com/en/market/product/30181 Puede comprar la versión completa de MT4 en: https://www.mql5.com/en/market/product/15212 Notas El indicad
PZ Swing Trading
PZ TRADING SLU
5 (4)
Swing Trading es el primer indicador diseñado para detectar oscilaciones en la dirección de la tendencia y posibles oscilaciones de reversión. Utiliza el enfoque de intercambio de línea de base, ampliamente descrito en la literatura comercial. El indicador estudia varios vectores de precios y tiempos para rastrear la dirección de la tendencia agregada y detecta situaciones en las que el mercado está sobrevendido o sobrecomprado y listo para corregir. [ Guía de instalación | Guía de actualización
Currently Price 20% OFF ( for unlimited use )   BONUS  AUX VIP Club 2024 : Include  EA Airbag  and  Load Data History  to enhance the performance of this tool to its maximum potential  Click Here to Download Files   ( for users only )   Hello World! Introducing.. SMCpro VIP tool and Indicator for MetaTrader 4, designed to revolutionize your trading experience with the ICT Smart Money Concept. This system is meticulously crafted to empower traders with advanced insights and precision in
Full STO
Roman Smoroda
Indicador STO completo (incluye todas las versiones de tres indicadores STO: Premium, Gold, Silver) - STABLE TRADE OPTION está diseñado para el comercio automático de opciones binarias.  ¡¡¡¡¡LEA CUIDADOSAMENTE!!!!! IMPORTANTE En un terminal cree dos plantillas con diferentes vencimientos, una plantilla para las 18:01, 18:02 con vencimientos de 1 a 15 minutos y una plantilla para las 22:00 con vencimientos de 10 a 20 minutos. Winrate: 71% en los últimos 5 años Gestión del dinero: 0,3% d
Otros productos de este autor
Arbitrage Thief Index
Philip Pankaj Suthagar
4.35 (23)
"It's not about how much you do, but how much love you put into what you do that counts." - Mother Teresa Unlock the ultimate trading advantage today with the Arbitrage Thief Index. Throughout my successful trading career, this powerful indicator has been my secret weapon for securing perfect entry and exit points, ensuring consistent and safe profits. Now, I'm excited to share this revolutionary strategy with you. Top fund managers diversify their trades across multiple instruments to build a
Trade Extractor MT5
Philip Pankaj Suthagar
2 (1)
TRADE EXTRACTOR   is the fastest self-learning AI Algorithm, which will learn any market situation with ease.As a Manual trader, I came across the difficulty of finding the right parameter and the right condition to trade. There are infinite combinations of indicators and objects(trendlines, gann grid, fibo levels etc) which as an human, I can’t decide their winning rate or performance. Many claim to have a winning strategy but won’t have enough statistical support to prove their claims. Due to
Rsi Regression Channel
Philip Pankaj Suthagar
5 (3)
In statistics, Regression Channel is a approach for modelling the relationship between a scalar response (or dependent variable) and one or more explanatory variables (or independent variables).We Applied relative strength index(rsi) values to develop regression models of various degrees in order to understand relationship between Rsi and price movement.                        Our goal is range prediction and error reduction of Price divergence , thus we use Rsi Regression
Moving Average Bands
Philip Pankaj Suthagar
MOVING AVERAGE BANDS / MA BANDS: This is an very simple Indicator but very powerful in identifying trend reversal.The calculation of moving Average bands consist of defining the range of bars and the multiplier we use. -To find range of n bars we used the values of moving average high and low values of n bars. -Then we used individual multiplier for individual bands. -The multiplier we defining can be based on your style say for example some needs moving average fibonacci bands or dynamic fibona
Rsi Ma Bands
Philip Pankaj Suthagar
"It's not about how much you do, but how much love you put into what you do that counts."    - Mother Teresa This Indicator is build on value of Relative Strength Index and Moving average of relative strength Index. We have calculated bands with respect to Moving average of Relative strength Index. Trading strategy:   https://www.mql5.com/en/blogs/post/725691 Why use Rsi Ma Bands? Great for novice traders as well as experienced traders. Low risk entries. Doesn't repaints. No additional Indica
NeuroWave Scalper PRO
Philip Pankaj Suthagar
5 (2)
Motivated from: A market is the story of cycles and of the human behavior that is responsible for overreactions in both directions. - Seth Klarman NeuroWave Scalper PRO  is a advanced powerful cycle algorithm which depicts the cycles of market in a effective manner.This Indicator works in trending as well as ranging market conditions. This indicator is perfect for scalp trades as well as swing trades.   NeuroWave Scalper PRO  is not just an indicator, but a trading strategy itself. It doesn
Citra Bot
Philip Pankaj Suthagar
3.33 (3)
Inspired from, Time is the most important factor in determining market movements and by studying past price records you will be able to prove to yourself history does repeat and by knowing the past you can tell the future. There is a definite relation between price and time. - William Delbert Gann CITRA BOT is a Price Action/Price Pattern detection Indicator which uses historical data to validate a current pattern or profile to predict the probability of hitting future resistance or support l
Rsi Decoder
Philip Pankaj Suthagar
4.5 (2)
Introducing RSI DECODER "Time is the most important factor in determining market movements and by studying past price records you will be able to prove to yourself history does repeat and by knowing the past you can tell the future. There is a definite relation between price and time." - William Delbert Gann Caution: RSI DECODER is not a Holy Grail System. It is a tool designed to give you insight into the current market structure. Trading decisions should be made in combination with an economi
Heiken Ashi Scanner
Philip Pankaj Suthagar
4.25 (4)
Heikin-Ashi charts , developed by  Munehisa Homma  in the 1700s.  Munehisa Honma was a rice merchant from Sakata, Japan who traded in the Dojima Rice market in Osaka during the Tokugawa Shogunate. He is considered to be the father of the candlestick chart.   Th e man who invented the use of candlestick charts for finding and profiting from chart patterns.He was a billionaire trader on those days if we compared his net-worth with todays dollar . Heikin Ashi Scanner is an Multi-Currency and Multi
Trade Extractor
Philip Pankaj Suthagar
5 (2)
Introducing TRADE EXTRACTOR The fastest self-learning AI Algorithm designed to revolutionize your trading experience. As a manual trader, the challenge of pinpointing the right parameters and conditions for trading can be overwhelming. With countless combinations of indicators and objects like trendlines, Gann grids, and Fibonacci levels, determining their effectiveness is nearly impossible for a human. Many strategies lack the statistical backing to prove their claims. To address this, we deve
Eurusd Decoder EA MT4
Philip Pankaj Suthagar
4 (1)
EURUSD DECODER EA   is a fully automated mid-term, medium-risk expert advisor. Adaptive price pattern analysis is used to identify potential trade entries and exit. The EA does not use any unfair money management practices like grid and martingale. Each position includes a stop loss and all open positions are monitored by an advanced loss control algorithm, which decides when to close profit and when to accept loss.   Before you buy all of my product please be aware of the risks involved: 1) Pl
Quant Stress Scanner
Philip Pankaj Suthagar
The Knowledge of which Geometry aims is the knowledge of the Eternal - Plato Quant Stress Scanner is a Scientifically developed Stress detection algorithm along the geometrical lines on the price data which are quantified into Stress repulsion, fractures and clusters in a easily understandable signal form. Each signal are displayed in well-arranged with currency pairs in row-wise and timeframes in column-wise manner. Explanation of signal and plotting stress levels with trendlines are shown in
Rsi Decoder MT5
Philip Pankaj Suthagar
Inspired from, Time is the most important factor in determining market movements and by studying past price records you will be able to prove to yourself history does repeat and by knowing the past you can tell the future. There is a definite relation between price and time. -William Delbert Gann   Caution:   It's not HolyGrail System, It's a tool to give you insight of current market structure. The decision to trade is made only with combination of economical understanding of underlying instru
Owl Craft Pro
Philip Pankaj Suthagar
Owl Craft Pro is a powerful scalping strategy that employs a smart entry and exit algorithm as well as sophisticated filtering algorithms to discover just the safest entry points during market calms. This approach is designed to provide long-term, consistent growth. It is a professional tool that incorporates all of the latest trading advancements. There's nothing fancy about this, no Holy Grail testing, no "risk-free martingale," just a rigid rule-based method to trading that allows you to maxi
Filtro:
Tim Eubanks
5762
Tim Eubanks 2023.03.24 06:29 
 

Late to bad signals, not worth the price! I would love to give it a better review, but the signals need improvement and consistency, it is a nice concept, just needs some improvement!

Philip Pankaj Suthagar
6587
Respuesta del desarrollador Philip Pankaj Suthagar 2023.03.24 06:51
Expected a good review from you sir.
Thanks
Aravind Kolanupaka
8900
Aravind Kolanupaka 2020.06.06 18:25 
 

Very Good

Paulus Nangoy
3551
Paulus Nangoy 2020.05.15 15:42 
 

Another great indicator by the author and as always, he is there to help and answer your queries. Thank you!

Respuesta al comentario
Versión 2.10 2023.10.08
*Timeframes label shifts
Versión 2.0 2023.03.24
*Updated table shift when exceeding screen size.
Versión 1.90 2021.10.12
*Default Parameters Updated.
Versión 1.80 2021.04.16
*Re-Alerting on the current bar issue has been fixed.
Versión 1.70 2021.04.11
*Default Alert_Above is set to 75 for better performance.
Versión 1.60 2021.04.11
*Arrow Naming corrections have been made from the previous version.
Versión 1.50 2021.04.11
*Showing signals on individual current charts as per Alert Above level.
(Set Show Signals on current chart to true).
Versión 1.40 2021.04.11
*Signal_Shift is added as per user request.
(if you need the current real-time score you should set Signal_Shift to 0 or if you need the last confirmed score then set Signal_Sift to 1)
Versión 1.30 2020.08.03
*Zero value display error fixed.
Versión 1.20 2020.05.19
*Modified Algorithm to adapt well to the free-flow zone where uncertainty is low. (Update based on experienced traders feedback).
Versión 1.10 2020.05.15
*Reformulated to give more significance on the trade entry-level to improve accuracy.