Economic Calendar Viewer
- Indicadores
- Boguslaw Nejmanowski
- Versión: 13.0
- Actualizado: 18 abril 2021
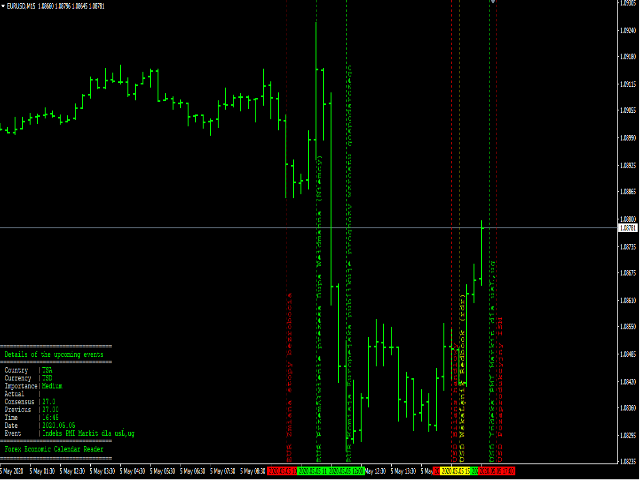
Economic Calendar Viewer
This economic events reader is adapted to load data from a csv file. You can prepare the csv file yourself according to this template, you can do
it in notepad or csved.
The file should normally be named Calendar-MM-DD-YYYY.csv.
And contain lines with data column headers according to this example. In the Impact column, i.e. impact on the market depending on the importance of the event, the names accepted from the least important are: None, Low, Medium, High. In columns: Previous, Consensus, Actual numerical data are entered, but they may not be entered.
Date, Time, Currency, Country, Description, Impact, Previous, Consensus, Actual
04/17/2020,00:00,EUR, Netherlands, Liberation Day, None ,,,
04/17/2020,11:00,EUR, Germany, ZEW study - economic mood, High, -49.50, -43.0, -50.0
04/17/2020,11:30,EUR, USA, Consumer Price Index (YoY), Medium, 0.7%, 0.7%, 0.7%
04/17/2020,12:00,EUR, Germany, Production Goods Price Index (YoY), Low, -0.1%, 0.2%, 0.1%
You can also use a ready csv file downloaded from the forex portal. After downloading, this file must be put without changing the name into the
Common \\ File or Sandbox \\ File directory and then run a free script Calendar Converter 2020 to adapt it to use by the MT4 economic
calendar reader and automatically put it in the selected subdirectory.
This is not to promote myfxbook.com in any way. This is the only portal on which the csv file containing the calendar of upcoming economic
events is available. Unfortunately, the download of this file is only available after logging into the portal. The downloaded
economic calendar usually includes the time of the events in your time zone, so you don't need to change the settings.

Great support