• Información general
  • Comentarios (5)
  • Discusión (4)
  • Novedades

Liquidity Levels

4
La liquidez es un aspecto importante en el mercado, especialmente para los inversores institucionales, ya que necesitan mucha liquidez para entrar o salir del mercado.

El dinero inteligente actúa como CREADOR DE MERCADO para el rebaño. En otras palabras: el dinero inteligente es la contrapartida del saliente de las posiciones largas o cortas que mantiene el rebaño. Si el rebaño es neto corto, entonces el dinero inteligente es neto largo. Si el rebaño es neto largo, entonces el dinero inteligente es neto corto. Esto crea un conflicto de intereses entre el dinero inteligente y el rebaño. Y debido a su poder abrumador, ¡el dinero inteligente siempre ganará!
Esto para explicar cómo funciona el dinero inteligente.

Por lo tanto, los comerciantes institucionales se centran más en las métricas de demanda / oferta que en las herramientas y técnicas de análisis técnico tradicionales.

Junto a los niveles de soporte y resistencia, indica todos los principales niveles de liquidez y grupos en el mercado. La liquidez en estos niveles de precios se acumula mediante órdenes de stop loss, breakout, break-even de comerciantes especialmente minoristas. Cuanto más se mantenga un nivel de soporte o resistencia, más liquidez se acumulará justo por encima / por debajo de este nivel de precios. Esta es también la razón por la cual sistemáticamente todas las órdenes de stop loss son golpeadas una y otra vez.

Tarde o temprano, todos estos niveles se ven afectados por la acción de los precios, ya que los inversores institucionales llevarán el precio a donde está la liquidez.
Al hacer esta manipulación, se crean nuevas zonas de liquidez que nuevamente se cruzarán después.

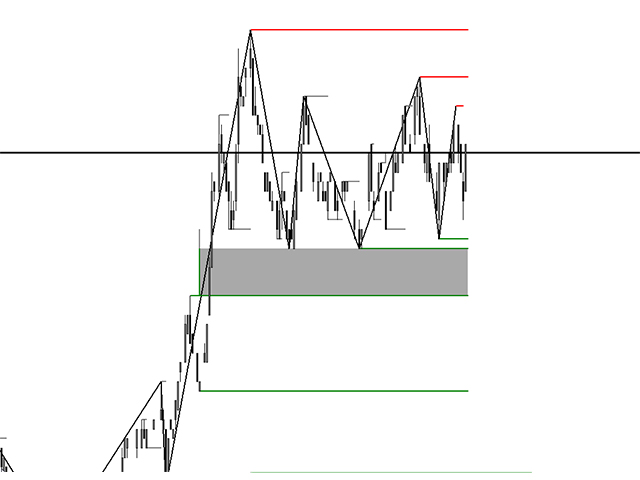
Este indicador no es solo otro indicador de soporte y resistencia. Por supuesto, los niveles de soporte y resistencia también son niveles de liquidez, ya que hay una acumulación de órdenes de stop loss, breakout y break even. Los niveles alcanzados permanecerán en el gráfico como líneas grises. De esta manera, puede ver cómo estos niveles atraen la acción del precio como un imán.

El uso del indicador para los comerciantes:

Vea los niveles de liquidez que atraerán tarde o temprano el precio.
Evite tomar posiciones largas / cortas en la dirección opuesta de los fondos de liquidez.
Si el precio se mueve hacia la liquidez, es muy probable que la zona de liquidez se cruce, parcial o incluso por completo, así que use el indicador para colocar las órdenes de toma de ganancias en el nivel de liquidez
Una reversión del mercado después de que una zona de liquidez ha sido afectada es muy poderosa, ya que la atracción del nivel de precios actual se ha ido.
No hay muchos parámetros para este indicador, pero a pedido estoy abierto a cualquier sugerencia o personalización.

Hay una versión demo de este indicador disponible para usar en el probador de estrategias.

Inmediatamente notará el uso y la efectividad de este indicador, vea el video.

Gracias por compartir, por favor deje un comentario o comentario.

IMPORTANTE: Algunos cálculos se basan en el indicador Zig Zag predeterminado, que debe estar presente en la carpeta de indicadores raíz.
Comentarios 5
gijs_best_service
21
gijs_best_service 2020.10.14 18:31 
 

Really good indicator!! Would be awesome to have some kind of manual to understand all the colors. Have been making good profits since using this indicator. Hope seller will respond on chat!

macdours
19
macdours 2020.11.05 00:10 
 

I too purchased the indicator but I am having to try and figure it out on my own, since there is no manual that comes with the indicator. I can see how it could be profitable but I have not used it yet. I have been waiting for the United States elections to finish up. If the seller could respond with a manual that would be extremely helpful.

Productos recomendados
Daily Candle Predictor es un indicador que predice el precio de cierre de una vela. El indicador está destinado principalmente para su uso en gráficos D1. Este indicador es adecuado tanto para el comercio de divisas tradicional como para el comercio de opciones binarias. El indicador se puede utilizar como un sistema de negociación independiente o puede actuar como una adición a su sistema de negociación existente. Este indicador analiza la vela actual, calculando ciertos factores de fuerza dent
PZ Harmonacci Patterns
PZ TRADING SLU
3.17 (6)
Este es posiblemente el indicador de reconocimiento automático de formación de precios más completo que puede encontrar para la plataforma MetaTrader. Detecta 19 patrones diferentes, toma las proyecciones de Fibonacci tan en serio como usted, muestra la zona de reversión potencial (PRZ) y encuentra niveles adecuados de stop-loss y take-profit. [ Guía de instalación | Guía de actualización | Solución de problemas | FAQ | Todos los productos ] Detecta 19 formaciones de precios armónicos diferen
PZ Support Resistance
PZ TRADING SLU
3.33 (3)
¿Cansado de trazar líneas de soporte y resistencia? La resistencia de soporte es un indicador de marco de tiempo múltiple que detecta y traza automáticamente los soportes y las líneas de resistencia en el gráfico con un giro muy interesante: a medida que los niveles de precios se prueban con el tiempo y aumenta su importancia, las líneas se vuelven más gruesas y oscuras. [ Guía de instalación | Guía de actualización | Solución de problemas | FAQ | Todos los productos ] Mejora tu análisis técnic
This indicator is, without a doubt, the best variation of the Gann Angles among others. It allows traders using Gann methods to automatically calculate the Gann angles for the traded instrument. The scale is automatically calculated when the indicator is attached to the chart. When switching timeframes, the indicator recalculates the scale for the current timeframe. Additionally, you can enter your own scales for the Gann angles. You can enter your own scales either for both vectors or for each
The Penta-O is a 6-point retracement harmonacci pattern which usually precedes big market movements. Penta-O patterns can expand and repaint quite a bit. To make things easier this indicator implements a twist: it waits for a donchian breakout in the right direction before signaling the trade. The end result is an otherwise repainting indicator with a very reliable trading signal. The donchian breakout period is entered as an input. [ Installation Guide | Update Guide | Troubleshooting | FAQ | A
Mean Reversion Supply Demand Indicator Mean Reversion Supply Demand is the indicator to detect the important supply demand zone in your chart. The concept of supply demand trading relies on the quantity mismatching between buying and selling volumes in the financial market. Typically, supply demand zone serves to predict the turning point. The wave pattern, for any supply demand zone to work as an successful trade, looks like the price must touch the base zone, move away and then return to zone
Blahtech Market Profile
Blahtech Limited
4.53 (15)
Was: $249  Now: $149   Market Profile defines a number of day types that can help the trader to determine market behaviour. A key feature is the Value Area, representing the range of price action where 70% of trading took place. Understanding the Value Area can give traders valuable insight into market direction and establish the higher odds trade. It is an excellent addition to any system you may be using. Blahtech Limited presents their Market Profile indicator for the MetaTrader community. In
Price Breakout pattern Scanner is the automatic scanner for traders and investors. It can detect following patterns automatically from your chart. Head and Shoulder - Common tradable pattern. Reverse Head and Shoulder - This pattern is the reverse formation of the Head and Shoulder. Double Top - When the price hits resistance level twice and decline toward the support level, the trader can anticipate sudden bearish breakout through the support level. Double Bottom - The double bottom pattern is
Monster Harmonic Indicator
Paul Geirnaerdt
4.59 (29)
Monster Harmonics Indicator is a harmonic pattern indicator. It recognizes Gartley, Bat, Crab, Butterfly, Cypher, White Swan, Black Swan, Shark and several other patterns. Projected patterns that are not yet completed are recognized, too. Monster even shows the PRZ (Potential Reversal Zone). Users can add their own user defined patterns to Monster. Besides the current pattern, Monster also shows all patterns in the symbols history. Monster will provide alerts for developing patterns. Introduced
This is an arrow indicator without a future function,developed based on the most advanced profit trading algorithms.It has the most innovative and advanced dual trend analysis module, as well as the latest and highly effective market trend prediction algorithm.Trends are your friends, and following larger trends can earn the maximum profit in foreign exchange. This indicator helps traders identify current trends and track them. Someone once made a profit of 10 times in a week by relying on it.No
RTrends
Nikolay Likhovid
The RTrends indicator does two things: first, it automatically draws the layout of the price chart by plotting trend lines and, secondly, it produces bearish and bullish signals. The layout reflects the fractal nature of the market. Trends from different time horizons are applied simultaneously on the chart. Thus, from a single chart a trader can see trend lines of higher timeframes. The lines, depending on the horizon, differ in color and width: the older the horizon, the thicker the line is. T
This is the FXTraderariel-TakeProfit - Stop Loss Indicator . It provides you 3 potential Take Profits and 1 Stop Loss. These potential targets are computed based on several methods . The indicator can be used on every time frame, but we advise to use it on H1, H4 and D1. Especially if you are a novice trader. Pro Traders can also you use it for scalping in smaller time frames (M1, M5 and M15). This indicator is not a complete trading system. It doesn't provide you a Signal nor can predict the m
Gold Bricks FX USES THE TREND WAVE INDICATOR AND IT CAN IDENTIFY THE BEGINNING AND THE END OF A NEW WAVE TREND MOVEMENT. AS AN OSCILLATOR, THE INDICATOR IDENTIFIES THE OVERBOUGHT AND OVERSOLD ZONES. IT WORKS GREAT TO CATCH THE SHORT TERM PRICE REVERSALS AND USES A MARTINGALE STRATEGY TO CLOSE ALL TRADES IN PROFIT. USE DEFAULT SETTINGS ON H1 OR HIGHER TIME FRAME ON ANY PAIR FOR MORE ACCURATE TRADES WHY THIS EA : Smart entries calculated by 4 great strategies The EA can be run on even a $300
Antabod Gamechanger
Rev Anthony Olusegun Aboderin
*Antabod GameChanger Indicator – Transform Your Trading!*   Are you tired of chasing trends too late or second-guessing your trades? The *Antabod GameChanger Indicator* is here to *revolutionize your trading strategy* and give you the edge you need in the markets!   Why Choose GameChanger? *Accurate Trend Detection* – GameChanger identifies trend reversals with *pinpoint accuracy*, ensuring you enter and exit trades at the optimal time.   *Clear Buy & Sell Signals* – No more guesswork! T
Shark Deal Book
Philip Pankaj Suthagar
4 (3)
Term  "shark"  in the business world denotes a high volume investor who just made a good investment in a highly Potential business deal.So, sharks are the ones who make the market move. In our case, if an American shark bought a Japanese company, he/she has to convert American dollars into Japanese yen to make the deal. So, the demand for the Japanese yen will increase sharply. Thus USD/JPY will go short rapidly if the deal was from the shark. Another example, In the case of forex, if fed increa
El indicador SMC Venom Model BPR es una herramienta profesional para operadores que trabajan con el concepto de Dinero Inteligente (SMC). Identifica automáticamente dos patrones clave en el gráfico de precios: FVG   (Fair Value Gap) es una combinación de tres velas, con un gap entre la primera y la tercera. Forma una zona entre niveles donde no hay soporte de volumen, lo que suele provocar una corrección del precio. BPR   (Balanced Price Range) es una combinación de dos patrones FVG que forman
Intraday Levels Advanced fragmenta cada sesión en zonas para trading intradía. Realiza una rejilla de las zonas de precios de cada sesión, sirve como guía para establecer la tendencia de la sesión, las mejores zonas para realizar entradas y las distancias para stop-loss y take-profit. Los parámetros son: Levels Mode: Uno entre los siguientes: Modo Basic: Dibuja los niveles máximo, mínimo y medio de la sesión. Modo Advanced: Dibuja los niveles máximo, mínimo, central e intermedios de la sesión.
Introduction to Chart Pattern MT Chart Pattern MT is a chart pattern scanner to detect the triangle pattern, falling wedge pattern, rising wedge pattern, channel pattern and so on. Chart Pattern MT uses highly sophisticated chart pattern detection algorithm. However, we have designed it in the easy to use with intuitive user interface. Chart Pattern MT will show all the patterns in your chart in the most efficient format for your trading. You do not have to do tedious manual pattern detection an
In the stock market technical analysis, support and resistance is a concept that the movement of the price of a security will tend to stop and reverse at certain predetermined price levels. Support and resistance levels can be identified on any timeframe. However, the most significant ones are found on the higher time frames, such as daily, weekly, and monthly. This indicator using the weekly OHLC data to identify the relevant levels. This is a support and resistance indicator and providing majo
KT Renko Patterns MT4
KEENBASE SOFTWARE SOLUTIONS
2.33 (3)
KT Renko Patterns analiza el gráfico Renko ladrillo por ladrillo para encontrar patrones gráficos populares que son ampliamente utilizados por los traders en diferentes mercados financieros. En comparación con los gráficos basados en tiempo, los patrones son más fáciles de identificar en los gráficos Renko debido a su aspecto limpio y sin ruido. KT Renko Patterns incluye múltiples patrones Renko, muchos de los cuales están explicados en detalle en el libro “Profitable Trading with Renko Charts
Fourteen plus nine TD Sequential
MOHAMMED IMAD HUSSEIN BASSEE
Fourteen plus nine What is it for? Applying Tom DeMark’s TD Sequential serves the purpose of identifying a price point where an uptrend or a downtrend exhausts itself and reverses. . What are the main components of TD Sequential? TD Sequential has two parts – TD Setup and TD Countdown. The first phase of TD Sequential starts with a TD Setup and is completed with a 9 count. When the 9 count is completed, it is at that point, a price pause, price pullback, or reversal is likely. It is also at tha
VR Cub
Vladimir Pastushak
VR Cub es un indicador para obtener puntos de entrada de alta calidad. El indicador fue desarrollado para facilitar los cálculos matemáticos y simplificar la búsqueda de puntos de entrada a una posición. La estrategia comercial para la cual se diseñó el indicador ha demostrado su eficacia durante muchos años. La simplicidad de la estrategia comercial es su gran ventaja, que permite que incluso los operadores novatos negocien con éxito con ella. VR Cub calcula los puntos de apertura de posiciones
Super Reversal Pattern
Parfait Mujinga Ndalika
Super Reversal Pattern Indicator Unlock the power of advanced pattern recognition with our Super Reversal Pattern Indicator. Designed for traders seeking precision and reliability, this indicator identifies one of the most effective reversal patterns in technical analysis, offering a significant edge in your trading strategy. Key Features: Non-Repainting Accuracy: Enjoy the confidence of non-repainting technology. Once a Super Reversal Pattern is detected, it remains static, providing consiste
Difícil de encontrar y escasa en frecuencia, las divergencias son uno de los escenarios comerciales más confiables. Este indicador busca y escanea las divergencias regulares y ocultas automáticamente usando su oscilador favorito. [ Guía de instalación | Guía de actualización | Solución de problemas | FAQ | Todos los productos ] Fácil de comerciar Encuentra divergencias regulares y ocultas Admite muchos osciladores bien conocidos Implementa señales comerciales basadas en rupturas Muestra nive
Afeitadora de mercado   revendedor de mercado Este indicador es parte de los sistemas RPTrade Pro Solutions. Market Scalper es un indicador de tendencia diario que utiliza Price Action, Dynamic Support y Resistances. Está diseñado para ser utilizado por cualquier persona, incluso el principiante absoluto en el comercio puede usarlo. NUNCA repintar. Las indicaciones se dan de cierre a cierre. Diseñado para usarse solo, no se requieren otros indicadores. Te da indicaciones claras y sencillas C
The Chaikin Oscillator is a technical indicator developed by Marc Chaikin that combines price and volume data to measure the accumulation and distribution of a financial instrument. It aims to identify potential buying and selling opportunities in the market. The Chaikin Oscillator is calculated by subtracting a 10-day exponential moving average of the Accumulation Distribution Line (ADL) from a 3-day exponential moving average of the ADL. Here's how to use the Chaikin Oscillator indicator in tr
How to use Pair Trading Station Pair Trading Station is recommended for H1 time frame and you can use it for any currency pairs. To generate buy and sell signal, follow few steps below to apply Pair Trading Station to your MetaTrader terminal. When you load Pair Trading Station on your chart, Pair Trading station will assess available historical data in your MetaTrader platforms for each currency pair. On your chart, the amount of historical data available will be displayed for each currency pai
Gravitas
Francesco Grassi
Gravitas indicator – High quality / Non-repainting Signals for day trading If you are sick and tired of not being profitable each month or you simply want a safe earning while you are studying the markets or while you practice and master your strategy give this indicator a try. I called this indicator “Gravitas” as indication of seriousness and importance that trading is for me and respect for the market and the other traders involved in it. I developed it last
This is a new strategy for SUPPLY DEMAND areas It is based on a calculation using the tick volume to detect the big price action in market for both bear /bull actions this smart volume action candles are used to determine the supply and demand areas prices in between main supply and demand lines indicate sideway market  up arrows will be shown when prices moves above the main supply and the secondary supply lines Down arrows will be shown when prices moves below the main demand and the secondary
Gold Phoenix
Yaroslav Varankin
The perfect tool for Scalng in the Forex markets You can trade both from signal to signal and using take profit  The algorithm does not use Zigzag!  No redrawing!  This is a channel instrument that uses a moving average as a filter. Moving Average  There are 2 parameters for the settings Ma Period = 5 period Moving Average  Channel 1.0 distance of channel lines from the chart Price Signal Filter - calculation of signal opening and filter There is a complete set of Alert There is a multi-timefram
Los compradores de este producto también adquieren
Cycle Maestro
Stefano Frisetti
NOTE: CYCLEMAESTRO is distributed only on this website, there are no other distributors. Demo version is for reference only and is not supported. Full versione is perfectly functional and it is supported CYCLEMAESTRO , the first and only indicator of Cyclic Analysis, useful for giving signals of TRADING, BUY, SELL, STOP LOSS, ADDING. Created on the logic of Serghei Istrati and programmed by Stefano Frisetti ; CYCLEMAESTRO is not an indicator like the others, the challenge was to interpret only t
Scalper Inside PRO
Alexey Minkov
4.76 (63)
!SPECIAL SALE! An exclusive indicator that utilizes an innovative algorithm to swiftly and accurately determine the market trend. The indicator automatically calculates opening, closing, and profit levels, providing detailed trading statistics. With these features, you can choose the most appropriate trading instrument for the current market conditions. Additionally, you can easily integrate your own arrow indicators into Scalper Inside Pro to quickly evaluate their statistics and profitability
¡Actualmente 20% OFF ! ¡La mejor solución para cualquier novato o trader experto! Este software funciona con 28 pares de divisas. Se basa en 2 de nuestros principales indicadores (Advanced Currency Strength 28 y Advanced Currency Impulse). Proporciona una gran visión general de todo el mercado de divisas. Muestra los valores de Advanced Currency Strength, la velocidad de movimiento de las divisas y las señales para 28 pares de divisas en todos los (9) marcos temporales. Imagine cómo mejorará
GOLD Impulse with Alert
Bernhard Schweigert
4.6 (10)
Este indicador es una super combinación de nuestros 2 productos Advanced Currency IMPULSE with ALERT  +   Currency Strength Exotics . ¡Funciona para todos los marcos de tiempo y muestra gráficamente el impulso de fuerza o debilidad para las 8 divisas principales más un Símbolo! Este Indicador está especializado en mostrar la aceleración de la fuerza de la divisa para cualquier símbolo como Oro, Pares Exóticos, Materias Primas, Índices o Futuros. Es el primero de su clase, cualquier símbolo p
Golden Trend Indicator
Noha Mohamed Fathy Younes Badr
5 (10)
Golden Trend indicator  is The best indicator for predicting trend movement this indicator never lags and never repaints and never back paints    and give  arrow buy and sell    before the candle appear  and it will help you and  will make your trading decisions clearer its work on all currencies and  gold and crypto and all time frame This unique  indicator uses very secret algorithms to catch the  trends, so you can trade using this indicator and see the trend clear on charts  manual guide and
Enigmera
Ivan Stefanov
5 (7)
ENIGMERA: El núcleo del mercado Importante: La demostración de MQL5.com se ejecuta en el Strategy Tester y puede no reflejar completamente la funcionalidad de Enigmera. Consulta la descripción, las capturas de pantalla y el video para más detalles. ¡No dudes en contactarme si tienes alguna pregunta! El código del indicador ha sido completamente reescrito. La versión 3.0 añade nuevas funcionalidades y elimina errores acumulados desde el inicio del indicador. Introducción Este indicador y sistem
TPSproTREND PrO
Roman Podpora
4.68 (25)
VERSION MT5        —        ИНСТРУКЦИЯ RUS           —        INSTRUCTIONS  ENG Funciones principales: Señales de entrada precisas ¡SIN RENDERIZACIÓN! Si aparece una señal, ¡sigue siendo relevante! Esta es una diferencia importante con respecto a los indicadores de redibujo, que pueden proporcionar una señal y luego cambiarla, lo que puede provocar una pérdida de fondos depositados. Ahora puedes ingresar al mercado con mayor probabilidad y precisión. También existe la función de colorear las ve
Dynamic Forex28 Navigator
Bernhard Schweigert
5 (5)
Dynamic Forex28 Navigator: la herramienta de trading de Forex de última generación. ACTUALMENTE CON UN 49 % DE DESCUENTO. Dynamic Forex28 Navigator es la evolución de nuestros indicadores populares de larga data, que combina el poder de tres en uno: Indicador avanzado Currency Strength28 (695 reseñas) + Indicador avanzado Currency IMPULSE con ALERT (520 reseñas) + Señales combinadas CS28 (bonificación). Detalles sobre el indicador https://www.mql5.com/en/blogs/post/758844 ¿Qué ofrece el indi
RelicusRoad Pro
Relicus LLC
4.63 (104)
Manual de usuario de RelicusRoad + Videos de capacitación + Acceso al grupo privado de Discord + Estado VIP UNA NUEVA MANERA DE VER EL MERCADO RelicusRoad es el indicador comercial más poderoso del mundo para divisas, futuros, criptomonedas, acciones e índices, y brinda a los comerciantes toda la información y las herramientas que necesitan para mantenerse rentables. Brindamos análisis técnicos y planes comerciales para ayudar a todos los operadores a tener éxito, desde principiantes hasta ava
Beast Super Signal
Dustin Vlok
4.73 (89)
¿Está buscando un potente indicador de compraventa de divisas que pueda ayudarlo a identificar oportunidades comerciales rentables con facilidad? No busque más allá de Beast Super Signal. Este indicador basado en tendencias fácil de usar monitorea continuamente las condiciones del mercado, buscando nuevas tendencias en desarrollo o saltando sobre las existentes. Beast Super Signal da una señal de compra o venta cuando todas las estrategias internas se alinean y están en 100% de confluencia entr
Quantum Breakout Indicator PRO
Bogdan Ion Puscasu
4.96 (26)
Introduciendo       Quantum Breakout PRO   , el innovador indicador MQL5 que está transformando la forma en que comercia con Breakout Zones. Desarrollado por un equipo de operadores experimentados con experiencia comercial de más de 13 años,   Quantum Breakout PRO   está diseñado para impulsar su viaje comercial a nuevas alturas con su innovadora y dinámica estrategia de zona de ruptura. El indicador de ruptura cuántica le dará flechas de señal en las zonas de ruptura con 5 zonas objetivo de g
MTF Supply Demand Zones
Georgios Kalomoiropoulos
4.82 (22)
Próxima generación de zonas de oferta y demanda automatizadas. Algoritmo nuevo e innovador que funciona en cualquier gráfico. Todas las zonas se crean dinámicamente de acuerdo con la acción del precio del mercado. DOS TIPOS DE ALERTAS --> 1)CUANDO EL PRECIO LLEGA A UNA ZONA 2)CUANDO SE FORMA UNA NUEVA ZONA No obtienes un indicador inútil más. Obtiene una estrategia comercial completa con resultados probados.     Nuevas características:     Alertas cuando el precio llega a la zona de ofert
Volatility Trend System - un sistema de comercio que da señales para las entradas. El sistema de volatilidad da señales lineales y puntuales en la dirección de la tendencia, así como señales para salir de ella, sin redibujar ni demoras. El indicador de tendencia monitorea la dirección de la tendencia a mediano plazo, muestra la dirección y su cambio. El indicador de señal se basa en cambios en la volatilidad y muestra entradas en el mercado. El indicador está equipado con varios tipos de alert
Blahtech Supply Demand
Blahtech Limited
4.58 (36)
Was: $299  Now: $149   Supply Demand uses previous price action to identify potential imbalances between buyers and sellers. The key is to identify the better odds zones, not just the untouched ones. Blahtech Supply Demand indicator delivers functionality previously unavailable on any trading platform. This 4-in-1 indicator not only highlights the higher probability zones using a multi-criteria strength engine, but also combines it with multi-timeframe trend analysis, previously confirmed swings
System Trend Pro
Aleksandr Makarov
5 (2)
System Trend Pro - This is the best trend trading indicator!!! The indicator no repaint!!!  The indicator has   MTF   mode, which adds confidence to trading on the trend (   no repaint   ). Special offer!  Any 2 advisors of your choice for only 99$  Any 2 indicators of your choice for only 49$ -------------------------------------------- The offer is limited in time, don't miss this chance. Write in a private message or in telegram @AlexBotm5 How to trade? Everything is very simple, we wait fo
Royal Scalping Indicator M4
Vahidreza Heidar Gholami
4.17 (6)
Royal Scalping Indicator is an advanced price adaptive indicator designed to generate high-quality trading signals. Built-in multi-timeframe and multi-currency capabilities make it even more powerful to have configurations based on different symbols and timeframes. This indicator is perfect for scalp trades as well as swing trades. Royal Scalping is not just an indicator, but a trading strategy itself. Features Price Adaptive Trend Detector Algorithm Multi-Timeframe and Multi-Currency Trend Low
Linear Trend Predictor : un indicador de tendencia que combina puntos de entrada y líneas de soporte de dirección. Funciona según el principio de romper el canal de precios altos/bajos. El algoritmo del indicador filtra el ruido del mercado, tiene en cuenta la volatilidad y la dinámica del mercado. Capacidades del indicador  Utilizando métodos de suavizado, muestra la tendencia del mercado y los puntos de entrada para abrir órdenes de COMPRA o VENTA.  Adecuado para determinar los movimientos
Gold AMS
Aleksandr Makarov
Special offer!  Any 2 advisors of your choice for only 99$  Any 2 indicators of your choice for only 49$ -------------------------------------------- The offer is limited in time, don't miss this chance. Write in a private message or in telegram @AlexBotm5 Gold AMS   - is a good technical stock indicator. The indicator algorithm analyzes the asset price movement and reflects volatility and potential entry zones. The indicator 100% does not repaint!!! The best indicator signals: If a signal a
TPSpro RFI Levels
Roman Podpora
4.85 (27)
Zonas de reversión / Volúmenes máximos / Zonas activas de un jugador importante =       SISTEMA TS TPSPRO INSTRUCCIONES RUS       /       INSTRUCCIONES       ESP       /       Version MT5 Cada comprador de este indicador recibe adicionalmente GRATIS: 6 meses de acceso a señales comerciales del servicio RFI SIGNALS: puntos de entrada listos para usar según el algoritmo TPSproSYSTEM. Materiales de formación con actualizaciones periódicas: sumérgete en la estrategia y haz crecer tu nivel profesio
Currency Strength Exotics
Bernhard Schweigert
4.88 (32)
¡ACTUALMENTE 20% DE DESCUENTO ! ¡La mejor solución para cualquier operador novato o experto! Este indicador está especializado en mostrar la fuerza de la divisa para cualquier símbolo como Pares Exóticos, Materias Primas, Índices o Futuros. Es el primero de su clase, cualquier símbolo se puede añadir a la 9 ª línea para mostrar la verdadera fuerza de la moneda de Oro, Plata, Petróleo, DAX, US30, MXN, TRY, CNH etc. Se trata de una herramienta de trading única, de alta calidad y asequible porqu
Smart Set up Levels
Mohit Dhariwal
5 (1)
Smart Set up leve l is a very powerful indicator based on the concept of order blocks and set up entries with proper fvg and breakouts to make a very nice level to enter like a pro trader. Very easy to use interface and friendly to enter on buy and sell signals. Works Best on M15 Time frame on Gold, Bitcoin and Fx pairs. Daily 4-5 trades on each pair  Works great on gold like a pro on M15 It is non repainting nor lagging It is very powerful indicator giving precise entries and prop acts can be c
El Sincronizador de Ondas es un indicador visual de análisis de ondas. Combina secuencias de movimiento de velas y construye ondas direccionales, produciendo movimientos sincronizados con el mercado. El inicio de cada onda comienza con una flecha de señal; también incluye alertas. El indicador nunca redibujará ni moverá las flechas en el historial anterior. Las flechas de señal aparecen al cierre de la vela. Compatible con cualquier instrumento de trading y marco temporal. Fácil de usar y confi
Cycle Sniper
Elmira Memish
4.39 (36)
NEW YEAR SALE PRICE FOR LIMITED TIME!!! Please contact us after your purchase and we will send you the complimentary indicators to complete the system Cycle Sniper is not a holy grail but when you use it in a system which is explained in the videos, you will feel the difference. If you are not willing to focus on the charts designed with Cycle Sniper and other free tools we provide, we recommend not buying this indicator. We recommend watching the videos about the indiactor and system before pu
Volume by Price MT4
Brian Collard
4.67 (12)
Volume Profile, Footprint and Market Profile TPO (Time Price Opportunity). Volume and TPO histogram bar and line charts. Volume Footprint charts. TPO letter and block marker collapsed and split structure charts. Static, dynamic and flexible range segmentation and compositing methods with relative and absolute visualizations. Session hours filtering and segment concatenation with Market Watch and custom user specifications. Graphical layering, positioning and styling options to suit the user's a
IQ FX Gann Levels a precision trading indicator based on W.D. Gann’s square root methods. It plots real-time, non-repainting support and resistance levels to help traders confidently spot intraday and scalping opportunities with high accuracy. William Delbert Gann (W.D. Gann) was an exceptional market analyst, whose trading technique was based on a complex blend of mathematics, geometry, astrology, and ancient mathematics which proved to be extremely accurate. Download the Metatrader 5 Version M
Indicador cíclico para negociar y predecir la dirección del mercado. Muestra el comportamiento cíclico del precio en forma de oscilador. Da señales para abrir tratos al rebotar desde los límites superior e inferior del oscilador. En forma de histograma, muestra la fuerza suavizada de la tendencia. Complementará cualquier estrategia comercial, desde scalping hasta intradía. El indicador no se vuelve a dibujar. Adecuado para su uso en todos los símbolos/instrumentos. Marcos de tiempo adecuados par
Introduction to X3 Chart Pattern Scanner X3 Cherart Pattern Scanner is the non-repainting and non-lagging indicator detecting X3 chart patterns including Harmonic pattern, Elliott Wave pattern, X3 patterns, and Japanese Candlestick patterns. Historical patterns match with signal patterns. Hence, you can readily develop the solid trading strategy in your chart. More importantly, this superb pattern scanner can detect the optimal pattern of its kind. In addition, you can switch on and off individu
[ MT5 Version ]  [ Kill Zones ]  [ SMT Divergences ] How to trade using Order Blocks:  Click here User Interface Performance:  During testing in the strategy tester, the UI may experience lag. Rest assured, this issue is specific to the testing environment and does not affect the indicator's performance in live trading. Elevate your trading strategy with the  Order Blocks ICT Multi TF  indicator, a cutting-edge tool designed to enhance your trading decisions through advanced order block analys
Oscilador de Tendencia: Identificación de Tendencias del Mercado Suave y Fiable El Oscilador de Tendencia es un indicador avanzado para MT4, diseñado para ayudar a los traders a identificar con precisión la dirección de la tendencia y los puntos potenciales de reversión. Con una representación visual intuitiva, este indicador muestra claramente cuando el mercado está en una tendencia alcista o bajista, simplificando el análisis y mejorando la lectura del gráfico. Es adecuado para una amplia vari
Una implementación personal de Order Blocks, una estrategia de negociación de posiciones simple pero efectiva. El operador debe ingresar al mercado o buscar operaciones en la dirección del último bloque de orden, si el rango de precios no se ha roto en la dirección opuesta a la ruptura. Los bloques abiertos no se dibujan para mayor claridad. [ Guía de instalación | Guía de actualización | Solución de problemas | FAQ | Todos los productos ] Un bloque abierto alcista es la primera barra alcista d
Otros productos de este autor
Order management can become difficult, especially when many orders are open at the same time, long and short. With the standard tools from Metatrader, only one order can be changed at the time. In case you want to change the stop loss level or the take profit level of all your open orders this tool is for you. This tool allows to change easily the Stop loss level of ALL the open orders with a simple "Drag and Drop" on the chart. All the orders with the same chart symbol will be modified. Add thi
FREE
Order management can become difficult, especially when many orders are open at the same time, long and short. With the standard tools from Metatrader, only one order can be changed at the time. In case you want to change the stop loss level or the take profit level of all your open orders this tool is for you. This tool allows to change easily the Take Profit level of ALL the open orders with a simple "Drag and Drop" on the chart. All the orders with the same chart symbol will be modified. Add t
FREE
This indicator displays three forecast projections of the last market swings based on the Zig Zag indicator. Price action moves very often according to what happened in the near past, the indicator displays the price pattern that the market will possibly follow. Both short and long patterns are displayed in the chart with an indication of the target price level. If multiple projections overlap or almost overlap, then the next price movement becomes very likely. In this case it's a ranging market
Extreme Swing Indicator
Filip Maurice Daelman
3.67 (3)
Dear Trader, this is one of the most powerful signals you will find in the market place. I worked many months to improve the accuracy. Check for yourself with the demo version. Parameters are set for EURUSD. I can assist you to configure it for any other symbol or TF. It can be configured to generate more of less in-trend or contra-trend signals. Extreme Swing Indicator is a no-nonsense, no delay, no repaint indicator ! It selects buy/sell entry signals based on a number of swing calculations a
Liquidity Buy Sell Signal Indicator is a no-nonsense, no delay, no repaint indicator ! Liquidity pools together with a trend filter is the most powerful and reliable signal according to me (with the correct parameters depending on the timeframe used) It selects buy/sell entry signals based on liquidity in the market. The time range to scan for liquidity can be set in the parameters. Liquidity is an important aspect in the market, especially for institutional investors, as they need lots of liqu
Multi Level Trend Swing is an indicator that identifies the most accurate buy/sell swing points with the highest probability, based on multi-level Zig Zag Swings. The indicator paints arrows at the Higher Highs, Higher Lows, Lower Lows and Higher Lows in the chart, but based on two level Zig Zag Swing. If the fast price swing is in line with the trend of the slow price swing, then the buy/sell arrows are biggest. If the price swing is against the trend, dots are displayed to signal a Higher High
Multi MA Distance Signal Indicator is a no-nonsense, no delay, no repaint indicator ! Moving Average distance together with a trend filter is a 'simple', but very powerful and reliable signal. The current moving average distance for both a slow and a fast moving average is compared with the past MAD values. For two moving averages, all the distances between the Close price and the moving average (MAD) over a selected period of time are compared with the current MAD "Moving Average Distance". If
Multi MA Band Signal
Filip Maurice Daelman
Multi MA Band Signal Indicator is a no-nonsense, no delay, no repaint indicator ! Moving Average bands together with a RSI filter is a 'simple', but very powerful and reliable signal. Five "moving average bands" generate the signals. By default : MA25, 50, 100, 200 and 400. This can be changed in the parameters as well as the MA mode and the MA band deviation. The signal indicates the number of moving average bands that are crossed. The higher the value the stronger the signal. Two signal lev
Multi Signal
Filip Maurice Daelman
Multi Signal Indicator contains a whole series of intersting buy,sell and exit signals that can be separately turned on/off. Signals : Liquidity Pools Liquidity Pools Forecast Projection Reversal Blocks Pinbar groups Overbought/Oversold with Moving Average Band (5 MA bands) Moving Average Difference Liquidity is an important aspect in the market, especially for institutional investors, as they need lots of liquidity to enter or exit the market. Therefore, institutional traders focus more on dema
Ultimum Signal
Filip Maurice Daelman
Ultimum Signal Indicator contains the most powerful buy,sell and exit signals. They can all be be separately turned on/off, so you decide what to display on the chart ! This is my ultimum inidicator that is a no-nonsense, no delay, no repaint indicator ! Signals : Target price levels : Liquidity Pools (Liquidity voids, major supply/demand zones, and price discrepancies) Liquidity Pools Forecast Projection Market Reversals : Reversal Blocks Pinbar groups Trend and mastertrend slowdowns (indicatin
Black Cryptex
Filip Maurice Daelman
3 (1)
Extremely intelligent and complex algoritm developed for the Dax or Dow Jones Index. (1 Min Timeframe) Can also be configured for any other index or Forex pair or timeframe, but spread need to be tight. Very good risk/reward ratio. Market entry/exit at overbought/oversold price levels, based on complex calculations. Risk management is done by starting with a very small initial position. The position is optimised by averaging in an intelligent way. - Fast moving average reversal - Moving average
Multi Level Trend Direction
Filip Maurice Daelman
1 (1)
Multi Level Trend Direction is an indicator that identifies the most accurate buy/sell swing points with the highest probability, based on multi-level Zig Zag Swings. The indicator draws a color Zig Zag at the Higher Highs, Higher Lows, Lower Lows and Higher Lows in the chart, but based on two level Zig Zag Swing. If the fast price swing is in line with the trend of the slow price swing, then the buy/sell trend lines are bigger. If the price swing is against the trend, no lines are drawn to si
New market liquidity indicator, more accurate with two levels, will really unhide the "hidden agenda" of the price action in any timeframe. For more information about market liquidity, a manual on how to use this indicator please send me a message. A lot of information can be found on the net. (search liquidity trading/ inner circle trader) https://www.youtube.com/watch?v=yUpDZCbNBRI https://www.youtube.com/watch?v=2LIad2etmY8&amp ;t=2054s https://www.youtube.com/watch?v=wGsUoTCSitY&amp ;t=112
Liquidity Pools
Filip Maurice Daelman
5 (1)
Dear Traders, check out my new multi level market liquidity indicator :  https://www.mql5.com/en/market/product/73098 Many of you have been trading very good with this indicator, thanks for the support and positive feedbacks ! For more information about market liquidity, a manual on how to use this indicator please send me a message. A lot of information can be found on the net. (search liquidity trading/ inner circle trader) https://www.youtube.com/watch?v=yUpDZCbNBRI https://www.youtube.com/
New market liquidity indicator, more accurate with two levels, will really unhide the "hidden agenda" of the price action in any timeframe. Forget all other indicator and use what professional traders are using ! For more information about market liquidity, a manual on how to use this indicator please send me a message. A lot of information can be found on the net. (search liquidity trading/ inner circle trader) https://www.youtube.com/watch?v=yUpDZCbNBRI https://www.youtube.com/watch?v=2LIad2
Filtro:
tsomoney
209
tsomoney 2021.11.09 20:11 
 

El usuario no ha dejado ningún comentario para su valoración

247stocknow
192
247stocknow 2021.10.19 16:46 
 

I know what Liquidity is, but Need an Manual for your program. Defiantly would have been 5stars but no manual.

educlassic
54
educlassic 2021.01.13 04:12 
 

El usuario no ha dejado ningún comentario para su valoración

macdours
19
macdours 2020.11.05 00:10 
 

I too purchased the indicator but I am having to try and figure it out on my own, since there is no manual that comes with the indicator. I can see how it could be profitable but I have not used it yet. I have been waiting for the United States elections to finish up. If the seller could respond with a manual that would be extremely helpful.

gijs_best_service
21
gijs_best_service 2020.10.14 18:31 
 

Really good indicator!! Would be awesome to have some kind of manual to understand all the colors. Have been making good profits since using this indicator. Hope seller will respond on chat!

Respuesta al comentario
Versión 10.0 2020.07.22
Better accuracy
Versión 8.0 2020.07.13
Default set for EUR/USD
Versión 7.0 2020.07.10
Bug fixes
Versión 6.0 2020.07.08
Updates, bugfixes
Versión 5.0 2020.07.05
One indicator with different signals :

- Moving Average bands + difference
- Reversal Blocks
- Liquidity Pools
Versión 4.0 2020.07.01
Additional features
Versión 3.0 2020.07.01
Addition of reversal signals
Versión 2.0 2020.05.08
- Minor fixes
- Possibility to change the color