Trend Lines View
- Indicadores
- Emanuele Cartelli
- Versión: 1.0
- Activaciones: 5
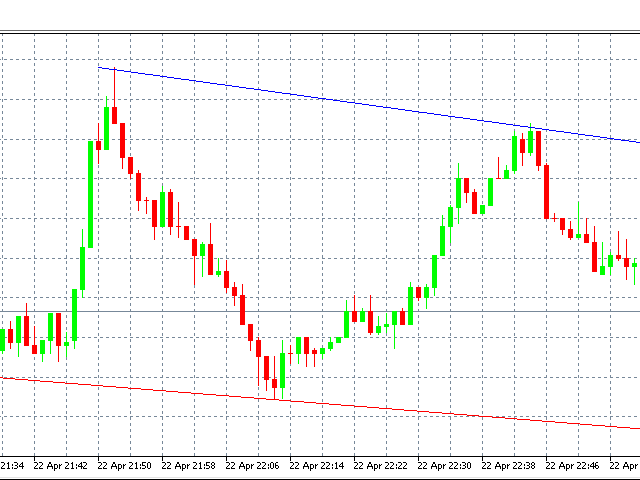
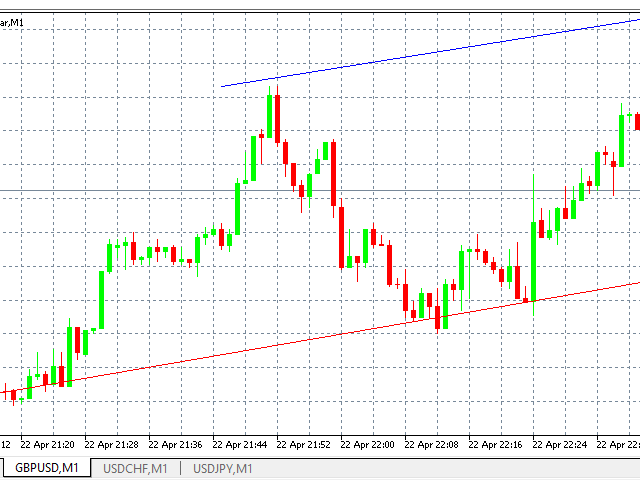
Trend Lines View draws trend lines in the current chart in the timeframe you choose, taking account of the last two maximum and minimum.
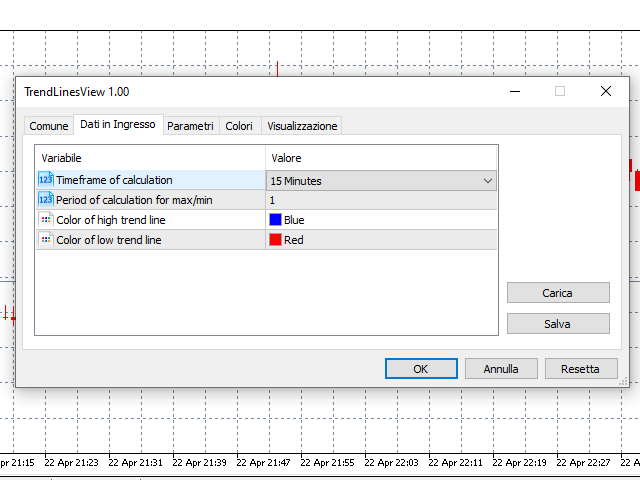
Inputs are:
- Timeframe: timeframe for calculation.
- Period of calculation Max/Min: Integer that indicates the number of bars to define a minimum or a maximum; 1 means minimum/maximum have to be the lower/higher value of 1 bar previous and 1 bar after, 2 means a the minimum/maximum have to be the lower/higher value of 2 bar previous and 2 bar after, etc.
- Color high: color of the high trend line.
- Color low: color of the low trend line.
Trend lines are useful during a trend because usually they define reverse points or breakthrought points, so it can be used to approach a trading strategy following the trend.
