Breaking Highs and Lows
- Indicadores
- Rhomeroo Ltd
- Versión: 1.0
- Activaciones: 5
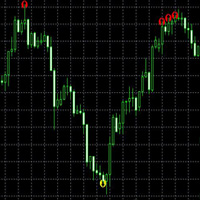
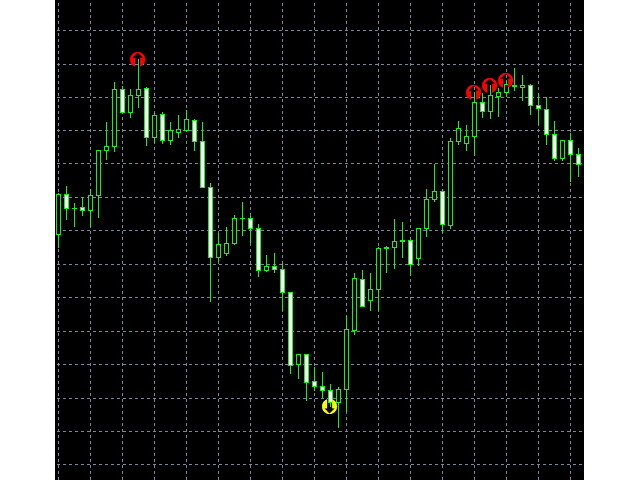
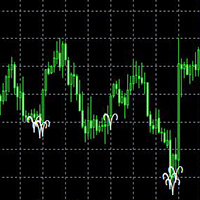
The Breaking Highs and Lows Indicator finds areas of support and resistance based on past trending activity. It uses an algorithm to compare jumps in the periods of highest highs and lowest lows.
It compares the current period with the prior period to see if there is a significant jump in periods that it has been the highest high or the lowest low for. For instance, if the current period has been the highest high for 100 days, where the prior period was the highest high for 5 days, this would be flagged by the indicator. It represents the time when the price starts testing areas of support and resistance.
A default multiple of 20 is used as an input parameter to compare the current period to the prior period. In other words, if the current period has a highest high of 100 days and the prior period has a highest high of 4 days, 100 days > 4 X 20 days, this would be flagged by the indicator.
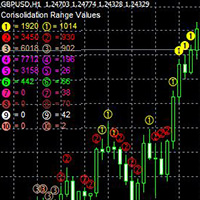
The second input parameter, Maximum Range, sets how many periods you want to compare the highest high or lowest low for.
