Multiple 15 Indicator Matrix with
- Indicadores
- Quan Zhang
- Versión: 1.0
- Activaciones: 5
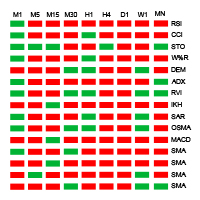
Indicator principle:
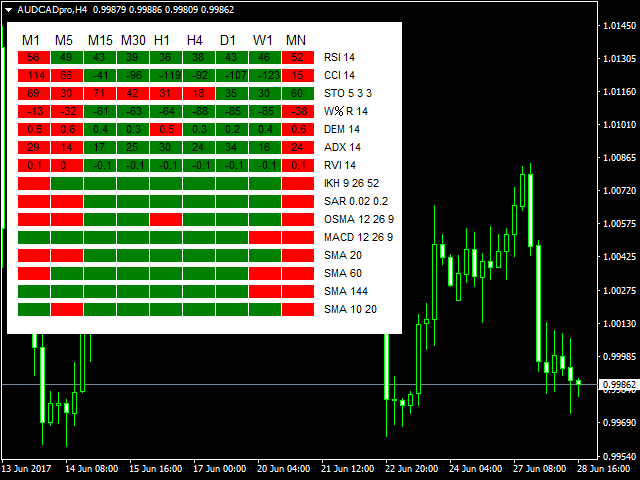
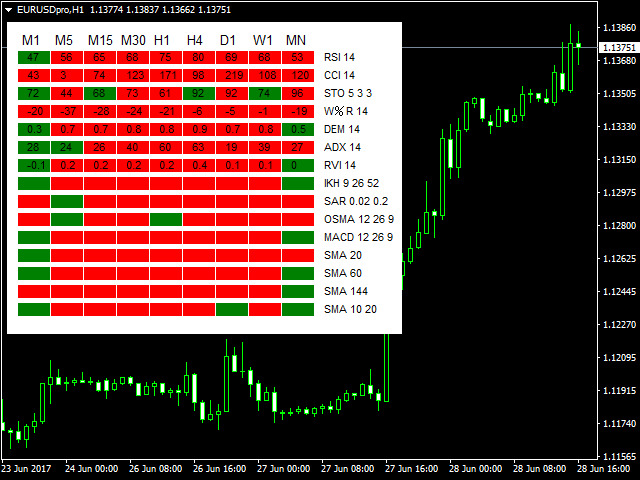
Display all cycle trends of 15 indicators in one chart
Oscillation indicator shows the current value of each cycle at the same time
(RSI, CCI, STOCHI, W% R, DEM, ADX, RVI, IKH, SAR, OSAM, MACD, moving average, moving average crossing)
RSI (Relative Strength Index)
Trend level above red below green
CCI (Commodity Channel Index)
Trend level above red below green
STOCH (Stochastic Oscillator)
Gold fork red death fork green
W% R (WilliamsPercent Range)
Trend level above red below green
DEM (Demarker)
Trend level above red below green
ADX (Average Directional Index)
+ DI line on red-DI line on green
RVI (Relative Vigor Index)
Trend level above red below green
IKH (Ichimoku Kiko Hyo)
K-line above and below the red clouds and green
SAR (Parabolic SAR)
K line above red below green
OSMA (Moving Average of Oscillator)
Cylinder above the red axis below the green
MACD (Moving Average Convergence)
Cylinder above the red axis below the green
Moving average 1
The K line is above the moving average and green below
Moving average 2
The K line is above the moving average and green below
Moving average 3
The K line is above the moving average and green below
Moving Average Cross
Moving average gold fork red moving average dead fork green
