• Información general
  • Comentarios (3)
  • Discusión (5)
  • Novedades

Angulation indicator

3.33
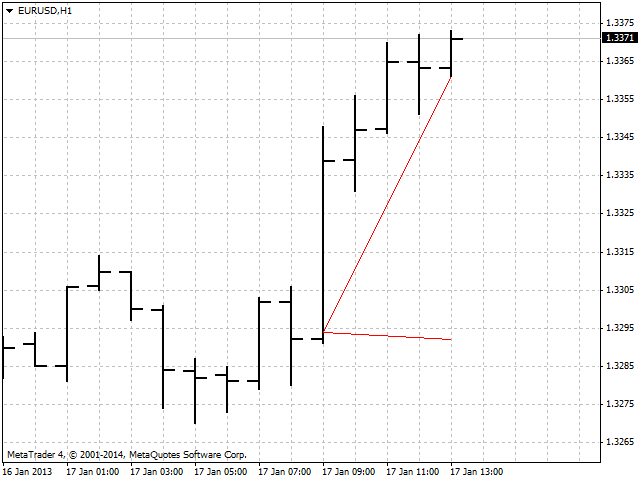
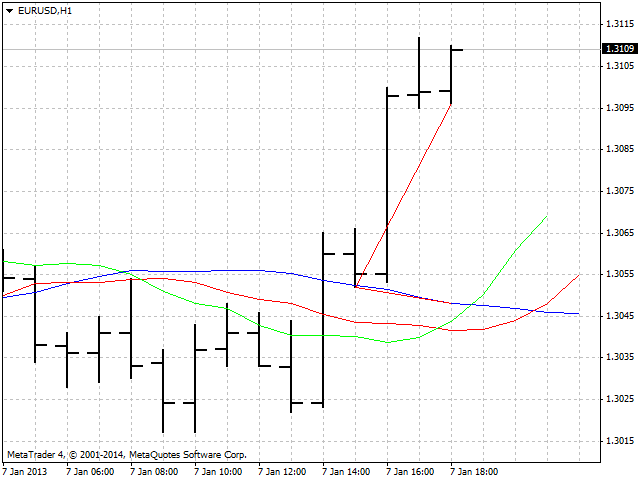
El indicador se basa en las líneas del gráfico de angulación, que le ayudará a decidirse a entrar en el mercado o quedarse fuera de ella. Se utiliza para filtrar la señal de "First Wise Man" que se describe en la estrategia de Bill Williams.
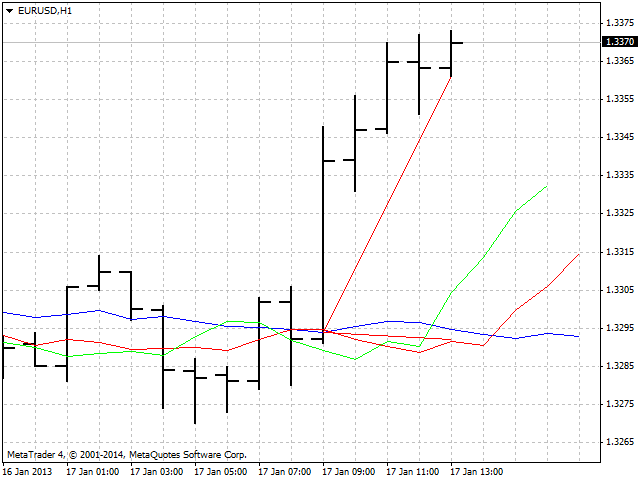
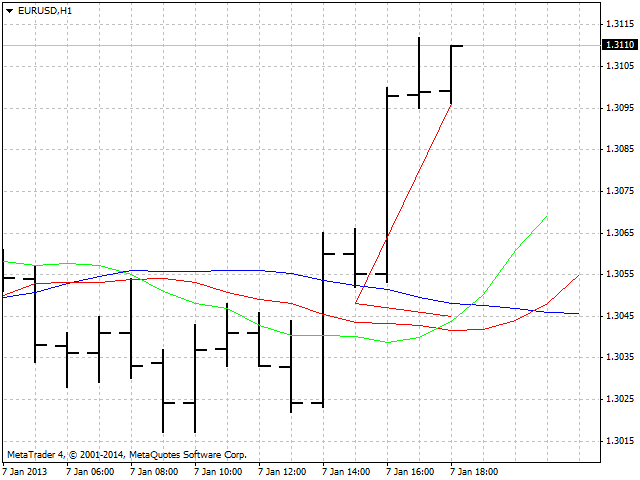
Este indicador dispalys angulación para cualquier barra que se forma después de cruzar la boca del cocodrilo (no sólo para los B/D/B).

Ajustes:
Show angulation lines - Dibujar líneas de angulación.
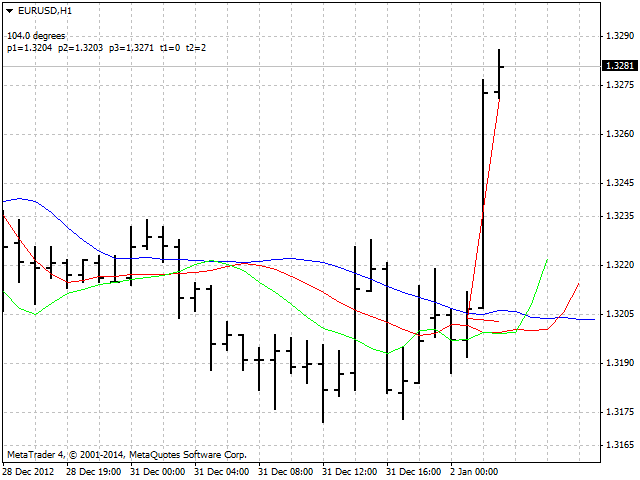
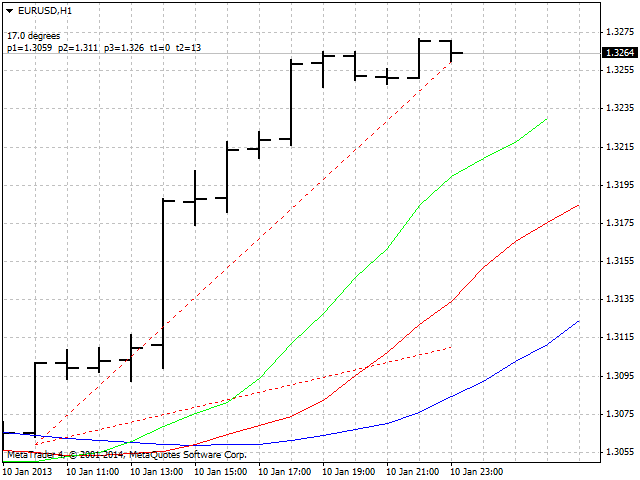
Show info - mostrar información adicional (grados de angulación, puntos de cálculo, el número de barras después de cruzar Alligator).
Minimal angle to filter - el ángulo (en grados) en la que las líneas de angulación comienzan a ser visible. El valor predeterminado es 22.
Bars to find angulation - el número de barras para encontrar la angulación después de cruzar la boca del cocodrilo. El valor predeterminado es de 20 barras.
Base of comparison - el método para encontrar la línea de base: "Only Jaws" - línea azul del cocodrilo, "Average (Jaws+Teeth)" - la media aritmética entre las líneas roja y azul de Alligator. El valor predeterminado es - "Average (Jaws+Teeth)".
Vertical-Horizontal ratio - la relación de la resolución de su monitor de forma vertical y horizontal (en porcentaje). Por ejemplo, un monitor con una resolución de 1600x900 píxeles - será del 56%. El valor predeterminado es 60.
Colors - los ajustes de color para las líneas indicadoras.

Productos recomendados
El Capturador de Tendencias: La Estrategia del Capturador de Tendencias con Indicador de Alerta es una herramienta versátil de análisis técnico que ayuda a los traders a identificar las tendencias del mercado y los posibles puntos de entrada y salida. Presenta una Estrategia dinámica del Capturador de Tendencias, adaptándose a las condiciones del mercado para una clara representación visual de la dirección de la tendencia. Los traders pueden personalizar los parámetros para que se ajusten a s
FREE
Free automatic Fibonacci is an indicator that automatically plots a Fibonacci retracement based on the number of bars you select on the BarsToScan setting in the indicator. The Fibonacci is automatically updated in real time as new highest and lowest values appears amongst the selected bars. You can select which level values to be displayed in the indicator settings. You can also select the color of the levels thus enabling the trader to be able to attach the indicator several times with differe
FREE
Trend Ray
Andriy Sydoruk
The indicator shows the potential trend direction by cyclical-wave dependence. Thus, all the rays of the intersection will be optimal rays, in the direction of which the price is expected to move, taking into account the indicator period. Rays can be used as a direction for potential market movement. But we must not forget that the approach must be comprehensive, the indicator signals require additional information to enter the market.
Sto Signal AM
Andriy Matviyevs'kyy
5 (1)
This indicator displays Stochastic osc signals on the price chart and allows the user to receive notifications of such signals. The Stochastic indicator is a classic and proven indicator of the technical analysis of the markets. Despite its age, it is still relevant today. Depending on the settings, the indicator allows you to work effectively on various TFs and any markets. Signals are given on fully formed bars and are not redrawn. Custom Parameters: Stochastic_Price (0-1) - The applied pric
FREE
Reversal Monster Mini
Abdulfattah Yahya Mohammed Alhazmi
The Most advanced and comprehensive EA to trade Trend Reversals/Pullbacks It is a very profitable EA, to trade trends breakout, and manage trades, takeprofit, stoploss, move to breakeven, and trailing stop. The   “Reversal Monster EA”   trades Reversal/Pullbacks when the current price of the pair pullback to a predefined horizontal level or trendline on the currency chart. The opening of the position can be immediate after pullback to the drawn trendline or after closing the candle below/abov
FREE
COG LR Osc AM
Andriy Matviyevs'kyy
The presented indicator allows you to determine potential entry points into the market and set protective orders at reasonable levels. This product can be useful for both beginners and experienced traders. The indicator is based on calculation methods proven by time and practicing traders. The indicator is calculated in two stages: At the first stage, linear regression (LR) of the selected price type is determined for a given number of chart periods. At the second stage, the obtained data is p
FREE
Follow The Line
Oliver Gideon Amofa Appiah
4.07 (14)
FOLLOW THE LINE GET THE FULL VERSION HERE: https://www.mql5.com/en/market/product/36024 This indicator obeys the popular maxim that: "THE TREND IS YOUR FRIEND" It paints a GREEN line for BUY and also paints a RED line for SELL.  It gives alarms and alerts of all kinds. IT DOES NOT REPAINT and can be used for all currency pairs and timeframes. Yes, as easy and simple as that. Even a newbie can use it to make great and reliable trades. NB: For best results, get my other premium indicators for more
FREE
"Fractales ajustables": es una versión avanzada del indicador fractal, ¡una herramienta comercial muy útil! Como sabemos, el indicador Standard fractals mt4 no tiene ninguna configuración, lo que es muy inconveniente para los traders. Ajustable Fractals ha resuelto ese problema: tiene todas las configuraciones necesarias: Período ajustable del indicador (valores recomendados - superiores a 7) Distancia ajustable desde máximos/mínimos de precio Diseño ajustable de flechas fractales. // Más a
Fibonacci SR Indicator Este indicador dibuja las líneas de soporte y resistencia. El producto se basa en los niveles de retroceso y expansión de Fibonacci (Fibonacci Retracement and Extension levels). El indicador toma en consideración múltiples combinaciones de los niveles de Fibonacci y dibuja las líneas de soporte/resistencia. En sus cálculos el indicador utiliza los valores de las crestas y los valles construidos por el indicador ZigZag. Si hace falta, también se puede mostrar el ZigZag en e
FREE
TrendPlus
Sivakumar Subbaiya
4.21 (14)
Trend Plus   Trendplus  Indicator   Time Frame: Suitable for any time frame.  Purpose: Trend Prediction. Blue and red candle indicate the buy and sell call respectively. Buy: When the blue candle is formed buy call is initiated. close the buy trades when the next red candle will formed.   Sell: When the Red candle is formed Sell call is initiated. close the Sell trades when the next blue candle will formed.   Happy trade!!
FREE
Wise Men Indicator demo
Bohdan Kasyanenko
3.67 (3)
The indicator displays signals according to the strategy of Bill Williams on the chart. Demo version of the indicator has the same features as the paid, except that it can work only on a demo account . Signal "First Wise Man" is formed when there is a divergent bar with angulation.  Bullish divergent bar - with lower minimum and closing price in the upper half. Bearish divergent bar - higher maximum and the closing price at the bottom half. Angulation is formed when all three lines of Alligat
FREE
LR Candles AM
Andriy Matviyevs'kyy
This indicator displays candle prices on the chart, colored according to the data of a linear regression of various prices (at the user's choice) for a selected period of time. The user has the option to select two different price types and two different time periods. The indicator will display the moments of coincidence of the directions of the linear regression. Usage: After the full formation of a candle colored in the opposite color to the previous candle, place a stop order at the high /
FREE
Major Support and Resistance Indicator
Ahmad Ar Abedalaziz Alazaizeh
5 (1)
This indicator filters the Zigzag indicator to calculate the main support and resistance levels. Variables minimum gap between peaks : is the distance (GAP) between the peaks of the Zigzag peaks sensitivity : Minimum number of nearby peaks look back: it means that it has to test the last 50 peaks in the Zigzag object name perfix: a prefix for level’s line name on chart
FREE
LineBreakMT4
Nattadecha Tangpakinwat
Key Features: Type of Indicator: Line Break Chart Indicator Usage: Identifying trend reversals and potential market turning points. Input Parameters: The primary input parameter is 'Lines_Break,' which represents the number of lines the price needs to move to create a new line in the opposite direction. How it works: The indicator draws green and red histogram bars to represent the line break chart. Green bars indicate an upward trend, and red bars indicate a downward trend. The indicator calcul
FREE
Two Period RSI
Libertas LLC
4.5 (8)
Two Period RSI compares long-term and short-term RSI lines, and plots a fill between them for improved visualization. Fill is colored differently according to an uptrend (short period RSI above long period RSI) or a downtrend (short period RSI below long period RSI). Short-term RSI crossing long-term RSI adds a more robust trend confirmation signal than using single period RSI alone. This is a small tool to help visualize and confirm RSI trends. We hope you enjoy! Looking for RSI alerts? You can
FREE
Description: The indicator measures, through the zigzag indicator, the levels of trend or correction. It shows in the chart the levels of each low or high detected. KEY LINKS:   How to Install  –  Frequent Questions  -  All Products  How is this indicator useful? This indicator determines, depending on Zigzag parameter if a trend is beginning, developing, or ending This indicator determines the direction of the trend Components Levels as positive or negative numbers, depending on the direction
FREE
UPD1 Fibo Levels
Vitaliy Kuznetsov
5 (3)
El indicador analiza el número especificado de velas y traza los niveles de Fibonacci en función del máximo-mínimo. Dado que los niveles se están reorganizando, estamos interesados ​​en el lado derecho del rango. El precio ima a los niveles y reacciona al tacto. Utilice esta herramienta para encontrar un punto de entrada de tendencia después de una corrección. Si a la izquierda vemos que los niveles han subido perfectamente, entonces podemos suponer que hemos encontrado el final del movimiento e
FREE
CAP Channel Trading
MEETALGO LLC
3.92 (140)
The CAP Channel Trading is a volatility-based indicator that makes use of the “advanced envelope theory”. These envelopes consist of two outer lines. Envelope theory states that the market price will generally fall between the boundaries of the envelope (or channel). If prices move outside the envelope, it is a trading signal or trading opportunity. Benefits of the Channel Trading Indicator CAP Channel Trading works with any asset It can be applied to any financial assets: forex, cryptocu
FREE
Triple RSI
Pablo Leonardo Spata
2.5 (2)
MIRA LA SIGUIENTE ESTRATEGIA CON ESTE INDICADOR. Triple RSI es una herramienta que utiliza el clásico RSI, pero en varios períodos de tiempo para encontrar reversiones del mercado.    1.  ️ Idea detrás del indicador y su estrategia: En el trading, ya sea Forex o cualquier otro activo, lo ideal es mantenerlo simple, cuanto más simple, mejor . La estrategia triple RSI es una de las estrategias simples que buscan retornos de mercado. En nuestra experiencia, donde siempre hay más dinero p
FREE
Multi Divergence Indicator for MT4 - User Guide Introduction Overview of the Multi Divergence Indicator and its capabilities in identifying divergences across multiple indicators. Importance of divergence detection in enhancing trading strategies and decision-making. List of Indicators RSI CCI MACD STOCHASTIC AWSOME MFI ACCELERATOR OSMA MOMENTUM WPR( Williams %R) RVI Indicator Features Indicator Selection: How to enable/disable specific indicators (RSI, CCI, MACD, etc.) for divergence detection.
FREE
MASi Three Screens
Aleksey Terentev
5 (3)
MASi Three Screens is based on the trading strategy by Dr. Alexander Elder. This indicator is a collection of algorithms. Algorithms are based on the analysis of charts of several timeframes. You can apply any of the provided algorithms. List of versions of algorithms:     ThreeScreens v1.0 - A simple implementation, with analysis of the MACD line;     ThreeScreens v1.1 - A simple implementation, with analysis of the MACD histogram;     ThreeScreens v1.2 - Combines the first two algorithms
FREE
¡El Asesor Experto de EA Black Box ya está adelantado a su tiempo! - un algoritmo comercial que incluye patrones armónicos clave Tiene patrones armónicos: Patrón_alcista_5-0 Patrón_bajista_5-0 Tres_impulsos_bajistas Tres_impulsos_alcistas Canal de Telegram de nuestra comunidad - https://t.me/EAQuantumLab Sitio oficial de la comunidad: https://eaquantumlab.com Las señales reales están disponibles aquí: https://www.mql5.com/en/users/vitalvasa/seller Depósito mínimo para operar 1000$ Utili
KTrade Fibo
Kaijun Wang
4.89 (9)
Necessary for traders: tools and indicators Waves automatically calculate indicators, channel trend trading Perfect trend-wave automatic calculation channel calculation , MT4 Perfect trend-wave automatic calculation channel calculation , MT5 Local Trading copying Easy And Fast Copy , MT4 Easy And Fast Copy , MT5 Local Trading copying For DEMO Easy And Fast Copy , MT4 DEMO Easy And Fast Copy , MT5 DEMO Fibo: from KTrade 1. Automatically calculate and analyze the band. -> Get the desired band 2.
FREE
Necessary for traders: tools and indicators Waves automatically calculate indicators, channel trend trading Perfect trend-wave automatic calculation channel calculation , MT4 Perfect trend-wave automatic calculation channel calculation , MT5 Local Trading copying Easy And Fast Copy , MT4 Easy And Fast Copy , MT5 Local Trading copying For DEMO Easy And Fast Copy , MT4 DEMO Easy And Fast Copy , MT5 DEMO The homeopathic indicator is also called the CCI indicator. The CCI indicator was propos
FREE
FusionAlert StochRSI Master is an indicator available for MT4/MT5 platforms, it is a combination of RSI & Stochastic indicator which provide "alerts" when the market is inside "overbought and oversold" regions combined for both indicators, results in more precise and accurate signals to be used as a wonderful tool, in the form of "buy or sell" signals. This indicator comes with many customization options mentioned in the parameter section below, user can customise these parameters as needful. Jo
FREE
PZ Trendlines
PZ TRADING SLU
4.64 (11)
Tired of plotting trendlines? The PZ TrendLines indicator applies a mechanical approach to the construction of trend lines for you!  [ Installation Guide | Update Guide | Troubleshooting | FAQ | All Products ] It can draw up to 18 trendlines Trendlines can be optionally based on fractals Each line represents a breakout level Each trendline can be broken or rejected Configurable amount of lines Configurable colors Support I am happy to provide free products but given my limited time, they come
FREE
Necessary for traders: tools and indicators Waves automatically calculate indicators, channel trend trading Perfect trend-wave automatic calculation channel calculation , MT4 Perfect trend-wave automatic calculation channel calculation , MT5 Local Trading copying Easy And Fast Copy , MT4 Easy And Fast Copy , MT5 Local Trading copying For DEMO Easy And Fast Copy , MT4 DEMO Easy And Fast Copy , MT5 DEMO Can set the cycle for other varieties of K line graph covered this window, fluctuations obse
FREE
History Trading Path
Kaijun Wang
4.43 (7)
Necessary for traders: tools and indicators Waves automatically calculate indicators, channel trend trading Perfect trend-wave automatic calculation channel calculation , MT4 Perfect trend-wave automatic calculation channel calculation , MT5 Local Trading copying Easy And Fast Copy , MT4 Easy And Fast Copy , MT5 Local Trading copying For DEMO Easy And Fast Copy , MT4 DEMO Easy And Fast Copy , MT5 DEMO Strongly recommend trend indicators,   automatic calculation of wave standard   and   MT5 ve
FREE
New version 8.00 is available. In this version, I tried to take into account the wishes of the user. Each of you can also take part in the improvement of this advisor. In the default settings, the adviser opens trades when the extremum point is broken       standard indicator       Zigzag. When the upper point of the zigzag extremum is broken, it opens a buy deal, and when the lower point of the zigzag extremum is broken, it opens a sell deal. In addition to the standard ZigZag indicator, whi
FREE
MTF Heiken Ashi MA is a multiple timeframe Heiken Ashi & Moving Average indicator. Fully customizable for advanced & unique Heiken Ashi & Moving Average calculations. Key Features Modified appearance and appeal from the traditional using only H eiken Ashi MA bodies. MTF Higher or lower timeframes available making this it great for trends and scalping. There are many settings that can be non-repaint for signals at a new bar and at bar 0. Inputs Timeframe  = PERIOD_CURRENT - timeframe of Movin
FREE
Los compradores de este producto también adquieren
Gann Made Easy
Oleg Rodin
4.93 (87)
Gann Made Easy es un sistema de comercio de Forex profesional y fácil de usar que se basa en los mejores principios de comercio utilizando la teoría del Sr. W. D. Gann. El indicador proporciona señales precisas de COMPRA y VENTA, incluidos los niveles de Stop Loss y Take Profit. Puede comerciar incluso sobre la marcha utilizando notificaciones PUSH. ¡Por favor, póngase en contacto conmigo después de la compra! ¡Compartiré mis consejos comerciales con usted y excelentes indicadores de bonificació
Gold Stuff
Vasiliy Strukov
4.89 (264)
Gold Stuff: un indicador de tendencia diseñado específicamente para el oro, también se puede usar en cualquier instrumento financiero. El indicador no se vuelve a dibujar ni se retrasa. El marco de tiempo recomendado es H1. Este indicador está escrito por EA Gold Stuff Advisor, puede encontrarlo en mi perfil.  Puede obtener una copia gratuita de nuestro indicador Strong Support y Trend Scanner, por favor envíe un mensaje privado. ¡a mí! IMPORTANTE! Póngase en contacto conmigo inmediatamente d
Scalper Inside PRO
Alexey Minkov
4.75 (59)
An exclusive indicator that utilizes an innovative algorithm to swiftly and accurately determine the market trend. The indicator automatically calculates opening, closing, and profit levels, providing detailed trading statistics. With these features, you can choose the most appropriate trading instrument for the current market conditions. Additionally, you can easily integrate your own arrow indicators into Scalper Inside Pro to quickly evaluate their statistics and profitability. Scalper Inside
¡Actualmente 20% OFF ! ¡La mejor solución para cualquier novato o trader experto! Este software funciona con 28 pares de divisas. Se basa en 2 de nuestros principales indicadores (Advanced Currency Strength 28 y Advanced Currency Impulse). Proporciona una gran visión general de todo el mercado de divisas. Muestra los valores de Advanced Currency Strength, la velocidad de movimiento de las divisas y las señales para 28 pares de divisas en todos los (9) marcos temporales. Imagine cómo mejorar
TPSpro RFI Levels
Roman Podpora
4.86 (21)
Reversal First Impulse levels (RFI)    INSTRUCTIONS        RUS       -       ENG              R ecommended to use with an indicator   -   TPSpro  TREND PRO -  Version MT5 A key element in trading is zones or levels from which decisions to buy or sell a trading instrument are made. Despite attempts by major players to conceal their presence in the market, they inevitably leave traces. Our task was to learn how to identify these traces and interpret them correctly. Main functions: Displaying activ
AT Forex Indicator MT4
Marzena Maria Szmit
5 (2)
The AT Forex Indicator MT4 is a sophisticated trading tool designed to provide traders with a comprehensive analysis of multiple currency pairs. This   powerful indicator   simplifies the complex nature of the forex market, making it accessible for both novice and experienced traders. AT Forex Indicator uses   advanced algorithms   to detect trends, patterns and is an essential tool for traders aiming to enhance their forex trading performance. With its robust features, ease of use, and reliabl
TPSproTREND PrO
Roman Podpora
4.78 (18)
TPSpro TRENDPRO  - is a trend indicator that automatically analyzes the market and provides information about the trend and each of its changes, as well as giving signals for entering trades without redrawing! The indicator uses each candle, analyzing them separately. referring to different impulses - up or down impulse. Exact entry points into transactions for currencies, crypto, metals, stocks, indices!  -  Version MT5               DETAILED DESCRIPTION                R ecommended to use with
Ante todo, vale la pena enfatizar que esta Herramienta de Trading es un Indicador No Repintado, No Redibujado y No Retrasado, lo que la hace ideal para el trading profesional. Curso en línea, manual del usuario y demostración. El Indicador de Conceptos de Acción del Precio Inteligente es una herramienta muy potente tanto para traders nuevos como experimentados. Combina más de 20 indicadores útiles en uno solo, combinando ideas avanzadas de trading como el Análisis del Trader del Círculo Interio
FX Power MT4 NG
Daniel Stein
5 (11)
Obtenga su actualización diaria del mercado con detalles y capturas de pantalla a través de nuestro Morning Briefing aquí en mql5 y en Telegram ! FX Power MT4 NG es la nueva generación de nuestro popular medidor de fuerza de divisas, FX Power. ¿Y qué ofrece este medidor de fuerza de nueva generación? Todo lo que le encantaba del FX Power original PLUS Análisis de fuerza de ORO/XAU Resultados de cálculo aún más precisos Períodos de análisis configurables individualmente Límite de cálculo persona
Trend Screener
STE S.S.COMPANY
4.83 (90)
Indicador de tendencia, solución única e innovadora para el comercio y filtrado de tendencias con todas las funciones de tendencias importantes integradas en una sola herramienta. Es un indicador 100% sin repintar de marcos temporales y monedas múltiples que se puede usar en todos los símbolos/instrumentos: divisas, materias primas, criptomonedas, índices y acciones. Trend Screener es un indicador de seguimiento de tendencia eficiente que proporciona señales de tendencia de flecha con puntos en
Currency Strength Wizard es un indicador muy poderoso que le proporciona una solución todo en uno para operar con éxito. El indicador calcula el poder de este o aquel par de divisas utilizando los datos de todas las monedas en múltiples marcos de tiempo. Estos datos se representan en forma de índice de moneda fácil de usar y líneas eléctricas de moneda que puede usar para ver el poder de esta o aquella moneda. Todo lo que necesita es adjuntar el indicador al gráfico que desea operar y el indicad
M1 Arrow
Oleg Rodin
5 (14)
Una estrategia intradía basada en dos principios fundamentales del mercado. El algoritmo se basa en el análisis de volúmenes y ondas de precios utilizando filtros adicionales. El algoritmo inteligente del indicador da una señal solo cuando dos factores de mercado se combinan en uno. El indicador calcula ondas de cierto rango en el gráfico M1 utilizando los datos del marco de tiempo más alto. Y para confirmar la onda, el indicador utiliza el análisis por volumen. Este indicador es un sistema come
Indicator : RealValueIndicator Description : RealValueIndicator is a powerful tool designed specifically for trading on the EURUSD pair. This indicator analyzes all EUR and USD pairs, calculates their real currency strength values, and displays them as a single realistic value to give you a head start on price. This indicator will tell you moves before they happen if you use it right. RealValueIndicator allows you to get a quick and accurate overview of the EURUSD currency pair tops and bottoms,
Trend Punch
Mohamed Hassan
5 (16)
Manual guide:   Click here WEEK SALE PROMO:   $59 ONLY!  -- Next price is  $120 .  This indicator is unstoppable when combined with our other indicator called  Support & Resistance . After purchase, send us a message and you will get it   for  FREE as a BONUS! I like to use Trend Punch on XAUUSD on the M1 timeframe & higher ones!  Introducing Trend Punch , the revolutionary forex trend indicator that will transform the way you trade! Trend Punch is uniquely designed to provide pre
Atomic Analyst
Issam Kassas
5 (3)
En primer lugar, vale la pena enfatizar que este Indicador de Trading no repinta, no redibuja y no se retrasa, lo que lo hace ideal tanto para el trading manual como para el automatizado. Manual del usuario: configuraciones, entradas y estrategia. El Analista Atómico es un Indicador de Acción del Precio PA que utiliza la fuerza y el impulso del precio para encontrar una mejor ventaja en el mercado. Equipado con filtros avanzados que ayudan a eliminar ruidos y señales falsas, y aumentan el poten
ACTUALMENTE 26% DE DESCUENTO ¡La mejor solución para cualquier operador novato o experto! Este indicador es una herramienta única, de alta calidad y asequible porque hemos incorporado una serie de características propias y una nueva fórmula. ¡Con sólo UN gráfico puede leer la Fuerza de la Divisa para 28 pares de Divisas! Imagínese cómo mejorará su operativa porque podrá señalar el punto exacto de activación de una nueva tendencia o de una oportunidad de scalping. Manual del usuario: haga
Introduciendo       Indicador Quantum Trend Sniper   , el innovador indicador MQL5 que está transformando la forma en que identificas y negocias los cambios de tendencia. Desarrollado por un equipo de comerciantes experimentados con experiencia comercial de más de 13 años,       Indicador de francotirador de tendencia cuántica       está diseñado para impulsar su viaje comercial a nuevas alturas con su forma innovadora de identificar cambios de tendencia con una precisión extremadamente alta.
Advanced Supply Demand
Bernhard Schweigert
4.92 (313)
¡Actualmente con 33% de descuento! ¡La mejor solución para cualquier tráder principiante o experto! Este indicador es una herramienta comercial única, de alta calidad y asequible, porque incorpora una serie de características patentadas y una nueva fórmula. Con esta actualización, podrá mostrar zonas de doble marco temporal. No solo podrá mostrar un marco temporal más alto, sino también mostrar ambos, el marco temporal del gráfico MÁS el marco temporal más alto: MOSTRANDO ZONAS ANIDADAS. A todos
TrendMaestro
Stefano Frisetti
5 (3)
note: this indicator is for METATRADER4, if you want the version for METATRADER5 this is the link:  https://www.mql5.com/it/market/product/108106 TRENDMAESTRO ver 2.4 TRENDMAESTRO recognizes a new TREND in the bud, he never makes mistakes. The certainty of identifying a new TREND is priceless. DESCRIPTION TRENDMAESTRO identifies a new TREND in the bud, this indicator examines the volatility, volumes and momentum to identify the moment in which there is an explosion of one or more of these data a
JULY OFFER 80% OFF next price for unlimited version will be 17000$. This is the only time you can get this institutional and professional indicator at this price for unlimited version. Don't dare to miss this. The tool I am about to introduce to you you can't compare it with other tools due to its strategy and accuracy level in predicting the next price directional movement . This tool is designed for serious traders who have decided to make a difference through trading. Be the next person to wi
Quantum Breakout Indicator PRO
Bogdan Ion Puscasu
4.96 (26)
Introduciendo       Quantum Breakout PRO   , el innovador indicador MQL5 que está transformando la forma en que comercia con Breakout Zones. Desarrollado por un equipo de operadores experimentados con experiencia comercial de más de 13 años,   Quantum Breakout PRO   está diseñado para impulsar su viaje comercial a nuevas alturas con su innovadora y dinámica estrategia de zona de ruptura. El indicador de ruptura cuántica le dará flechas de señal en las zonas de ruptura con 5 zonas objetivo de
Enigmera
Ivan Stefanov
5 (4)
ENIGMERA: El núcleo del mercado https://www.enigmera.com Introducción Este indicador y sistema de negociación es un enfoque extraordinario de los mercados financieros. ENIGMERA utiliza los ciclos fractales para calcular con precisión los niveles de soporte y resistencia. Muestra la auténtica fase de acumulación y proporciona dirección y objetivos.  Un sistema que funciona tanto si estamos en una tendencia como en una corrección.  ¿Cómo funciona? ENIGMERA consta de tres líneas: la línea de s
El indicador de reversión de ADR le muestra de un vistazo dónde se cotiza actualmente el precio en relación con su rango diario promedio normal. Recibirá alertas instantáneas a través de una ventana emergente, correo electrónico o push cuando el precio exceda su rango promedio y los niveles por encima de su elección para que pueda saltar rápidamente a retrocesos y reversiones. El indicador dibuja líneas horizontales en el gráfico en los extremos del rango promedio diario y también extensiones p
Cycle Sniper
Elmira Memish
4.41 (37)
NEW YEAR SALE PRICE FOR LIMITED TIME!!! Please contact us after your purchase and we will send you the complimentary indicators to complete the system Cycle Sniper is not a holy grail but when you use it in a system which is explained in the videos, you will feel the difference. If you are not willing to focus on the charts designed with Cycle Sniper and other free tools we provide, we recommend not buying this indicator. We recommend watching the videos about the indiactor and system before pu
TrendDecoder Premium
Christophe Pa Trouillas
5 (6)
Identifique los rangos y los próximos movimientos probables   |  Obtenga las señales más tempranas y la fuerza de las Tendencias   |  Obtener salidas claras antes de reversión   |  Detecte los niveles de Fibo que el precio pondrá a prueba Indicador no repintado y no retardado - ideal para la trading manual y automatizada - adecuado para todos los activos y todas las unidades temporales Oferta por tiempo limitado >>   50% OFF Después de la compra, póngase en contacto con mi canal  para conocer lo
Trend Line Map Pro
STE S.S.COMPANY
4.73 (15)
El indicador Trend Line Map es un complemento para Trend Screener Indicator . Funciona como un escáner para todas las señales generadas por el evaluador de tendencias (Trend Line Signals). Es un escáner de líneas de tendencia basado en el indicador de evaluación de tendencias. Si no tiene el indicador Trend Screener Pro, Trend Line Map Pro no funcionará. Al acceder a nuestro blog MQL5, puede descargar la versión gratuita del indicador Trend Line Map. Pruébelo antes de comprar, sin las res
ACTUALMENTE 31% DE DESCUENTO Este indicador es una herramienta de transacción única, de alta calidad y asequible porque hemos incorporado una serie de características propias y una fórmula secreta. Con solo un gráfico, da Alertas para los 28 pares de divisas. ¡Imagina cómo mejorarás porque puedes identificar el punto de activación exacto de una nueva tendencia u oportunidad de crecimiento! Basado en nuevos algoritmos subyacentes , hace que sea aún más fácil identificar y confirmar operaciones po
FX Volume
Daniel Stein
4.61 (36)
Obtenga su actualización diaria del mercado con detalles y capturas de pantalla a través de nuestro Morning Briefing aquí en mql5 y en Telegram ! FX Volume es el PRIMER y ÚNICO indicador de volumen que proporciona una visión REAL del sentimiento del mercado desde el punto de vista de un bróker. Proporciona una visión impresionante de cómo los participantes institucionales del mercado, como los brokers, están posicionados en el mercado Forex, mucho más rápido que los informes COT. Ver esta info
Up Down v6
Guner Koca
4.89 (9)
up-down indicator is no repaint and works all pairs and lower than weekly time frames charts. it is suitable also 1 m charts for all pairs. and hold long way to signal. dont gives too many signals. when red histogram cross trigger line that is up signal.and price probably will down when blue histogram cross trigger line that is down signal.and price probably will go up. when the signals not seen press + button on terminal . too see weekly chart because of low data on chart ,it needs to lower p
TakePropips Donchian Trend Pro
Eric John Pajarillaga Aldana
4.61 (18)
¡TakePropips Donchian Trend Pro   (MT4) es una herramienta poderosa y efectiva que detecta automáticamente la dirección de la tendencia utilizando el Canal Donchian y le proporciona señales comerciales de entrada y salida! Este indicador multifunción incluye un escáner de tendencias, señales comerciales, panel estadístico, filtro, sesiones comerciales y panel de historial de alertas. ¡Está diseñado para proporcionarle señales comerciales y ahorrarle horas analizando los gráficos! Puede descargar
Otros productos de este autor
Wise Men Indicator demo
Bohdan Kasyanenko
3.67 (3)
The indicator displays signals according to the strategy of Bill Williams on the chart. Demo version of the indicator has the same features as the paid, except that it can work only on a demo account . Signal "First Wise Man" is formed when there is a divergent bar with angulation.  Bullish divergent bar - with lower minimum and closing price in the upper half. Bearish divergent bar - higher maximum and the closing price at the bottom half. Angulation is formed when all three lines of Alligat
FREE
The indicator displays signals according to the strategy of Bill Williams on a chart: 1. Signal "First Wise Man" is formed when there is a divergent bar with angulation. A bullish divergent bar has a lower minimum and the closing price in its upper half. A bearish divergent bar has a higher maximum and the closing price at the bottom half. Angulation is formed when all three lines of Alligator are intertwined, and the price has gone up significantly(or downwards). A valid bullish/bearish div
Indicator displays signals of the Awesome Oscillator on the chart according to the strategy of Bill Williams: Signal "Saucer" - is the only signal to buy (sell), which is formed when the Awesome Oscillator histogram is above (below) the zero line. A "Saucer" is formed when the histogram changes its direction from descending to ascending (buy signal) or from ascending to descending (sell signal). In this case all the columns AO histogram should be above the zero line (for a buy signal) or bel
El indicador muestra en las señales de gráficos de Acelerador oscilador (AC) de acuerdo con las estrategias de Bill Williams. Gráfico de barras de AC es la diferencia entre el valor de 5/34, de la conducción de la fuerza gráfica de barras y el promedio móvil simple de 5 periodos, tomada a partir de ese gráfico de barras. Interpretación de la Acelerador de oscilador (AC) se basa en las siguientes reglas - Si de CA es mayor que la línea de cero, se considera que la aceleración continuará el
Exchange Time
Bohdan Kasyanenko
Trading volume and volatility change for different currency pairs, depending on the movement of the clock hands. You will be able to trade more efficiently if you know which currency pairs are at the center of attention at one time or another. Timing plays a very big role when trading currencies. The indicator shows the trading sessions of the largest exchanges in the world. The operating time is displayed in the form of a countdown before the opening time and the closing time according to UTC (
BW Alligator
Bohdan Kasyanenko
An improved version of the classic Alligator indicator by Bill Williams. Description The Alligator technical indicator is a combination of moving averages (balance lines). Blue line (Alligator Jaw) is a 13-period smoothed moving average, shifted by 8 bars into the future; Red line (Alligator Teeth) is an 8-period smoothed moving average, shifted by 5 bars into the future; Green line (Alligator Lips) is a 5-period smoothed moving average, shifted by 3 bars into the future; Purple line (Fast Gat
Filtro:
Tim Eubanks
5762
Tim Eubanks 2018.03.17 04:09 
 

Indicator no longer works.

Maksym Mudrakov
29410
Maksym Mudrakov 2016.08.31 14:39 
 

El usuario no ha dejado ningún comentario para su valoración

Vadim Strelkov
7710
Vadim Strelkov 2014.05.29 07:55 
 

El usuario no ha dejado ningún comentario para su valoración

Respuesta al comentario
Versión 1.1 2021.12.02
Indicator is compiled with a new build of compiler.