Lineverse Trendlines
- Indicadores
- Arkady Segal
- Versión: 1.24
- Actualizado: 28 noviembre 2021
- Activaciones: 5
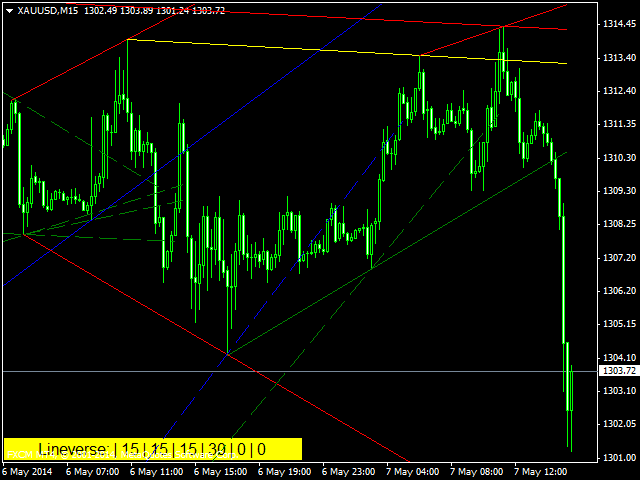
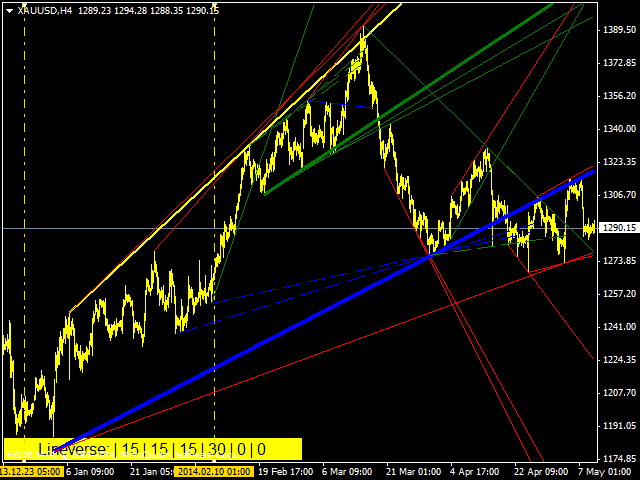
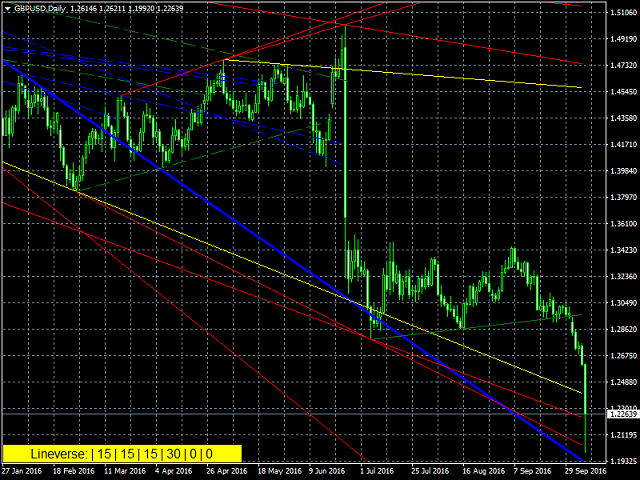
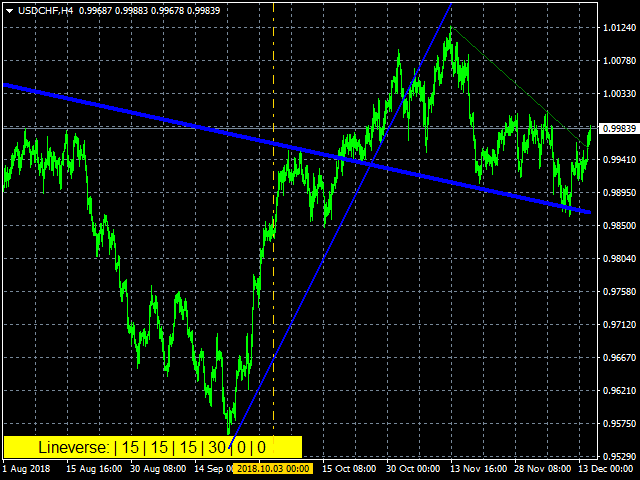
Automatic, live & interactive picture of all trendlines.
Assign push, email and sound alerts to the lines of your choice and be informed about price rollback, breakout, rollback after breakout, number of rollbacks, line expiration by double breakout.
Correct, drag or delete the lines and interactively tune the line system.
Chart examples https://www.mql5.com/en/users/efficientforex
Price Interaction Events
All events are effective immediately and only after one full bar test.
- Rollback: the price has rolled back from the line
- Breakout: the price has broken through the line
- Rollback after breakout: after a breakout, the price has retraced back to the line and then rolled back again in the original breakout direction
- Double breakout: the price has broken through the line in one direction, then, after a while, it has broken through the line in the opposite direction. This line is then considered as "expired".
The video illustrates these definitions in much greater detail.
For setting alerts, see the video, https://youtu.be/EJUo9pYiHFA?t=1m27s
Indicator Parameters
Each line is defined by two reference points (="pins") it passes through.
PIN SYSTEM
- Trendline pins based on
- HIGH&LOW: pins are situated at either High or Low of a bar
- OPEN&CLOSE: pins are situated at either Open or Close location of a bar
- Min bars to the left from a left pin - the minimum offset to the left from the left pin, before the line crosses the price graph, in bars
- Min bars to the right from a right pin - the minimum offset to the right from the right pin, before the line crosses the price graph, in bars
- Min bars between pins - the minimum distance between the left and the right pin, in bars
- Maximum number of lines - the maximum number of lines on the chart
The last 4 parameters can be adjusted using the menu in the bottom left corner (see the video).
ON LAUNCH
When the indicator is initialized, the initial trend line system is built. It is possible to adjust the initial search range for the pins with 2 parameters below:
- maximal offset for right pins, in bars - the maximum offset from the left edge of the window for the right pin, in bars
- extra offset for left pins, in bars - offset from the left edge of the chart to the left pin, in bars
2 vertical dashed control lines allow adjusting these parameters after the indicator launch: left pins can only appear to the right of the left control line, and right pins can only appear to the right of the right control line. The control lines are interactive, they can be dragged to the left/right thereby filtering and tuning the trend line system. See an example in the video https://youtu.be/wmDOj3Ouoig
FILTERS
- Refine left pins - true: if several lines share the same left pin, only the top and the bottom ones will be displayed
- Refine right pins - true: if several lines share the same right pin, only the top and bottom ones will be displayed
- Clear expired lines - true: the expired lines will be deleted
GRAPHICS
- Thickness ~number of bounces/retraces(up to 4) - true: if the price has rolled back from the line, the line thickness is increased. The thickness adjustment stops after 4 rollbacks
- New Line Color - the color of the new trend lines
- Bounce Line Color - the line color after the first price rollback
- Broken Line Color - the line color after the first price breakout
- Retrace Line Color - the color of the lines which had rollback after breakout
- Edit Box Color - the color of the corner menu
- Edit Box Level - distance between the lower boundary of the corner menu edit box and the chart bottom edge, in pixels
- Edit Box Zoom Factor - scale factor for the corner menu, e.g. 1, 2, 3.2
- Draw Right Vertical Line – true: display a vertical dashed line marking the bar of indicator launch
- Draw trendlines as rays -true: draw trendlines up to the right edge of the chart
- Sound alert file – sound alert file name
- Language: English, Russian.
- Relaunch upon history update- true: the indicator restarts every time the past quotes history is updated.
- Show only tested lines: true – the lines are shown on the chart only after at least one price interaction event happens (rollback, breakout).

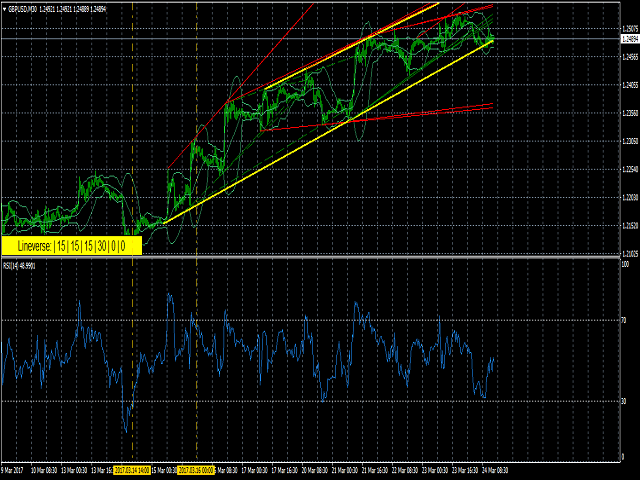

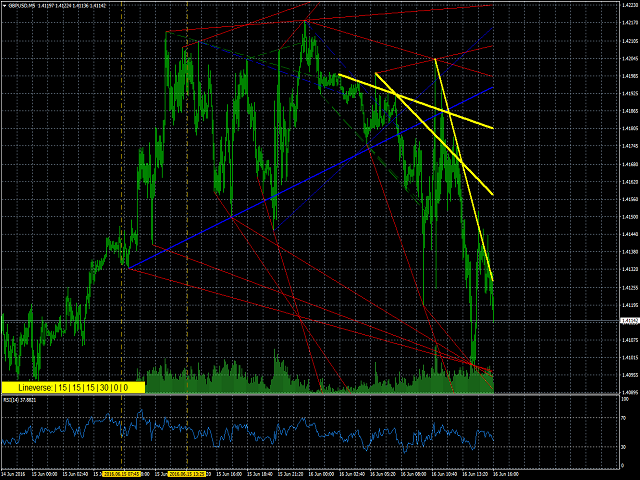
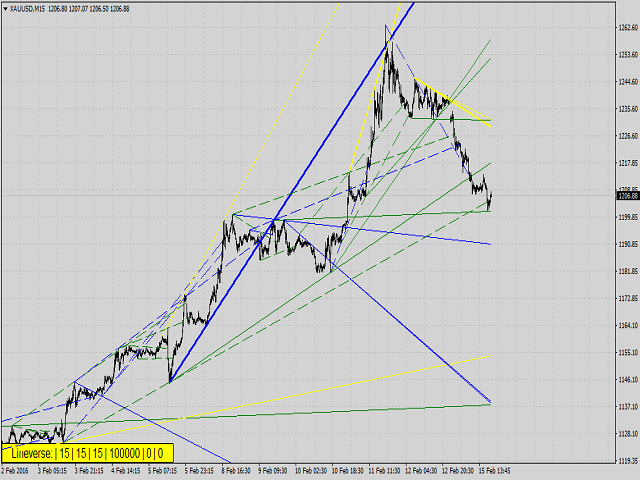
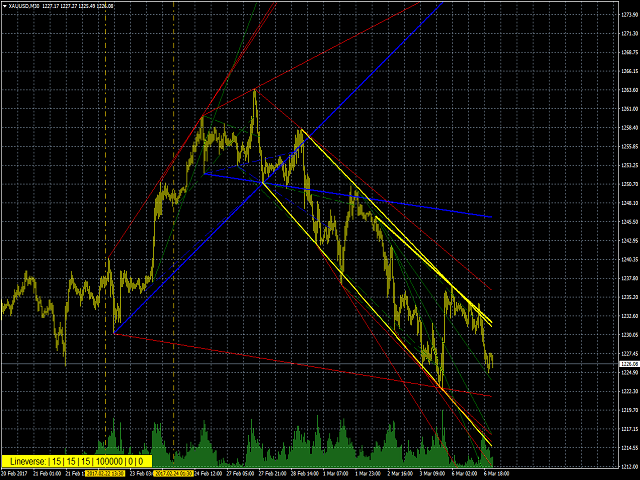







Great indicator! One of the best for trendlines on the market. I regularly use it. No need to draw trendlines yourself. It finds all of them (both after highs-lows and after open-close). Would it be possible to set to default true "clear expired lines" (they clutter the chart causing "analysis-paralysis") and also to default true "draw trendlines as rays". I always have to change it when applying. Thanks. 5 stars for this magic tool.