KT Round Numbers MT5
- Indicadores
- KEENBASE SOFTWARE SOLUTIONS
- Versión: 1.1
- Actualizado: 24 marzo 2022
- Activaciones: 5
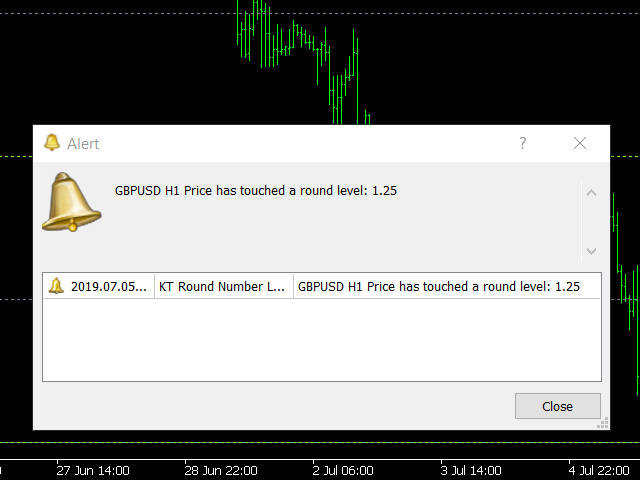
KT Round Numbers plots the round number levels which are also commonly known as psychological levels in the Forex world. In the context of
Forex trading, round number levels are those levels in which there are two or more zeroes at the end. They are named as 00 levels on the
chart.
Some traders also consider the halfway points as a valid round number level. They are named as 50 levels on the chart.
Use of round number levels in trading
- Round number levels work as strong support and resistance, which can be implemented in a trading strategy to achieve better performance.
- The round number levels work excellent for deciding the stop-loss and take-profit.
- If you use the Fibonacci for technical analysis, you will get the better result when you combine the Fibo with round numbers. Most of the time, price reacts better to the Fibonacci levels that are near to round numbers.

El usuario no ha dejado ningún comentario para su valoración