KT MA Crossover MT5
- Indicadores
- KEENBASE SOFTWARE SOLUTIONS
- Versión: 1.5
- Actualizado: 26 marzo 2022
- Activaciones: 10
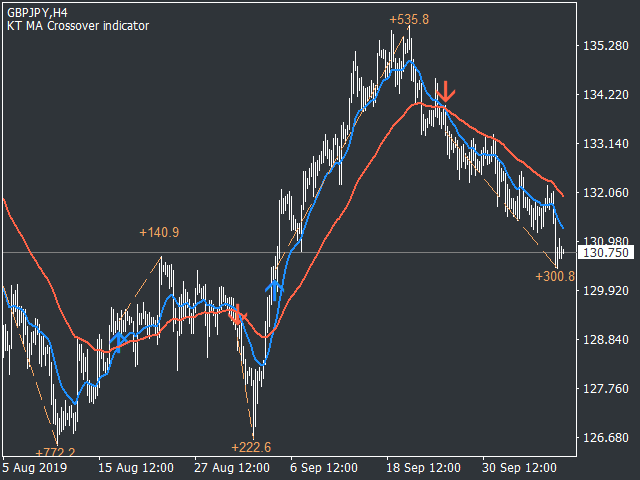
KT MA Crossover dibuja flechas de compra y venta basadas en el cruce de las medias móviles seleccionadas. Además, genera alertas correspondientes y muestra el valor MFE (Excursión Más Favorable) para cada señal consecutiva.
El cruce de medias móviles es una de las estrategias más utilizadas por los traders en todo el mundo. Generalmente, se compone de una media móvil rápida y una lenta para identificar señales de compra y venta según la dirección del cruce.
- Señal de compra - cuando la media móvil rápida cruza por encima de la lenta.
- Señal de venta - cuando la media móvil rápida cruza por debajo de la lenta.
Características
- Cada propiedad de la media móvil es totalmente configurable.
- Proporciona el valor MFE para cada señal generada.
- Indicador ligero que consume muy pocos recursos.
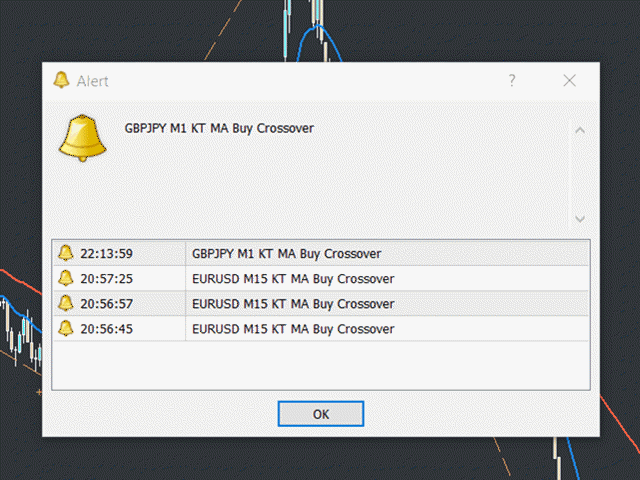
- Incluye todas las alertas de MetaTrader.
Desventajas
Las medias móviles son indicadores rezagados, ya que se basan en datos históricos. Los cruces pueden generar señales aleatorias y falsas durante periodos de consolidación. Se recomienda usar criterio del trader para interpretar correctamente estos cruces.
Parámetros de Entrada
- Barras de historial: Número de barras utilizadas para el cálculo de señales.
- ----- Seleccione el período y método para calcular la media móvil rápida y lenta -----
- Mostrar medias móviles: Mostrar u ocultar las medias móviles en el gráfico (las señales de cruce no se ven afectadas).
- Dibujar línea de beneficio: Mostrar u ocultar la línea MFE.
- Configuración de alertas: autoexplicativa