• Información general
  • Comentarios
  • Discusión

Classic Fractal Trend Lines

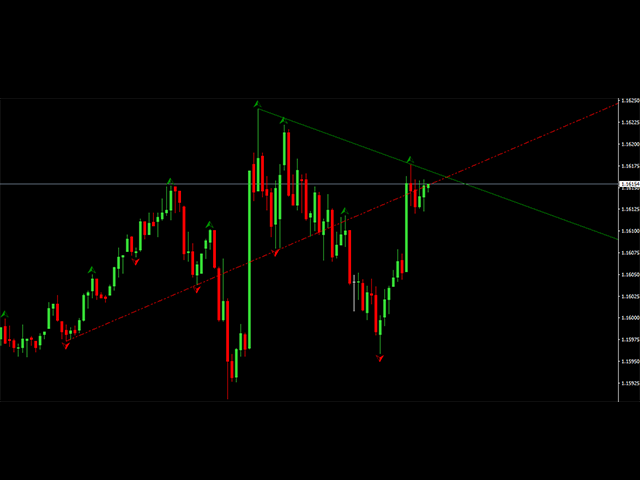
Классический фрактал отличается от остальных тем, что в бычьем фрактале экстремумы предыдущих баров последовательно растут, а экстремумы следующих баров последовательно снижаются. В медвежьем фрактале экстремумы предыдущих баров последовательно снижаются, а экстремумы следующих баров последовательно растут.

На основании этих фракталов строятся трендовые линии, где сплошная линия является новой трендовой линией, а пунктирная, "пробитой" трендовой линией.


Параметры:

История - Количество баров в истории, начиная от текущего,  на которых искать фракталы и строить по ним линии тренда.

С учётом цвета (false/true) - Если true, то на графике будут отображаться классические фракталы не только с учётом последовательности экстремумов, но и с учётом цвета баров, например в бычьем фрактале ( если параметр " Баров до и после: 2") будет три бычьих бара и два медвежьих, а в медвежьем, три медвежьих бара и два бычьих.

Рисовать все линии (false/true) - Если false, то линией тренда соединятся только последние два фрактала в истории, которые соответствуют заданным параметрам, если true, то линией тренда соединятся все фракталы в истории, согласно заданным параметрам.

Баров до и после - Регулирует количество баров во фрактале. Если 2, то фрактал будет состоять из 5 баров, где 2 бара до самого высокого (низкого) экстремума, и 2 бара после, а на самом высоком или низком экстремуме Вы получите значок фрактала.

Мин. длина экстремума - Регулирует высоту шпили, по которым строятся линии тренда (на которых мы видим значок фрактала) Шпиль на медвежьей свече, это расстояние от close до low, а на бычьей свече от close до high.

Мин. дистанция между фракталами - Регулирует количество баров между самыми высокими/низкими экстремумами (на которых значок фрактала), и если количество баров будет меньше заданного, то такие фракталы не соединятся линией тренда.

Мин. расстояние между экстремумами - Регулирует количество пунктов между самым высоким/низким экстремумом однотипных фракталов. Этот параметр позволяет регулировать наклон линии тренда. Если этот параметр равен нулю, то линия может быть горизонтальной, и образовать уровень.

Удалить если превышено кол-во пунктов - Если цена уйдет на заданное количество пунктов от линии тренда, так и не коснувшись её, то такая линия автоматически удалится.

Удалить если превышено кол-во баров - Если линия тренда так и не будет пробита, за заданное количество новых баров, появившихся после ее построения, то такая линия тоже будет удалена.


Остальные три параметра очевидны, и в описании не нуждаются.

Productos recomendados
The Th3Eng PipFinite indicator is based on a very excellent analysis of the right trend direction with perfect custom algorithms. It show the true direction and the best point to start trading. With StopLoss point and Three Take Profit points. Also it show the right pivot of the price and small points to order to replace the dynamic support and resistance channel, Which surrounds the price. And Finally it draws a very helpful Box on the left side on the chart includes (take profits and Stop loss
Owl smart levels
Sergey Ermolov
4.13 (23)
Versión MT5  |   FAQ El   Indicador Owl Smart Levels   es un sistema comercial completo dentro de un indicador que incluye herramientas de análisis de mercado tan populares como   los fractales avanzados de Bill Williams , Valable ZigZag que construye   la estructura de onda correcta   del mercado y   los niveles de Fibonacci   que marcan los niveles exactos de entrada. en el mercado y lugares para tomar ganancias. Descripción detallada de la estrategia Instrucciones para trabajar con el indi
VR Cub
Vladimir Pastushak
VR Cub es un indicador para obtener puntos de entrada de alta calidad. El indicador fue desarrollado para facilitar los cálculos matemáticos y simplificar la búsqueda de puntos de entrada a una posición. La estrategia comercial para la cual se diseñó el indicador ha demostrado su eficacia durante muchos años. La simplicidad de la estrategia comercial es su gran ventaja, que permite que incluso los operadores novatos negocien con éxito con ella. VR Cub calcula los puntos de apertura de posiciones
Retroceso de Fibonacci & Herramientas de Dibujo de Líneas Extendidas Retroceso de Fibonacci & Herramientas de Dibujo de Líneas Extendidas son aptos para la plataforma MT4 y para operadores que emplean el método de negociación de puntos y la negociación de sección áurea. Ventajas: Sin líneas excusadas ni las excesivamente largas, y es fácil de observar y descubrir oportunidades de negociación. Versión de prueba: https://www.mql5.com/zh/market/product/35884 Funciones principales: 1.
This is a trend indicator without redrawing Developed instead of the binary options strategy (by the color of the Martingale candlestick) Also works well in forex trading When to open trades (binary options) A signal will appear in the place with a candle signaling the current candle It is recommended to open a deal for one candle of the current timeframe M1 and M5 When a blue dot appears, open a deal up When a red dot appears, open a trade down. How to open trades on Forex. When a signal is rec
Noize Absorption Index MT4
Ekaterina Saltykova
5 (1)
Noize Absorption Index - is the manual trading system that measures the difference of pressure between bears forces and bulls forces. Green line - is a noize free index that showing curent situation. Zero value of index shows totally choppy/flat market.Values above zero level shows how powerfull bullish wave is and values below zero measures bearish forces.Up arrow appears on bearish market when it's ready to reverse, dn arrow appears on weak bullish market, as a result of reverse expectation. S
Mirror
Stanislav Korotky
This indicator predicts rate changes based on the chart display principle. It uses the idea that the price fluctuations consist of "action" and "reaction" phases, and the "reaction" is comparable and similar to the "action", so mirroring can be used to predict it. The indicator has three parameters: predict - the number of bars for prediction (24 by default); depth - the number of past bars that will be used as mirror points; for all depth mirroring points an MA is calculated and drawn on the ch
The Penta-O is a 6-point retracement harmonacci pattern which usually precedes big market movements. Penta-O patterns can expand and repaint quite a bit. To make things easier this indicator implements a twist: it waits for a donchian breakout in the right direction before signaling the trade. The end result is an otherwise repainting indicator with a very reliable trading signal. The donchian breakout period is entered as an input. [ Installation Guide | Update Guide | Troubleshooting | FAQ | A
This is an intraday indicator that uses conventional formulae for daily and weekly levels of pivot, resistance and support, but updates them dynamically bar by bar. It answers the question how pivot levels would behave if every bar were considered as the last bar of a day. At every point in time, it takes N latest bars into consideration, where N is either the number of bars in a day (round the clock, i.e. in 24h) or the number of bars in a week - for daily and weekly levels correspondingly. So,
Cosmic Diviner X Planet
Olena Kondratenko
4 (2)
This unique multi-currency strategy simultaneously determines the strength of trends and market entry points, visualizing this using histograms on the chart. The indicator is optimally adapted for trading on the timeframes М5, М15, М30, Н1. For the convenience of users, the indicator renders the entry point (in the form of an arrow), recommended take profit levels (TP1, TP2 with text labels) and the recommended Stop Loss level. The take profit levels (TP1, TP2) are automatically calculated for
FiboRec
Alfred Kamal
This indicator depends on Fibonacci lines but there is a secret lines i used them, by using FiboRec indicator you will be able to know a lot of important information in the market such as: Features You can avoid entry during market turbulence. You can enter orders in general trend only. You will know if the trend is strong or weak. Signal Types and Frame used You can use this indicator just on H1 frame. Enter buy order in case Candle break out the square area and closed over it, at least 20
Le presentamos el indicador "Candle closing counter", que se convertirá en su asistente indispensable en el mundo del trading. Es por eso que saber cuándo se cerrará la vela puede ayudar: Si usted tiene gusto de negociar usando patrones de la vela, usted sabrá cuando la vela será cerrada. Este indicador le permitirá comprobar si se ha formado un patrón conocido y si hay una posibilidad de negociación. El indicador le ayudará a prepararse para la apertura del mercado y el cierre del mercado.
Bermaui Bands
Muhammad Elbermawi
4.96 (52)
Bermaui Bands (BB) es una herramienta de análisis técnico que ayuda a filtrar entre los movimientos de precios de rango y tendencia. La idea detrás de este indicador se puede explicar en los siguientes pasos: Calcule la desviación estándar como un oscilador que se mueve entre 0 y 100. Lo llamaré porcentaje de desviación de Bermaui (BD%). Si "BD%" está cerca de cero, la volatilidad está en su punto máximo. Además, si "BD%" está cerca de 100, la volatilidad es muy baja. Una alta volatilidad signif
Trend Ray
Andriy Sydoruk
The indicator shows the potential trend direction by cyclical-wave dependence. Thus, all the rays of the intersection will be optimal rays, in the direction of which the price is expected to move, taking into account the indicator period. Rays can be used as a direction for potential market movement. But we must not forget that the approach must be comprehensive, the indicator signals require additional information to enter the market.
Indicador. "Indicador de onda o Indicador Ma". Utilizando 23 indicadores estándar y el algoritmo del autor, se calculan los niveles de compras (de 0 a +100) y ventas (de 0 a -100). Luego, utilizando los niveles calculados, el "Indicador de onda" dibuja una onda con 21 promedios móviles. El número de onda es igual al período promedio de los niveles calculados. Ondas n. 1 - 7 promedios móviles rápidos Ondas de los promedios móviles promedio No. 8-14 Olas de los promedios móviles lentos N
"The Squeeze indicator attempts to identify periods of consolidation in a market. In general the market is either in a period of quiet consolidation or vertical price discovery. By identifying these calm periods, we have a better opportunity of getting into trades with the potential for larger moves. Once a market enters into a "squeeze," we watch the overall market momentum to help forecast the market direction and await a release of market energy." The StdATR Squeeze Channel combines standard
Master Scalping M1 es un indicador innovador que utiliza un algoritmo para determinar la tendencia de forma rápida y precisa. El indicador calcula el tiempo de apertura y cierre de posiciones, los algoritmos del indicador le permiten encontrar los momentos ideales para ingresar a una operación (comprar o vender un activo), lo que aumenta el éxito de las transacciones para la mayoría de los comerciantes. Beneficios del indicador: Fácil de usar, no sobrecarga el gráfico con información innecesari
Automatic fibonacci with alerts is an indicator that automatically plots a fibonacci retracement based on the number of bars you select on the BarsToScan setting in the indicator. The fibonacci is automatically updated in real time as new highest and lowest values appear amongst the selected bars. You can select which level values to be displayed in the indicator settings. You can also select the color of the levels thus enabling the trader to be able to attach the indicator several times with d
Heiken Ashi candle chart is an improved version of The Japanese candle chart, which can effectively filter the market "noise" of the Japanese candle chart. It is favored by many traders for its simplicity and intuition. For trend traders, the HA candle chart is a magic tool. Unlike the traditional Japanese candle chart, Heikenashi does not reflect the opening price, high price, low price and closing price of the market. Instead, Heikenashi calculates the value of a single K line in the dominant
Los indicadores [ZhiBiCCI] son ​​adecuados para todos los ciclos de uso y también son adecuados para todas las variedades de mercado. [ZhiBiCCI] La línea verde sólida es una reversión de la divergencia alcista. La línea de puntos verde es una divergencia alcista clásica. [ZhiBiCCI] La línea continua hacia el rojo es una divergencia bajista inversa. La línea roja punteada es una divergencia bajista clásica. [ZhiBiCCI] puede configurarse en los parámetros (Alerta, Enviar correo, Enviar notif
Support and Resistance is a very important reference for trading.  This indicator provides customized support and resistance levels, automatic draw line and play music functions.  In addition to the custom RS, the default RS includes Pivot Point, Fibonacci, integer Price, MA, Bollinger Bands. Pivot Point is a resistance and support system. It has been widely used at froex,stocks, futures, treasury bonds and indexes. It is an effective support resistance analysis system. Fibonacci also known as t
Title : Market Bias Indicator - Oscillator-Based Trading Tool Introduction : Discover the potential of the "Market Bias Indicator," a revolutionary oscillator-based trading tool designed for precise market analysis. If you're in search of a robust alternative to traditional bias indicators, your quest ends here. Market Bias Indicator offers unparalleled accuracy in identifying market sentiment and is your gateway to confident trading decisions. Recommended Trading Pairs : Market Bias Indicator i
Atomic Analyst
Issam Kassas
5 (2)
En primer lugar, vale la pena enfatizar que este Indicador de Trading no repinta, no redibuja y no se retrasa, lo que lo hace ideal tanto para el trading manual como para el automatizado. Manual del usuario: configuraciones, entradas y estrategia. El Analista Atómico es un Indicador de Acción del Precio PA que utiliza la fuerza y el impulso del precio para encontrar una mejor ventaja en el mercado. Equipado con filtros avanzados que ayudan a eliminar ruidos y señales falsas, y aumentan el poten
Laser Trend
Nicolas Zouein
The trend is your friend! This is what this indicator is all about. Follow this famous saying and be safe. Characteristics: Buy/Sell signals fixed on the close of a bar. Works on all symbols and all timeframes. Clear visual market trend laser line, Buy/Sell signal arrows, market strength meter, TP1 & TP2 boxes. Visual signals when to enter, when to exit the market. No repainting. Compatible with Flexible EA for trading automation. (Ask for a free set file optimized to perform 2010-2018) Para
Trendiness Index
Libertas LLC
5 (3)
"The trend is your friend" is one of the best known sayings in investing, because capturing large trendy price movements can be extremely profitable. However, trading with the trend is often easier said than done, because many indicators are based on price reversals not trends. These aren't very effective at identifying trendy periods, or predicting whether trends will continue. We developed the Trendiness Index to help address this problem by indicating the strength and direction of price trend
Real Magic Trend
Muhammed Emin Ugur
This   Real Magic Trend   indicator is designed for signal trading. This indicator generates trend signals. It uses many algorithms and indicators to generate this signal. It tries to generate signals from the points with the highest trend potential. This indicator is a complete trading product. This indicator does not need any additional indicators. The indicator is never repainted. The point at which the signal is given does not change.      Features and Recommendations Time Frame
This indicator monitors the market for a flat state and possible breakout. The flat state is detected as a predefined number of consecutive bars during which price fluctuates inside a small range. If one of the next bars closes outside the range, breakout is signaled. The indicator shows 3 lines: blue - upper bound of flat ranges AND consecutive breakout areas; red - lower bound of flat ranges AND consecutive breakout areas; yellow - center of flat ranges (NOT including breakout areas). When a b
Trend Scanner
Vladimir Kalendzhyan
4.33 (6)
By purchasing this indicator, you have the right to receive a free copy of one of   my other indicator's or advisor’s!  (All future updates are included. No limits) . To get it , please contact me by  mql5 message ! The Trend Scanner trend line indicator displays the trend direction and its changes. The indicator works on all currency pairs and  timeframes. The indicator simultaneously displays multiple readings on the price chart: the support and resistance lines of the currency pair, the exist
The indicator displays the data of the Stochastic oscillator from a higher timeframe on the chart. The main and signal lines are displayed in a separate window. The stepped response is not smoothed. The indicator is useful for practicing "manual" forex trading strategies, which use the data from several screens with different timeframes of a single symbol. The indicator uses the settings that are identical to the standard ones, and a drop-down list for selecting the timeframe. Indicator Parame
PZ Trend Trading
PZ TRADING SLU
4.8 (5)
Trend Trading es un indicador diseñado para sacar el máximo provecho posible de las tendencias que tienen lugar en el mercado, mediante el cronometraje de retrocesos y rupturas. Encuentra oportunidades comerciales al analizar qué está haciendo el precio durante las tendencias establecidas. [ Guía de instalación | Guía de actualización | Solución de problemas | FAQ | Todos los productos ] Opere en los mercados financieros con confianza y eficiencia Aproveche las tendencias establecidas sin s
Los compradores de este producto también adquieren
Gann Made Easy
Oleg Rodin
4.84 (57)
Gann Made Easy es un sistema de comercio de Forex profesional y fácil de usar que se basa en los mejores principios de comercio utilizando la teoría del Sr. W. D. Gann. El indicador proporciona señales precisas de COMPRA y VENTA, incluidos los niveles de Stop Loss y Take Profit. Puede comerciar incluso sobre la marcha utilizando notificaciones PUSH. ¡Por favor, póngase en contacto conmigo después de la compra! ¡Compartiré mis consejos comerciales con usted y excelentes indicadores de bonificació
Trend Punch
Mohamed Hassan
5 (11)
This indicator is unstoppable when combined with our other indicator called  Support & Resistance . After purchase, send us a message and you will get it   for  FREE as a BONUS! Introducing Trend Punch , the revolutionary forex trend indicator that will transform the way you trade! Trend Punch is uniquely designed to provide precise buy and sell arrows during strong market trends, making your trading decisions clearer and more confident. Whether you're trading major currency pairs or exotic sym
Gold Stuff
Vasiliy Strukov
4.89 (201)
Gold Stuff: un indicador de tendencia diseñado específicamente para el oro, también se puede usar en cualquier instrumento financiero. El indicador no se vuelve a dibujar ni se retrasa. El marco de tiempo recomendado es H1. Este indicador está escrito por EA Gold Stuff Advisor, puede encontrarlo en mi perfil.  Puede obtener una copia gratuita de nuestro indicador Strong Support y Trend Scanner, por favor envíe un mensaje privado. ¡a mí! IMPORTANTE! Póngase en contacto conmigo inmediatamente d
Trend Pulse
Mohamed Hassan
5 (3)
Please contact me after purchase to immediately get your PDF strategy + documentation for Trend Pulse !  Official release price of $89  (1 /50 copies left). Next price is $199 . Introducing Trend Pulse , a unique and robust indicator capable of detecting bullish, bearish, and even ranging trends! Trend Pulse uses a special algorithm to filter out market noise with real precision. If the current symbol is moving sideways, Trend Pulse will send you a ranging signal, letting you know that it'
¡LEA LA INFORMACIÓN A CONTINUACIÓN ANTES DE COMPRAR EL PRODUCTO! ¡Apollo Pips PLUS SP es un producto único! ¡ES PARA AQUELLOS QUE QUIEREN OBTENER MI NUEVO INDICADOR "APOLLO PIPS" MÁS BONO "SUPER PACK" CON ACCESO A TODOS MIS INDICADORES COMERCIALES! Al comprar el producto Apollo Pips PLUS SP, en realidad está comprando una versión absolutamente nueva de mi indicador Apollo Pips. Esta versión del indicador tiene un algoritmo mejorado y un parámetro fácil de usar que le brinda la oportunidad de uti
FX Power MT4 NG
Daniel Stein
5 (12)
Obtenga su actualización diaria del mercado con detalles y capturas de pantalla a través de nuestro Morning Briefing aquí en mql5 y en Telegram ! FX Power MT4 NG es la nueva generación de nuestro popular medidor de fuerza de divisas, FX Power. ¿Y qué ofrece este medidor de fuerza de nueva generación? Todo lo que le encantaba del FX Power original PLUS Análisis de fuerza de ORO/XAU Resultados de cálculo aún más precisos Períodos de análisis configurables individualmente Límite de cálculo persona
Scalper Inside PRO
Alexey Minkov
4.69 (49)
An exclusive indicator that utilizes an innovative algorithm to swiftly and accurately determine the market trend. The indicator automatically calculates opening, closing, and profit levels, providing detailed trading statistics. With these features, you can choose the most appropriate trading instrument for the current market conditions. Additionally, you can easily integrate your own arrow indicators into Scalper Inside Pro to quickly evaluate their statistics and profitability. Scalper Inside
TPSproTREND PrO
Roman Podpora
4.78 (18)
TPSpro TREND PRO   es un indicador de tendencia que analiza automáticamente el mercado y proporciona información sobre la tendencia y cada uno de sus cambios, además de dar señales para ingresar operaciones sin volver a dibujar. El indicador utiliza cada vela, analizándolas por separado. refiriéndose a diferentes impulsos: impulso hacia arriba o hacia abajo. ¡Puntos de entrada exactos a transacciones de divisas, criptomonedas, metales, acciones e índices! Versión MT5                   DESCRIPCI
Currency Strength Wizard es un indicador muy poderoso que le proporciona una solución todo en uno para operar con éxito. El indicador calcula el poder de este o aquel par de divisas utilizando los datos de todas las monedas en múltiples marcos de tiempo. Estos datos se representan en forma de índice de moneda fácil de usar y líneas eléctricas de moneda que puede usar para ver el poder de esta o aquella moneda. Todo lo que necesita es adjuntar el indicador al gráfico que desea operar y el indicad
- Real price is 80$ - 40% Discount ( It is 49$ now ) Contact me for instruction, any questions! Introduction The breakout and retest strategy is traded support and resistance levels. it involves price breaking through a previous level.  The break and retest strategy is designed to help traders do two main things, the first is to avoid false breakouts. Many false breakouts start with a candlestick that breaks out of a level but ends with an immediate candlestick that brings the price back into t
RelicusRoad Pro
Relicus LLC
4.54 (80)
Ahora $ 147 (aumentando a $ 499 después de algunas actualizaciones) - Cuentas ilimitadas (PC o Mac) Manual de usuario de RelicusRoad + Videos de capacitación + Acceso al grupo privado de Discord + Estado VIP UNA NUEVA MANERA DE VER EL MERCADO RelicusRoad es el indicador comercial más poderoso del mundo para divisas, futuros, criptomonedas, acciones e índices, y brinda a los comerciantes toda la información y las herramientas que necesitan para mantenerse rentables. Brindamos análisis téc
Ante todo, vale la pena enfatizar que esta Herramienta de Trading es un Indicador No Repintado, No Redibujado y No Retrasado, lo que la hace ideal para el trading profesional. Curso en línea, manual del usuario y demostración. El Indicador de Conceptos de Acción del Precio Inteligente es una herramienta muy potente tanto para traders nuevos como experimentados. Combina más de 20 indicadores útiles en uno solo, combinando ideas avanzadas de trading como el Análisis del Trader del Círculo Interio
Clear Breakout
Martin Alejandro Bamonte
El indicador "Breakout Buy-Sell" está diseñado para identificar y resaltar posibles oportunidades de compra y venta basadas en rupturas de precios durante diferentes sesiones del mercado (Tokio, Londres y Nueva York). Este indicador ayuda a los traders a visualizar claramente las zonas de compra y venta , así como los niveles de toma de ganancias (TP) y stop loss (SL). Estrategia de Uso El indicador se puede utilizar de la siguiente manera: Configuración Inicial : Selecciona la sesión del merc
ACTUALMENTE 31% DE DESCUENTO Este indicador es una herramienta de transacción única, de alta calidad y asequible porque hemos incorporado una serie de características propias y una fórmula secreta. Con solo un gráfico, da Alertas para los 28 pares de divisas. ¡Imagina cómo mejorarás porque puedes identificar el punto de activación exacto de una nueva tendencia u oportunidad de crecimiento! Basado en nuevos algoritmos subyacentes , hace que sea aún más fácil identificar y confirmar operaciones po
Trend Screener
STE S.S.COMPANY
4.79 (81)
Indicador de tendencia, solución única e innovadora para el comercio y filtrado de tendencias con todas las funciones de tendencias importantes integradas en una sola herramienta. Es un indicador 100% sin repintar de marcos temporales y monedas múltiples que se puede usar en todos los símbolos/instrumentos: divisas, materias primas, criptomonedas, índices y acciones. Trend Screener es un indicador de seguimiento de tendencia eficiente que proporciona señales de tendencia de flecha con puntos en
¡Actualmente 20% OFF ! ¡La mejor solución para cualquier novato o trader experto! Este software funciona con 28 pares de divisas. Se basa en 2 de nuestros principales indicadores (Advanced Currency Strength 28 y Advanced Currency Impulse). Proporciona una gran visión general de todo el mercado de divisas. Muestra los valores de Advanced Currency Strength, la velocidad de movimiento de las divisas y las señales para 28 pares de divisas en todos los (9) marcos temporales. Imagine cómo mejorar
ACTUALMENTE 26% DE DESCUENTO ¡La mejor solución para cualquier operador novato o experto! Este indicador es una herramienta única, de alta calidad y asequible porque hemos incorporado una serie de características propias y una nueva fórmula. ¡Con sólo UN gráfico puede leer la Fuerza de la Divisa para 28 pares de Divisas! Imagínese cómo mejorará su operativa porque podrá señalar el punto exacto de activación de una nueva tendencia o de una oportunidad de scalping. Manual del usuario: haga
El sistema PRO Renko es un sistema de trading de alta precisión especialmente diseñado para operar gráficos RENKO. Se trata de un sistema universal que se puede aplicar a diversos instrumentos de negociación. El sistema neutraliza eficazmente el llamado ruido de mercado, lo que le brinda acceso a señales de reversión precisas. El indicador es muy fácil de usar y solo tiene un parámetro responsable de la generación de señales. Puede adaptar fácilmente la herramienta a cualquier instrumento com
Gold Channel is a volatility-based indicator, developed with a specific timing algorithm for the XAUUSD pair, which consists of finding possible corrections in the market. This indicator shows two outer lines, an inner line (retracement line) and an arrow sign, where the theory of the channel is to help identify overbought and oversold conditions in the market. The market price will generally fall between the boundaries of the channel. If prices touch or move outside the channel it is a tra
Backtest and Read Overview before purchase. Chart patterns have been a topic of debate among traders; some believe they are reliable signalers, while others do not. Our Chart Patterns All-in-One indicator displays various chart patterns to help you test these theories for yourself. The profitability of these patterns is not a reflection of the indicator's effectiveness but rather an evaluation of the patterns themselves. The Chart Patterns All-in-One indicator is an excellent tool for visualizin
TPSpro RFI Levels
Roman Podpora
4.8 (20)
反转第一脉冲水平 (RFI)     指示     俄羅斯     -        ESP   Recomendamos utilizar con   el indicador -   TPSpro 趋势专业版 -   MT5版本 Un elemento clave importante en el comercio son las zonas o niveles a partir de los cuales se toman decisiones para comprar o vender un instrumento comercial. A pesar de los intentos de los grandes actores de ocultar su presencia en el mercado, inevitablemente dejan rastros. Nuestra tarea era aprender a encontrar estos rastros e interpretarlos correctamente. Funciones principales:
NAM Order Blocks
NAM TECH GROUP, CORP.
5 (1)
Indicador de detección de Order Blocks multitimeframe para MT4. Características - Panel de control totalmente personalizable, proporciona una interacción completa. - Oculta y muestra el panel de control donde quieras. - Detecta OB en múltiples marcos de tiempo. - Permite seleccionar la cantidad de OB para mostrar. - Interfaz de usuario de diferentes OBs. - Diferentes filtros de OBs (regulares, rejection y sin capitalizar). - Alerta de proximidad de OBs. - Líneas ADR High y Low. - Servicio de not
Order Block Hunter
Noha Mohamed Fathy Younes Badr
5 (1)
Order block hunter indicator is the best indicator for  hunt the order blocks that area where there has been a large concentration of limit orders waiting to be executed Order blocks are identified on a chart by observing previous price action and looking for areas where the price experienced significant movement or sudden changes in direction .This indicator does that for you by using very complicated codes and helps you to take the best areas To buy and sell because it make marks at the best a
Scalper Vault
Oleg Rodin
5 (22)
Scalper Vault es un sistema profesional de reventa que le brinda todo lo que necesita para una reventa exitosa. Este indicador es un sistema comercial completo que puede ser utilizado por operadores de divisas y opciones binarias. El marco de tiempo recomendado es M5. El sistema le proporciona señales de flecha precisas en la dirección de la tendencia. También le proporciona señales superiores e inferiores y niveles de mercado de Gann. Los indicadores proporcionan todo tipo de alertas, incluidas
Conviértase en un Breaker Trader y obtenga beneficios de los cambios en la estructura del mercado a medida que se invierte el precio. El indicador de ruptura de bloque de órdenes identifica cuándo una tendencia o movimiento de precio se acerca al agotamiento y está listo para revertirse. Le alerta sobre cambios en la estructura del mercado que generalmente ocurren cuando una reversión o un retroceso importante están a punto de suceder. El indicador utiliza un cálculo patentado que identific
M1 Arrow
Oleg Rodin
4.67 (12)
Una estrategia intradía basada en dos principios fundamentales del mercado. El algoritmo se basa en el análisis de volúmenes y ondas de precios utilizando filtros adicionales. El algoritmo inteligente del indicador da una señal solo cuando dos factores de mercado se combinan en uno. El indicador calcula ondas de cierto rango en el gráfico M1 utilizando los datos del marco de tiempo más alto. Y para confirmar la onda, el indicador utiliza el análisis por volumen. Este indicador es un sistema come
Advanced Supply Demand
Bernhard Schweigert
4.9 (271)
¡Actualmente con 33% de descuento! ¡La mejor solución para cualquier tráder principiante o experto! Este indicador es una herramienta comercial única, de alta calidad y asequible, porque incorpora una serie de características patentadas y una nueva fórmula. Con esta actualización, podrá mostrar zonas de doble marco temporal. No solo podrá mostrar un marco temporal más alto, sino también mostrar ambos, el marco temporal del gráfico MÁS el marco temporal más alto: MOSTRANDO ZONAS ANIDADAS. A todos
IX Power MT4
Daniel Stein
5 (5)
IX Power lleva por fin la insuperable precisión de FX Power a los símbolos que no son de Forex. Determina con exactitud la intensidad de las tendencias a corto, medio y largo plazo de tus índices, acciones, materias primas, ETF e incluso criptodivisas favoritas. Puede analizar todo lo que su terminal le ofrece. Pruébalo y experimenta cómo tu timing mejora significativamente a la hora de operar. Características principales de IX Power Resultados de cálculo 100% precisos y sin repintado -
Break and Retest
Mohamed Hassan
3.83 (12)
This Indicator only places quality trades when the market is really in your favor with a clear break and retest. Patience is key with this price action strategy! If you want more alert signals per day, you increase the number next to the parameter called: Support & Resistance Sensitivity.  After many months of hard work and dedication, we are extremely proud to present you our  Break and Retest price action indicator created from scratch. One of the most complex indicators that we made with ove
ICT, SMC, SMART MONEY CONCEPTS, SMART MONEY, Smart Money Concept, Support and Resistance, Trend Analysis, Price Action, Market Structure, Order Blocks, BOS/CHoCH,   Breaker Blocks ,  Momentum Shift,   Supply&Demand Zone/Order Blocks , Strong Imbalance, HH/LL/HL/LH,    Fair Value Gap, FVG,  Premium  &   Discount   Zones, Fibonacci Retracement, OTE, Buy Side Liquidity, Sell Side Liquidity, BSL/SSL Taken, Equal Highs & Lows, MTF Dashboard, Multiple Time Frame, BigBar, HTF OB, HTF Market Structure, 
Otros productos de este autor
Данная утилита (эксперт который сам не открывает ордера) ищет на графике паттерны Price Action : DBLHC и DBHLC Рельсы CPR Пин-бар HR PPR TBH и TBL OB где каждый паттерн имеет гибкие настройки того, как он должен выглядеть по Вашему мнению. К примеру, возьмём пин-бар, который имеет так называемый нос а также левый и правый глаз. Так вот в настройках Вы можете указать минимальную длину этого самого носа, максимальный размер самого тела и хвоста, и минимальный размер левого глаза, по от
Deposit saver
Vitaly Tarnovsky
If your deposit is in a drawdown - this EA will help you get out of it! DEPOSIT SAVER will lock your position in order to prevent the drawdown from increasing significantly, and then will close all orders to breakeven. Please note that it is not the EA task to bring you profit. The EA task is to withdraw you from the drawdown and close all positions to zero. 1. Before installing the EA on the chart, delete the stop loss of your orders, if any; 2. The EA works only with sell or buy orders. If t
Filtro:
No hay comentarios
Respuesta al comentario