RSI Alerts New Version MTF
- Indicadores
- Eadvisors Software Inc.
- Versión: 110.219
- Activaciones: 5
The Relative Strength Index (RSI), developed by J. Welles Wilder, is a momentum oscillator that measures the speed and change of price movements. The RSI oscillates between zero and 100.
We have added to the reputable RSI indicator several types of alerts and a signal interval filter to be incorporated in your Expert Advisors.
It works in ALL Timeframes ans instruments.
Product Features
- Email Alert
- Sound alert
- Push Notification (Alerts can be sent to your mobile phone)
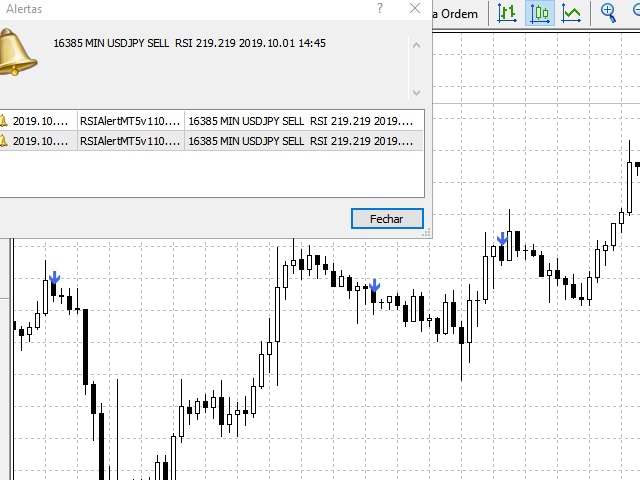
- Signs on chart
- Alert box
- Interval between signals (Bars)
- Multitimeframe signals
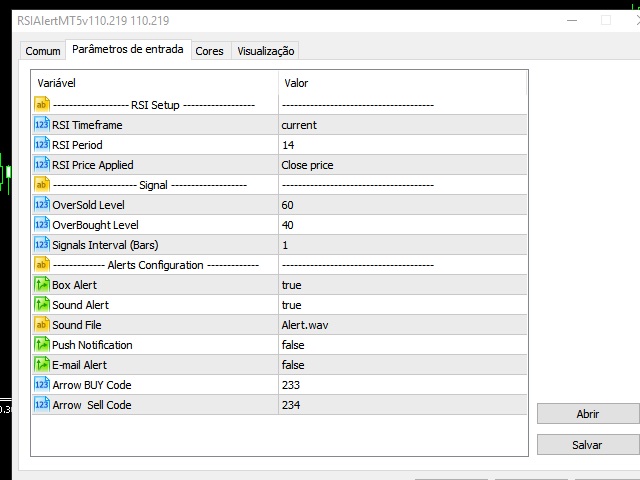
Indicator Parameters
- Push Notification - This option enables your MetaTrader 4 to send alerts to your smartphone (IOS or Android).
- Email Alert - Configure your alerts to receive in your e-mail address.
- SignOnChart - Enable drawing alerts on your chart.
- Sound Alert - Enable sound alert on cross or level mode.
- Alert Box - Enable simple alert box on events.
- UpLevelAlert / DwLevelAlert - Configure the range Max and Min of indicator level to alert you.
- LevelAlert - Enable alert on crossing the levels configured above.
- SoundFile - File that you like to play on sound alert mode.
- RSI Price - Price Type used in the indicator.