SpreadToCsv
- Indicadores
- Matteo Valenti
- Versión: 1.1
- Actualizado: 12 agosto 2019
- Activaciones: 5
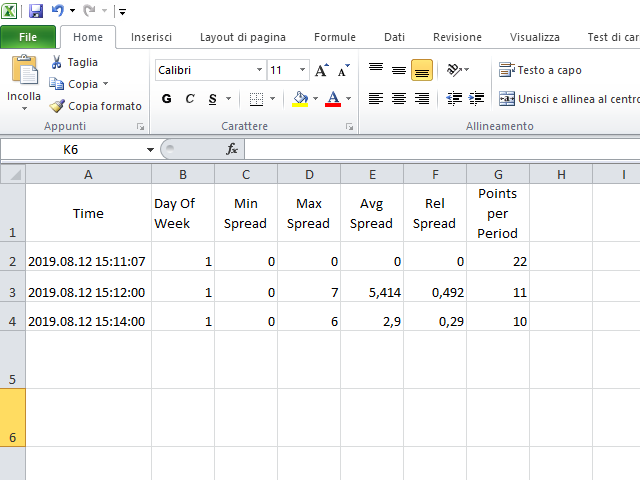
This indicator calculate the minimum,maximum,average and relative (to points of the bar) spread in the chart applied period.
The indicator must be applied to one or more different period on a Pair and analyze the spread for all the Pairs available by the Broker.
The csv output for one minute chart is something like this https://gofile.io/?c=K5JtN9
This video will show how to apply the indicator