• Información general
  • Comentarios
  • Discusión (1)
  • Novedades

Morning Evening Star

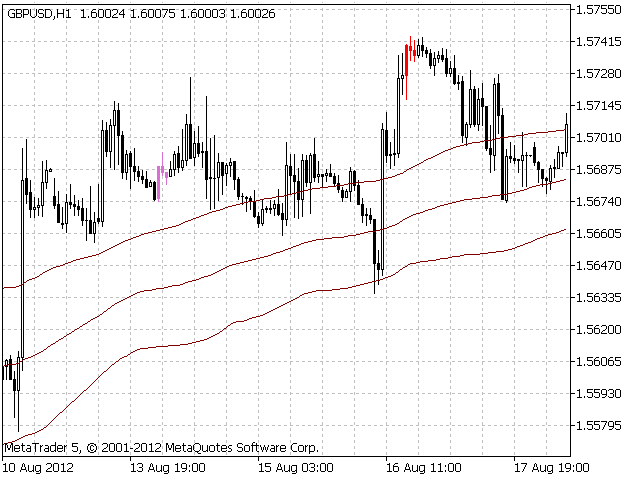
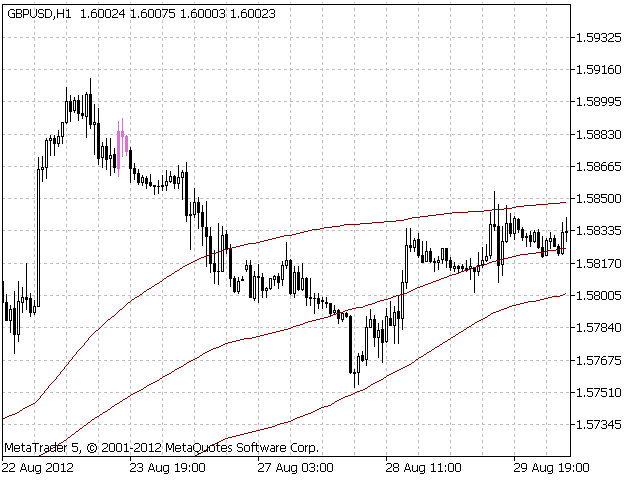
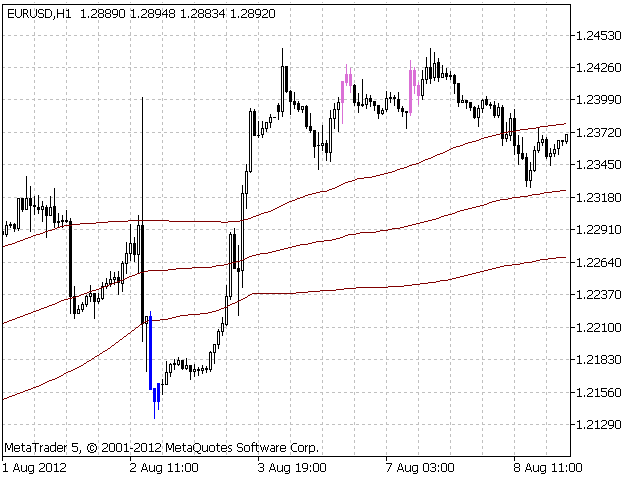
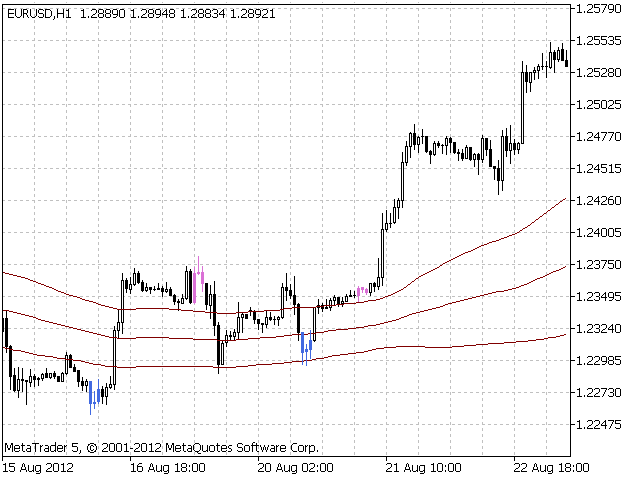
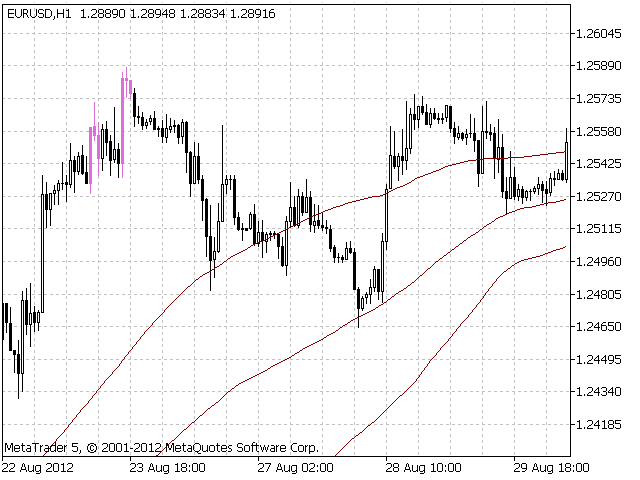
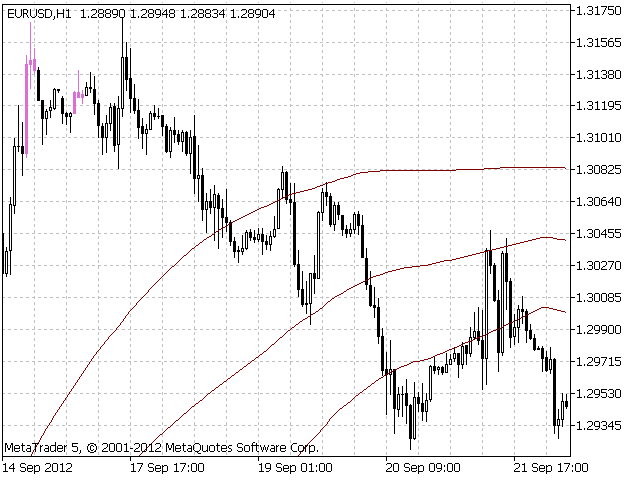
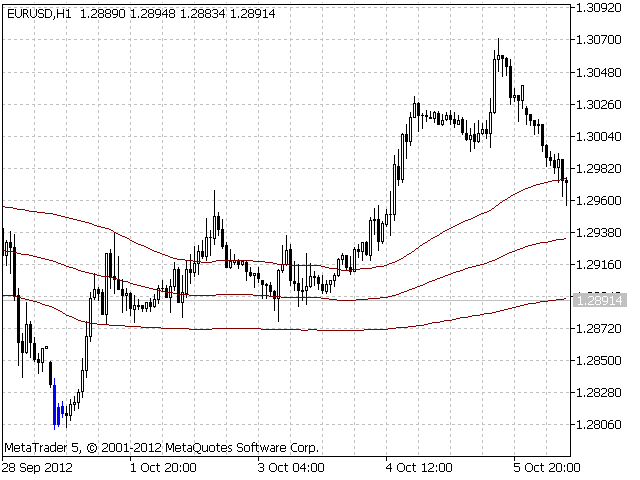
The indicator displays the "Morning star" and "Evening star" patterns on a chart.

The Evening star is displayed in red or rose. The Morning star is displayed in blue or light blue.


Input Parameters:

  • Max Bars – number of bars calculated on the chart.
  • Make Signal Alert – use alerts.
  • Send Push Notification - send notification to a mobile terminal
  • Type of rules pattern – type of the model of pattern determination (Hard – with the control of length of shadows of the second bar). If Soft is selected then patterns that do not meet the maximum shadow length condition will be displayed in light colors (rose or light blue).
  • Smart Filter Enabled – filter that considers the probability of reverse.
  • Sensitivity Smart Filter – sensitivity of the "Smart Filter" (0 ÷ 1). 1 – maximum sensitivity. 0 – minimum sensitivity (there will be less signals).
  • Ratio of body length (first bar) – coefficient of the minimal length of body of the first bar.
  • Ratio of body length (second bar) – coefficient of the maximal length of body of the second bar.
  • Ratio of length of shadows (second bar) – coefficient of the maximal length of shadows of the second bar.
  • Ratio of body length (third bar) – coefficient of the minimal length of body of the third bar.
  • Short-Term Trend Filter – settings of the short-term trend filter.
  • MA Filter Enabled – use the short-term trend filter based on MA.
  • MA Method – method of averaging of MA.
  • MA Period – period of MA.
  • MA Price Type – type of price used.
  • Set Bollinger Bands Filter – setting of the filter based on the Bollinger Bands indicator.
  • Enabled Filter – use the filter based on the Bollinger Bands indicator.
  • Entry BBands period – period of Bollinger Bands.
  • Entry BBands deviation – deviation of Bollinger Bands.
  • Range Check – number of bars to be checked.


Recommendations on usage:

Enter the market by pending orders placed:

  • on the Low level of the third bar minus several points for the Evening star.
  • on the High level of the third bar plus several points for the Morning star.

SL is placed on the local extremum level plus several points.

A signal formed on Friday 3-4 hours before the end of a trade session should be better skipped.

If there is an open position when a signal appears, it is recommended not to reverse, but continue trailing the open position.

Productos recomendados
This is a multi-symbol and multi-timeframe table-based indicator designed for a candlestick patterns detection with 46 patterns for META TRADER 5. Each formation has own image for easier recognition. Here you find most popular formations such as "Engulfing", "Hammer", "Three Line Strike", "Piercing" or Doji - like candles. Check my full list of patterns on my screenshots below. Also you can not only switch all bearish or bullish patterns from input, but also select formation for a specified symb
PZ Trend Trading MT5
PZ TRADING SLU
3.67 (3)
Trend Trading es un indicador diseñado para sacar el máximo provecho posible de las tendencias que tienen lugar en el mercado, mediante el cronometraje de retrocesos y rupturas. Encuentra oportunidades comerciales al analizar qué está haciendo el precio durante las tendencias establecidas. [ Guía de instalación | Guía de actualización | Solución de problemas | FAQ | Todos los productos ] Opere en los mercados financieros con confianza y eficiencia Aproveche las tendencias establecidas sin s
AW Candle Patterns
AW Trading Software Limited
El indicador de patrones de velas AW es una combinación de un indicador de tendencia avanzado combinado con un potente escáner de patrones de velas. Es una herramienta útil para reconocer y resaltar los treinta patrones de velas más fiables. Además, es un analizador de tendencias actual basado en barras de colores con un       panel de tendencias de múltiples marcos de tiempo que se puede cambiar de tamaño y posicionar. Una capacidad única para ajustar la visualización de patrones según el filtr
A machine translation from the English product description was used. We apologize for possible imprecisions. Se utilizó una traducción automática de la descripción del producto en inglés. Pedimos disculpas por posibles imprecisiones. Un sistema de visualización de patrones de acción de precios de velas japonesas favoritas. Una vez adjunto, el indicador marcará automáticamente los siguientes patrones en el gráfico: Barra de Pinocho (pinbar)  - una barra de cuerpo pequeño con una 'nariz' larga, un
The indicator identifies two most important patterns of technical analysis - Pin Bar and Engulfing. MT4-version:    https://www.mql5.com/en/market/product/53591 Settings: Mincandle size for PinBar   - The minimum size of the Pin-Bar candlestick; Percentage of candle body on size   - The percentage of the candle body in relation to its length; PinBar Alert   - Alert when a Pin-Bar is detected; PinBar Mail   - Sends an email when a Pin Bar is found; PinBar Notification   - Sends a push notificati
Your Pointer is no ordinary Forex channel. This corridor is built on the basis of the analysis of several candles, starting from the last one, as a result of which the extremes of the studied interval are determined. They are the ones who create the channel lines. Like all channels, it has a middle line as well as a high and low line. This channel is worth watching for its unusual behavior. The use of the Your Pointer indicator allows the trader to react in time to the price going beyond the bo
Breakthrough signal indicator for the MT5 platform: Your reliable assistant in the world of trading! We are pleased to present you with an innovative signal indicator, which was created in collaboration with an outstanding mathematician. This indicator combines advanced algorithms and the best of the world of mathematical analysis, providing traders with a unique tool for predicting market movements. Why is this indicator unique? 1 .Entry signals without redrawing If a signal appears, it
The diamond top and bottom are reversal patterns. It represents a rally to a new high with a drop to a support level followed by a rally to make a new high and a quick decline, breaking the support level to make a higher low. The bounce from the higher low is then followed by a rally, but making a lower high instead. Once this behavior is identified, prices then break the trend line connecting the first and second lows and start to decline further. You can find MT4 version hier Indicator show
Trading patterns on Forex is considered to be the highest level of trading, since it usually requires years of mastering various patterns (shapes and candle combinations) and the ways they affect the price. Patterns are different combinations of Japanese candles on a chart, shapes of classical technical analysis, as well as any regularities of the market behavior repeating many times under the same conditions. After the patterns appear on a chart, the price starts behaving in a certain way allow
Indicador para determinar plano y tendencia. Si el precio está por debajo de cualquiera de los dos histogramas y dos líneas (rojo y azul), esta es una zona de venta. Al comprar esta versión del indicador, la versión MT4 para una cuenta real y una demo, ¡como regalo (para recibir, escríbame un mensaje privado)! Si el precio está por encima de cualquiera de los dos histogramas y dos líneas (rojo y azul), esta es una zona de compra. Versión MT4: https://www.mql5.com/en/market/product/3793 Si
Gioteen Volatility Index (GVI) - your ultimate solution to overcoming market unpredictability and maximizing trading opportunities. This revolutionary indicator helps you in lowering your losing trades due to choppy market movements. The GVI is designed to measure market volatility, providing you with valuable insights to identify the most favorable trading prospects. Its intuitive interface consists of a dynamic red line representing the volatility index, accompanied by blue line that indicate
PipFinite Exit EDGE MT5
Karlo Wilson Vendiola
4.89 (37)
Did You Have A Profitable Trade But Suddenly Reversed? In a solid strategy, exiting a trade is equally important as entering. Exit EDGE helps maximize your current trade profit and avoid turning winning trades to losers. Never Miss An Exit Signal Again Monitor all pairs and timeframes in just 1 chart www.mql5.com/en/blogs/post/726558 How To Trade You can close your open trades as soon as you receive a signal Close your Buy orders if you receive an Exit Buy Signal. Close your Sell orde
MetaCOT 2 is a set of indicators and specialized utilities for the analysis of the U.S. Commodity Futures Trading Commission reports. Thanks to the reports issued by the Commission, it is possible to analyze the size and direction of the positions of the major market participants, which brings the long-term price prediction accuracy to a new higher-quality level, inaccessible to most traders. These indicators, related to the fundamental analysis, can also be used as an effective long-term filter
Owl Smart Levels MT5
Sergey Ermolov
4.31 (39)
Versión MT4  |  FAQ El Indicador Owl Smart Levels es un sistema comercial completo dentro de un indicador que incluye herramientas de análisis de mercado tan populares como los fractales avanzados de Bill Williams , Valable ZigZag que construye la estructura de onda correcta del mercado y los niveles de Fibonacci que marcan los niveles exactos de entrada. en el mercado y lugares para tomar ganancias. Descripción detallada de la estrategia Instrucciones para trabajar con el indicador Asesor de c
Все паттерны из книги Томас Н. Булковский "Полная энциклопедия графических ценовых моделей" в одном индикаторе со сканером. Cканер включается параметром ScannerMode. При ScannerMode=false индикатор ищет один паттерн (выбирается переменной Pattern). При выявлении паттерна индикатор рисует стрелку, открывает окно сообщений, выполняет push-уведомление. У индикатора много параметров, некоторые их них задействованы всегда, некоторые выборочно. Включите переменную ShowHelp - на графике отобразится по
Candle hunter
Ruslan Khasanov
5 (1)
Indicador para análisis gráfico. Marca los principales patrones de velas japonesas en el gráfico. Por el momento, el siguiente conjunto de patrones está disponible para el comerciante:  - Bearish/Bullish Abandoned Baby;  - Bearish Advance Block;  - Bearish Deliberation;  - Bearish/Bullish Belt Hold;  - Bearish/Bullish Engulfing;  - Bearish Shooting Star;  - Bearish Evening Star;  - Bearish Evening Doji Star;  - Bearish/Bullish Doji Star;    - Bearish/Bullish Tri-Star;  - Bearish Hanging Man;  -
El patrón de copa y asa es una formación técnica de precios que se asemeja a una copa y un asa, donde la copa tiene la forma de una "U" y el asa tiene una ligera deriva hacia abajo. El lado derecho del patrón -el mango- es más pequeño que el lado izquierdo -cup-, y no retrocede más del 50% desde la parte superior. Puede ser tanto una continuación como un patrón de inversión. [ Guía de instalación | Guía de actualización | Solución de problemas | FAQ | Todos los productos ] Señales comerciales cl
Supply Demand Ranger
Krzysztof Janusz Stankiewic
5 (2)
The indicator draws supply and demand zones. The zone timeframe can be set independently of the chart timeframe. For instance, it is possible to set M5 zones on an H4 chart. The importance of zones can be adjusted using the zone strength parameter. Demand zones are displayed if at least one candle in the range of the zone is entirely above the zone. Similarly, supply zones are displayed if at least one candle within the zone is entirely below the zone.
Was: $249  Now: $99   Market Profile defines a number of day types that can help the trader to determine market behaviour. A key feature is the Value Area, representing the range of price action where 70% of trading took place. Understanding the Value Area can give traders valuable insight into market direction and establish the higher odds trade. It is an excellent addition to any system you may be using. Inspired by Jim Dalton’s book “Mind Over Markets”, this indicator is designed to suit the
Good Time
Sergey Sapozhnikov
5 (1)
Indicator for Highlighting Any Time Periods such as Trade Sessions or Week Days We do we need it? Looking through the operation results of my favorite Expert Advisor in the strategy tester I noticed that most deals it opened during the Asian session were unprofitable. It would be a great idea to see it on a graph, I thought. And that was the time I bumped into the first problem - viewing only the Asian session on a chart. And hiding all the others. It is not a problem to find the work schedule o
Fractal 358 Plus
Renato Fridschtein
Fractal 358 Plus is a predictive indicator that provides the clearest sight of price movements. Identifying graphic patterns such as Caixote (Crate), Pivot and Inside Candle , it shows entries and exits spots, as well as threats to your trades in the markets. It comes ready to use with B3 Mini Index (WIN$ series) and can be adjusted to use with any asset and timeframe. Fractal 358 unravels price movement Based on the Fibonacci sequence, Fractal 358 is a new and different way of reading and un
Identify Pinbar Candle Pattern with Arrows & Alert (built-in RSI filter). This indicator helps you to identify Pin bar Candlestick Pattern (or shooting star & hammer pattern) on the chart with arrows, along with an alert when a new Pin bar appears. Pin bar pattern is one of the most important reversal Price Action signals. You can set Minimum Percent of Wick (or Tail) Length over full bar length (Recommended: 60%, 70%, 75%). Alerts can be turned on and off: Popup Email Push Notification S
The True Oversold Overbought indicator provides you with ability to swiftly check whether the asset is oversold or overbought.  Other than complementing your trading with True Oversold Overbought, you can use the indicator as your only trading system. It works with all forex instruments and will save you the headache of estimating when the market is due for a reversal or retracement.  When the "Super Charge" feature is enabled, the areas where the price is in oversold/overbought status are ampli
The Supernova Momentums indicator simplifies the visual perception of the price chart and reduces the time for analysis: if there is no signal, the deal is not opened, and if an opposite signal appears, it is recommended to close the current position. This arrow indicator is designed to determine the trend. Supernova Momentums implements a trend trading strategy, filters out market noise, and includes all the necessary features in one tool. Its work is based on automatically determining the c
Renko Gold
Ignacio Agustin Mene Franco
Renko Gold !  indica clara mente los pisos y techos donde va de 4 lineas ,  la linea de abajo que marca el piso en color verde confirmando con la linea mas fina aclara la entrada en compra ,  lo mismo es para la venta , la linea de arriba marca el techo y la mas fina de color  rojo marca la venta ,  este indicador sirve para todas las temporalidades !  Para los mercados de Forex y Indices sinteticos ! Tambien sirve para los mercados de crypto !  Buen Profit! World Inversor. 
Big Candle Detect
Guilherme Guimaraes Dias
The indicator, Big Candle Detect , is based on ATR and Volume to detect candlesticks of buying and selling strength, which is represented through an oscillator indicator. With this indicator you will be able to identify the lateral market, providing better entries according to your strategy. Big Candle Detect highlights candles with brighter colors when the condition is found, making it easier to identify, in addition to being fully compatible for automation in your EA. SETTINGS ATR P
Atomic Analyst MT5
Issam Kassas
4.6 (20)
En primer lugar, vale la pena enfatizar que este Indicador de Trading no repinta, no redibuja y no se retrasa, lo que lo hace ideal tanto para el trading manual como para el automatizado. Manual del usuario: configuraciones, entradas y estrategia. El Analista Atómico es un Indicador de Acción del Precio PA que utiliza la fuerza y el impulso del precio para encontrar una mejor ventaja en el mercado. Equipado con filtros avanzados que ayudan a eliminar ruidos y señales falsas, y aumentan el poten
Double HMA MTF for MT5
Pavel Zamoshnikov
3.67 (3)
This is an advanced multi-timeframe version of the popular Hull Moving Average (HMA) Features Two lines of the Hull indicator of different timeframes on the same chart. The HMA line of the higher timeframe defines the trend, and the HMA line of the current timeframe defines the short-term price movements. A graphical panel with HMA indicator data from all timeframes at the same time . If the HMA switched its direction on any timeframe, the panel displays a question or exclamation mark with a tex
El patrón 123 es uno de los patrones de gráficos más populares, potentes y flexibles. El patrón se compone de tres puntos de precio: un fondo, un pico o valle, y un retroceso de Fibonacci entre 38.2% y 71.8%. Un patrón se considera válido cuando el precio se rompe más allá del último pico o valle, momento en el que el indicador traza una flecha, levanta una alerta y se puede colocar el comercio. [ Guía de instalación | Guía de actualización | Solución de problemas | FAQ | Todos los productos ]
¡El nivel Premium es un indicador único con más del 80% de precisión de predicciones correctas! ¡Este indicador ha sido probado por los mejores especialistas en comercio durante más de dos meses! ¡El indicador del autor no lo encontrarás en ningún otro lugar! ¡A partir de las capturas de pantalla, puede ver por sí mismo la precisión de esta herramienta! 1 es ideal para operar con opciones binarias con un tiempo de vencimiento de 1 vela. 2 funciona en todos los pares de divisas, accion
Los compradores de este producto también adquieren
Primero que todo, vale la pena enfatizar que este Sistema de Trading es un Indicador No Repintado, No Redibujado y No Retrasado, lo que lo hace ideal tanto para el trading manual como para el automatizado. Curso en línea, manual y descarga de ajustes preestablecidos. El "Sistema de Trading Inteligente MT5" es una solución completa de trading diseñada para traders nuevos y experimentados. Combina más de 10 indicadores premium y presenta más de 7 estrategias de trading robustas, lo que lo convie
TPSpro RFI Levels MT5
Roman Podpora
4.67 (9)
反转第一脉冲水平 (RFI)     指示     俄羅斯     -        ESP   Recomendamos utilizar con   el indicador -   TPSpro 趋势专业版 -   MT5版本 Un elemento clave importante en el comercio son las zonas o niveles a partir de los cuales se toman decisiones para comprar o vender un instrumento comercial. A pesar de los intentos de los grandes actores de ocultar su presencia en el mercado, inevitablemente dejan rastros. Nuestra tarea era aprender a encontrar estos rastros e interpretarlos correctamente. Funciones principales:
TPSproTREND PrO MT5
Roman Podpora
4.89 (9)
TPSpro TREND PRO  - is a trend indicator that automatically analyzes the market and provides information about the trend and each of its changes, as well as giving signals for entering trades without redrawing! The indicator uses each candle, analyzing them separately. referring to different impulses - up or down impulse. Exact entry points into transactions for currencies, crypto, metals, stocks, indices!  Version MT4               DETAILED DESCRIPTION               R ecommended to use with an
Gold Stuff mt5
Vasiliy Strukov
4.9 (185)
Gold Stuff mt5: un indicador de tendencia diseñado específicamente para el oro, también se puede usar en cualquier instrumento financiero. El indicador no se vuelve a dibujar ni se retrasa. El marco de tiempo recomendado es H1. IMPORTANTE! Póngase en contacto conmigo inmediatamente después de la compra para obtener instrucciones y bonificación!   Puede obtener una copia gratuita de nuestro indicador Strong Support y Trend Scanner, por favor envíe un mensaje privado. ¡a mí! PARÁMETROS Draw
Quantum Trend Sniper
Bogdan Ion Puscasu
4.92 (48)
Introduciendo       Indicador Quantum Trend Sniper   , el innovador indicador MQL5 que está transformando la forma en que identificas y negocias los cambios de tendencia. Desarrollado por un equipo de comerciantes experimentados con experiencia comercial de más de 13 años,       Indicador de francotirador de tendencia cuántica       está diseñado para impulsar su viaje comercial a nuevas alturas con su forma innovadora de identificar cambios de tendencia con una precisión extremadamente alta.
Este es un genial indicador para MT5 que ofrece señales precisas para entrar en una transacción sin redibujar. Se puede aplicar a cualquier activo financiero: fórex, criptomonedas, metales, acciones, índices. Nos dará valoraciones bastante precisas y nos dirá cuándo es mejor abrir y cerra una transacción. Eche un vistazo  al vídeo  (6:22), ¡contiene un ejemplo de procesamiento de una sola señal que ha amortizado el indicador! La mayoría de los tráders mejoran sus resultados comerciales durante l
Ante todo, vale la pena enfatizar que esta Herramienta de Trading es un Indicador No Repintado, No Redibujado y No Retrasado, lo que la hace ideal para el trading profesional. Curso en línea, manual del usuario y demostración. El Indicador de Conceptos de Acción del Precio Inteligente es una herramienta muy potente tanto para traders nuevos como experimentados. Combina más de 20 indicadores útiles en uno solo, combinando ideas avanzadas de trading como el Análisis del Trader del Círculo Inte
Trend Screener Pro MT5
STE S.S.COMPANY
4.88 (67)
Desbloquee el poder del comercio de tendencias con el indicador Trend Screener: ¡su solución definitiva para el comercio de tendencias impulsada por lógica difusa y un sistema multidivisa!Mejore su comercio de tendencias con Trend Screener, el revolucionario indicador de tendencias impulsado por lógica difusa. Es un poderoso indicador de seguimiento de tendencias que combina más de 13 herramientas y funciones premium y 3 estrategias comerciales, lo que lo convierte en una opción versátil para co
FX Power MT5 NG
Daniel Stein
5 (6)
Obtenga su actualización diaria del mercado con detalles y capturas de pantalla a través de nuestro Morning Briefing aquí en mql5 y en Telegram ! FX Power MT5 NG es la nueva generación de nuestro popular medidor de fuerza de divisas, FX Power. ¿Y qué ofrece este medidor de fuerza de nueva generación? Todo lo que le encantaba del FX Power original PLUS Análisis de fuerza de ORO/XAU Resultados de cálculo aún más precisos Períodos de análisis configurables individualmente Límite de cálculo persona
FX Volume MT5
Daniel Stein
4.94 (17)
Obtenga su actualización diaria del mercado con detalles y capturas de pantalla a través de nuestro Morning Briefing aquí en mql5 y en Telegram ! FX Volume es el PRIMER y ÚNICO indicador de volumen que proporciona una visión REAL del sentimiento del mercado desde el punto de vista de un bróker. Proporciona una visión impresionante de cómo los participantes institucionales del mercado, como los brokers, están posicionados en el mercado Forex, mucho más rápido que los informes COT. Ver esta info
Easy By Sell is a market indicator for opening and closing positions. It becomes easy to track market entries with alerts. It indicates trend reversal points when a price reaches extreme values ​​and the most favorable time to enter the market. it is as effective as a Fibonacci to find a level but it uses different tools such as an algorithm based on ATR indicators and Stochastic Oscillator. You can modify these two parameters as you wish to adapt the settings to the desired period. My othe
IX Power MT5
Daniel Stein
4.17 (6)
IX Power   lleva por fin la insuperable precisión de FX Power a los símbolos que no son de Forex. Determina con exactitud la intensidad de las tendencias a corto, medio y largo plazo de tus índices, acciones, materias primas, ETF e incluso criptodivisas favoritas. Puede   analizar todo lo   que su terminal le ofrece. Pruébalo y experimenta cómo   tu timing mejora significativamente   a la hora de operar. Características principales de IX Power Resultados de cálculo 100% precisos y sin rep
TrendMaestro5
Stefano Frisetti
note: this indicator is for METATRADER4, if you want the version for METATRADER5 this is the link:  https://www.mql5.com/it/market/product/108106 TRENDMAESTRO ver 2.4 TRENDMAESTRO recognizes a new TREND in the bud, he never makes mistakes. The certainty of identifying a new TREND is priceless. DESCRIPTION TRENDMAESTRO identifies a new TREND in the bud, this indicator examines the volatility, volumes and momentum to identify the moment in which there is an explosion of one or more of these data a
Ahora $ 147 (aumentando a $ 499 después de algunas actualizaciones) - Cuentas ilimitadas (PC o Mac) Manual de usuario de RelicusRoad + Videos de capacitación + Acceso al grupo privado de Discord + Estado VIP UNA NUEVA MANERA DE VER EL MERCADO RelicusRoad es el indicador comercial más poderoso del mundo para divisas, futuros, criptomonedas, acciones e índices, y brinda a los comerciantes toda la información y las herramientas que necesitan para mantenerse rentables. Brindamos análisis téc
XQ Indicator MetaTrader 5
Marzena Maria Szmit
3.5 (2)
Step into the realm of Forex trading with confidence and precision using XQ, a cutting-edge Forex indicator designed to elevate your trading game to unprecedented heights. Whether you're a seasoned trader or just stepping into the world of currency exchange, XQ Forex Indicator empowers you with the insights and signals needed to make informed trading decisions. The signal conditions are a combination of three indicators, and XQ Forex Indicator only display  medium and long-term trends . The ind
Este tablero muestra los últimos   patrones armónicos   disponibles para los símbolos seleccionados, por lo que ahorrará tiempo y será más eficiente /   versión MT4 . Indicador gratuito:   Basic Harmonic Pattern Columnas del indicador Symbol:   aparecerán los símbolos seleccionados Trend :   alcista o bajista Pattern :   tipo de patrón (gartley, mariposa, murciélago, cangrejo, tiburón, cifrado o ABCD) Entry :   precio de entrada SL:   precio de stop loss TP1:   1er precio de toma de benefici
Golden Spikes Premium
Kwaku Bondzie Ghartey
Golden Spikes Detector Acknowledgement and Dedications:  The name of this indicator was Inspired by an Original; Mr Grant Koopman; a Knowledgeable and experienced Synthetics trader. I dedicate this indicator to Mr Grant.  Overview: The Golden Spikes Premium is a groundbreaking trading indicator meticulously crafted for the Boom and Crash indices on the Deriv market. Tailored to meet the needs of discerning traders, this powerful tool operates exclusively on the one-minute timeframe, providin
Gartley Hunter Multi
Siarhei Vashchylka
5 (8)
Gartley Hunter Multi - An indicator for searching for harmonic patterns simultaneously on dozens of trading instruments and on all possible timeframes. Manual (Be sure to read before purchasing) | Version for MT4 Advantages 1. Patterns: Gartley, Butterfly, Shark, Crab. Bat, Alternate Bat, Deep Crab, Cypher 2. Simultaneous search for patterns on dozens of trading instruments and on all possible timeframes 3. Search for patterns of all possible sizes. From the smallest to the largest 4. A
ICT, SMC, SMART MONEY CONCEPTS, SMART MONEY, Smart Money Concept, Support and Resistance, Trend Analysis, Price Action, Market Structure, Order Blocks, BOS/CHoCH,   Breaker Blocks ,  Momentum Shift,   Supply&Demand Zone/Order Blocks , Strong Imbalance,   HH/LL/HL/LH,    Fair Value Gap, FVG,  Premium  &   Discount   Zones, Fibonacci Retracement, OTE, Buy Side Liquidity, Sell Side Liquidity, BSL/SSL Taken, Equal Highs & Lows, MTF Dashboard, Multiple Time Frame, BigBar, HTF OB, HTF Market Structure
¿Cansado de trazar líneas de soporte y resistencia? La resistencia de soporte es un indicador de marco de tiempo múltiple que detecta y traza automáticamente los soportes y las líneas de resistencia en el gráfico con un giro muy interesante: a medida que los niveles de precios se prueban con el tiempo y aumenta su importancia, las líneas se vuelven más gruesas y oscuras. [ Guía de instalación | Guía de actualización | Solución de problemas | FAQ | Todos los productos ] Mejora tu análisis técnic
The Smart Liquidity Profile is color-coded based on the importance of the traded activity at specific price levels, allowing traders to identify significant price levels such as support and resistance levels, supply and demand zones, liquidity gaps, consolidation zones, Buy-Side/Sell-Side Liquidity and so on.  Smart Liquidity Profile allows users to choose from a number of different time periods including 'Auto,' 'Fixed Range,' 'Swing High,' 'Swing Low,' 'Session,' 'Day,' 'Week,' 'Month,' 'Quart
Volume by Price MT5
Brian Collard
3.6 (5)
The Volumebyprice.com Indicator for MetaTrader 5 features Volume Profile and Market Profile TPO (Time Price Opportunity). Volume and TPO histogram bar and line charts. Volume Footprint charts. TPO letter and block marker collapsed and split structure charts. Static, dynamic and flexible range segmentation and compositing methods with relative and absolute visualizations. Session hours filtering and segment concatenation with Market Watch and custom user specifications. Graphical layering, posit
Volatility Trend System - un sistema de comercio que da señales para las entradas. El sistema de volatilidad da señales lineales y puntuales en la dirección de la tendencia, así como señales para salir de ella, sin redibujar ni demoras. El indicador de tendencia monitorea la dirección de la tendencia a mediano plazo, muestra la dirección y su cambio. El indicador de señal se basa en cambios en la volatilidad y muestra entradas en el mercado. El indicador está equipado con varios tipos de alertas
TPA True Price Action indicator reveals the true price action of the market makers through 100% non-repainting signals strictly at the close of a candle! TPA shows entries and re-entries, every time the bulls are definitely stronger than the bears and vice versa. Not to confuse with red/green candles. The shift of power gets confirmed at the earliest stage and is ONE exit strategy of several. There are available now two free parts of the TPA User Guide for our customers. The first "The Basics"
Matrix Arrow Indicator MT5
Juvenille Emperor Limited
5 (14)
Matrix Arrow Indicator MT5   es una tendencia única 10 en 1 que sigue un indicador   100% sin repintado   de marcos temporales múltiples que se puede usar en todos los símbolos/instrumentos:   divisas ,   materias primas ,   criptomonedas ,   índices ,   acciones .  Matrix Arrow Indicator MT5  determinará la tendencia actual en sus primeras etapas, recopilando información y datos de hasta 10 indicadores estándar, que son: Índice de movimiento direccional promedio (ADX) Índice de canales de prod
Blahtech Supply Demand MT5
Blahtech Limited
4.54 (13)
Was: $299  Now: $99   Supply Demand uses previous price action to identify potential imbalances between buyers and sellers. The key is to identify the better odds zones, not just the untouched ones. Blahtech Supply Demand indicator delivers functionality previously unavailable on any trading platform. This 4-in-1 indicator not only highlights the higher probability zones using a multi-criteria strength engine, but also combines it with multi-timeframe trend analysis, previously confirmed swings
Order Block Hunter MT5
Noha Mohamed Fathy Younes Badr
5 (1)
Order block hunter indicator is the best indicator for  hunt the order blocks that area where there has been a large concentration of limit orders waiting to be executed Order blocks are identified on a chart by observing previous price action and looking for areas where the price experienced significant movement or sudden changes in direction .This indicator does that for you by using very complicated codes and helps you to take the best areas To buy and sell because it make marks at the best a
Auto Order Block with break of structure based on ICT and Smart Money Concepts (SMC) Futures Break of Structure ( BoS )             Order block ( OB )            Higher time frame Order block / Point of Interest ( POI )    shown on current chart           Fair value Gap ( FVG ) / Imbalance   -  MTF      ( Multi Time Frame )    HH/LL/HL/LH  -  MTF      ( Multi Time Frame )  Choch  MTF      ( Multi Time Frame )  Volume Imbalance     ,  MTF          vIMB Gap’s Power of 3 Equal High
**   All Symbols   x   All Timeframes   scan just by pressing scanner button ** *** Contact me after the purchase to send you instructions and add you in "Trend Reversal group" for sharing or seeing experiences with other users. Introduction: Trendlines are the most famous technical analysis in trading . Trendlines continually form on the charts of markets across all the different timeframes providing huge opportunities for traders to jump in and profit on the action. In the other hand,  The tre
Trend Hunter MT5
Andrey Tatarinov
5 (1)
Trend Hunter es un indicador de tendencias para trabajar en los mercados Forex, criptomonedas y CFD. Una característica especial del indicador es que sigue con confianza la tendencia, sin cambiar la señal cuando el precio perfora ligeramente la línea de tendencia. El indicador no se vuelve a dibujar; aparece una señal para ingresar al mercado después del cierre de la barra. Al avanzar a lo largo de una tendencia, el indicador muestra puntos de entrada adicionales en la dirección de la tendenc
Otros productos de este autor
Pin Bar
Alexey Topounov
5 (1)
This indicator shows Pin Bar candlestick pattern on the chart. The bearish pin bars have red color, the bullish pin bars have blue color. The indicator shows alert when Pin Bar candlestick pattern is formed. It's recommended to use it at timeframes H1 and higher. The best moment (strong signal) is when Pin Bar is formed close to the support/resistance level.
Synthetic Reverse Bar
Alexey Topounov
5 (1)
Synthetic Reverse Bar is an evolution of Reverse Bar indicator. It is well-known that candlestick patterns work best at higher timeframes (H1, H4). However, candlesticks at such timeframes may form differently at different brokers due to dissimilarities in the terminal time on the single symbol, while the history of quotes on M1 and M5 remains the same! As a result, successful patterns are often not formed at higher timeframes! Synthetic Reverse Bar solves that problem! The indicator works on M5
Soldiers Crows
Alexey Topounov
5 (2)
The indicator displays the "Three white soldiers and Three black crows" candlestick model on a chart. Three white soldiers are color in blue. Three black crows are colored in red. Input parameters: Max Bars - maximum number of bars calculated on the chart. Make Signal Alert - use alert. Type of pattern rules - use a strict model of determining the pattern (short lower shadows for the three soldiers, short upper shadows for the three crows), or a simplified model. Max Shadow Ratio - coefficient o
Reverse Bar
Alexey Topounov
The Reverse Bar indicator paints the reversal bars according to trade strategy, described by Bill Williams in "Trading Chaos. Maximize Profits with Proven Technical Techniques" book. The bearish reversal bar has red or pink color (red-stronger signal) The bullish reversal bar has blue or light blue color(blue - stronger signal) It is recommended to use it on hourly timeframe (H1) and higher.
HL D1 Move
Alexey Topounov
The indicator displays the dynamics of forming the daily range in the form of a histogram, and the average daily range for a specified period. The indicator is a useful auxiliary tool for intraday trades. Settings N Day - period for calculation of the daily range value. Level Indefinite - level of indefiniteness. Level Confidence - level of confidence. Level Alert - alert level. When it is crossed, the alert appears.
Angulation
Alexey Topounov
According to Bill Williams' trading strategy described in the book "Trading Chaos: Maximize Profits with Proven Technical Techniques" the indicator displays the following items in a price chart: 1.Bearish and bullish divergent bars: Bearish divergent bar is colored in red or pink (red is a stronger signal). Bullish divergent bar is colored in blue or light blue color (blue is a stronger signal). 2. "Angulation" formation with deviation speed evaluation. 3. The level for placing a pending order (
Bullish Bearish Volume is an indicator that divides the volume into the bearish and the bullish part according to VSA: Bullish volume is a volume growing during upward motion and a volume falling during downward motion. Bearish volume is a volume growing during downward motion and a volume falling during upward motion. For a higher obviousness it uses smoothing using MA of a small period. Settings: MaxBars – number of bars calculated on the chart; Method – smoothing mode (Simple is most preferab
Trading Sessions Pro is a trading session indicator with extended settings + the ability to install and display the custom period. Main Advantages: The indicator allows you to conveniently manage display of trading sessions on the chart. There is no need to enter the settings each time. Just click the necessary trading session in the lower window and it is highlighted by the rectangle on the chart! The indicator has two modes of defining the trading terminal's time offset relative to UTC (GMT)
VWAP es el precio promedio ponderado del volumen. Se calcula como suma de productos de volumen y precio dividido por el volumen total. Esta versión del indicador es universal ya que tiene tres modos de funcionamiento: Moving - en este modo el indicador es una media móvil. Pero a diferencia de la ordinaria SMA tiene intervalos más pequeños durante los movimientos de grandes! Pueden utilizarse bandas de desviación cuadrada de la misma manera que las Bandas de Bollinger. Período - en este modo los
Divergence MACD indicator shows price and MACD indicator divergence. The indicator is not redrawn! The algorithm for detection of price and MACD extremums has been balanced for the earliest entry allowing you to use the smallest SL order possible. The indicator displays all types of divergences including the hidden one, while having the minimum number of settings. Find out more about the divergence types in Comments tab. Launch settings: Max Bars - number of bars calculated on the chart. Indent
Вертикальная гистограмма объема -  отображает распределение объема по уровням. Гистограмма рассчитывается от объема ( реального или тикового), при этом объем соответствующий бару переносится на уровень H-L бара. Таким образом, при распределении объема за сутки по вертикали - формируются максимумы гистограммы показывающие области проторговки. Настройки индикатора: Timeframe Set -  период в пределах которого производится расчет. (рекомендуется D1) Step's - количество отображаемых периодов. Amplit
Hurst Fractal Index Фрактальный Индекс Херста -  показатель персистентности временного ряда При значении индикатора >0.5 временной ряд считается персистентным (тенденция сохраняется) При значениях индикатора явно < 0.5 временной ряд считается антиперсистентным (возможна смена направления движения) Для наглядности значения индекса усредняются периодом 2-3. Настройки индикатора: Max Bars -  глубина истории расчета (кол-во баров на графике для которых произведён расчет) Data from Timeframe - исполь
Filtro:
No hay comentarios
Respuesta al comentario
Versión 1.3 2017.09.04
Added the function of sending notifications to a mobile terminal.
Send Push Notification