Wave Trend Indicator
- Indicadores
- Qian Ha
- Versión: 1.6
- Actualizado: 9 agosto 2019
- Activaciones: 5
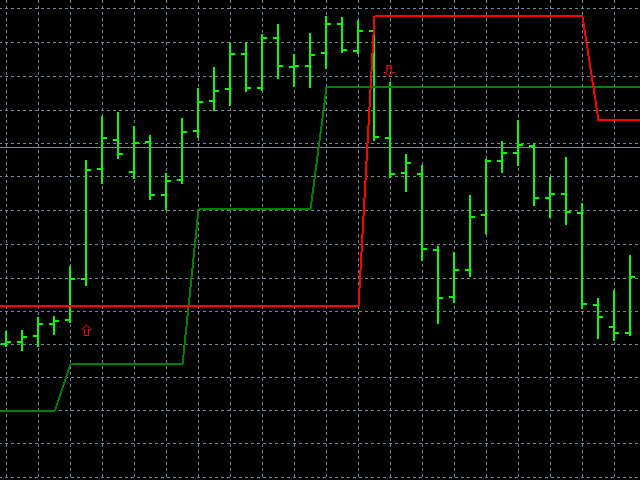
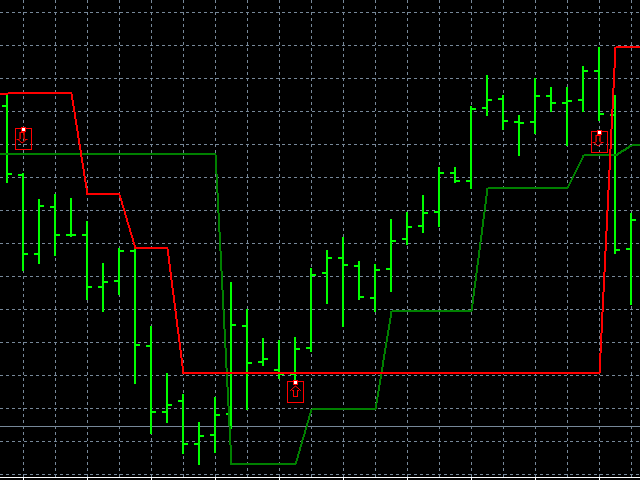
Los puntos altos y bajos de la banda,que se basan estrictamente en la teoría Dow,pueden utilizarse para distinguir las posiciones de apoyo y
resistencia,identificar los puntos de comienzo de las tendencias y detener el desgaste.
Ya sea que se trate de un comerciante de tendencias,de un comerciante de Líneas cortas en un día o de un comerciante de cuero cabelludo,creo
que este indicador le ayudarámucho.
Por ejemplo,cuando los precios van por debajo de la Línea Verde,la tendencia actual al vacío comienza,al igual que cuando los precios están
por debajo de la Línea Roja,la tendencia a la multiplicidad de puntos comienza,los puntos altos y bajos corresponden a la línea de
cierre efectiva correspondiente a la apertura,y el paso inverso correspondiente a la posición de contención.
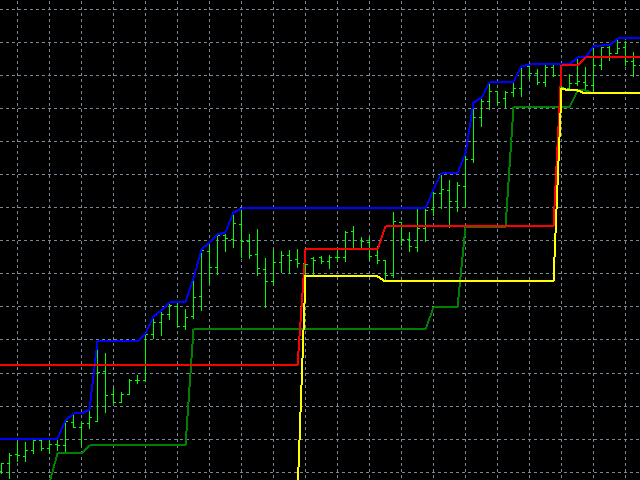
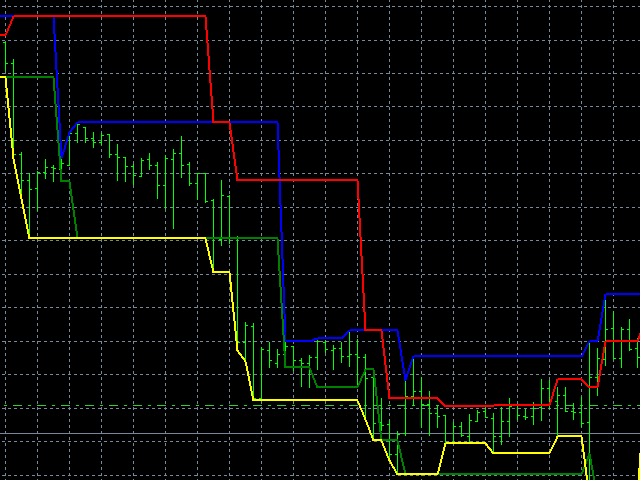
Naturalmente,la combinación de otras teorías,como los gráficos,los ríos,las tortugas marinas,etc.,puede aumentar la utilidad de los indicadores.
No voy a explayarme más aquí,puede encontrar otros usos interesantes de este indicador sobre la base de su estrategia comercial.
El indicador no tiene parámetros externos,no puede dar resultados inconsistentes según el número de columnas trazadoras,todas las
condiciones de uso son totalmente del mercado,es decir,lo que el mercado dice que hagamos,y seguiremos siempre los pasos del mercado.