Predictor of the ATR
- Indicadores
- Maxim Romanov
- Versión: 1.1
- Actualizado: 24 marzo 2020
Indicator Description
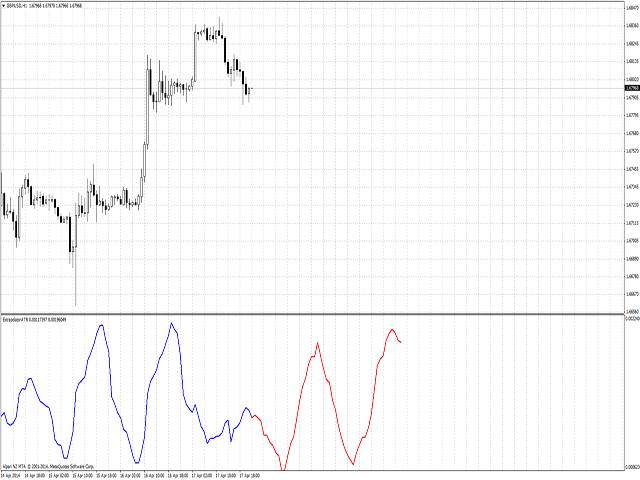
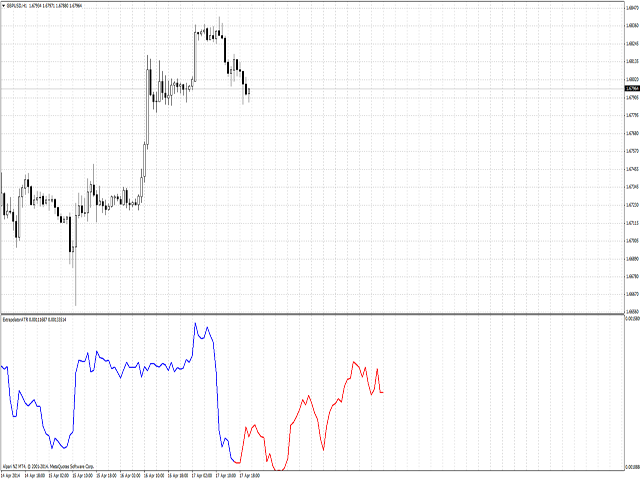
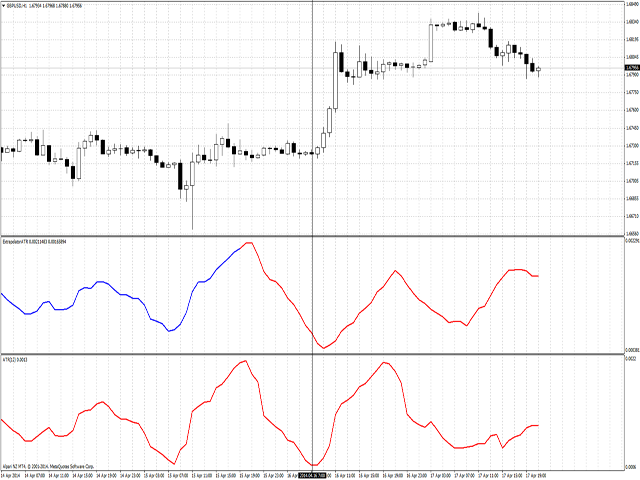
If you need to know future volatility for trading, this indicator is what you need! With the Predictor of the ATR you trading system will be more perfect. This indicator predicts future volatility, and does it quite well. Prediction accuracy is up to 95% at a distance of up to 5 bars into the future (on the period H1). The average forecast accuracy is about 85%, the number of predicted bars is limited by your imagination only.
There are five methods used for prediction. The first method is based on the spectral analysis, part of which is the Fourier transform, that is, it resolves the price series into harmonic components and then makes up prediction based on combined data. The rest are based on the linear prediction methods. The advantage of the first method is the high prediction accuracy, but calculation takes some time; the more bars you analyze, the longer the calculation will be. To get prediction using this method, it is advisable to take up to 2000 bars for analysis. If you want more depth, you can use methods of linear prediction; in this case the depth of analysis can be increased to 20,000-30,000 bars.
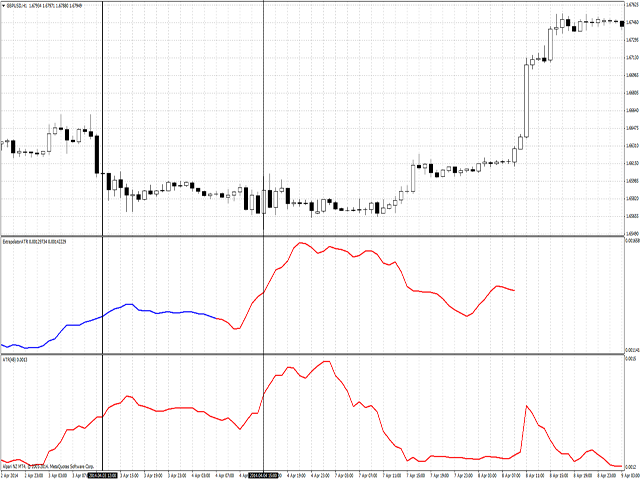
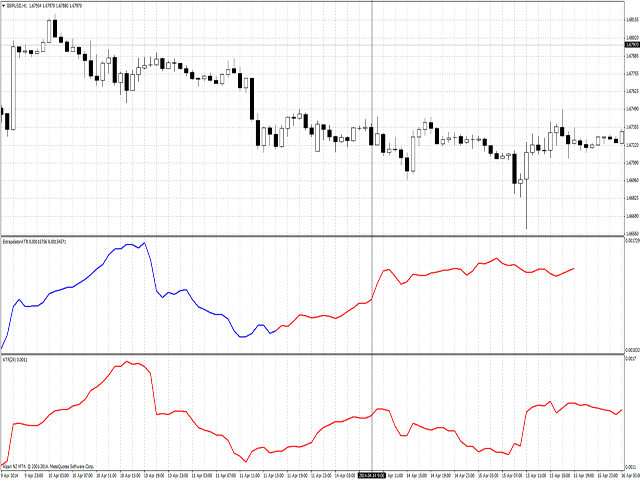
Based of this indicator, you can create a trading system that requires future volatility, or apply it to an existing trading system for forecasting future movements. This indicator is a handy tool when calculating Stop Loss and Take Profit, price channels, levels, ranges and other characteristics of the market, as well as when correcting the values of the indicators you use, if their values depend on the amplitude of price fluctuations. To see how the indicator behaved in the past, you can move prediction start a few bars back in the history using the LastBar function, in which you specify the number of bars by which you want to shift calculation to the past.
Explanation of Settings
- Method - prediction method (1- using Fourier transform, 2,3,4,5 - methods of linear prediction).
- LastBar - bar number at which you start the forecast (0 - current bar, any other bar means the number of bars in the past).
- PastBars - the number of bars used for analysis (for Fourier transform from 100 to 1000, a greater number will slow down; you may use more than 10,000 for other methods, but you'll have to wait).
- LPOrder- prediction accuracy from 0 to 1 (used only for linear prediction methods).
- FutBars - the number of bars to predict (should not exceed PastBars, better 2-3 times less than it).
- HarmNo - the maximum number of frequencies for Fourier transform (recommended 1/2 or 1/3 of PastBars, strongly affects calculation speed; the higher the number is, the slower it calculates. Should not exceed PastBars; if the value is large, a notification will appear on your screen).
- FreqTOL - prediction accuracy for Fourier transform (the higher the accuracy is, the slower it calculates. Recommended no more than 0.00000001).
- FreqMax- maximum number of iterations for frequencies convergence (can be left unchanged).
- BurgWin - a function for weighted averaging (for linear prediction methods; 0 = no weighted averaging, 1 = hamming method, 2 = parabolic method).
- P - ATR averaging period (recommended 12 for H1, 24 for М30, 48 for M15, 60 for М5; with 1 results are also good, so try different values).
- TF - the frequency of indicator recalculation, set a high value if you use high values of PastBars (is specified in minutes, use no less than 60 for H1 and increase the values if you use deeper historical data).
Operation Principles
Calculations can take from a few tenths of a second to several minutes or even tens of minutes or hours, depending on the history depth you use for analysis. If the terminal does not respond, then the indicator is being calculated; just wait a little. The indicator never causes terminal hang, it eventually will finish calculation. Do not use more than 3000 bars for Fourier transform (for other methods do not use more than 20,000), since this greatly slows down the process, or if you need a greater depth of analysis, use a high value of TF, e.g., 240, otherwise calculations will never be complete, since forecast is recalculated on each new bar. When PastBars is less than 500 for the first method, the indicator calculates fast enough. For other methods this value is up to 2000.

