SuperZigZag
- Indicadores
- Andriy Sydoruk
- Versión: 1.0
- Activaciones: 5
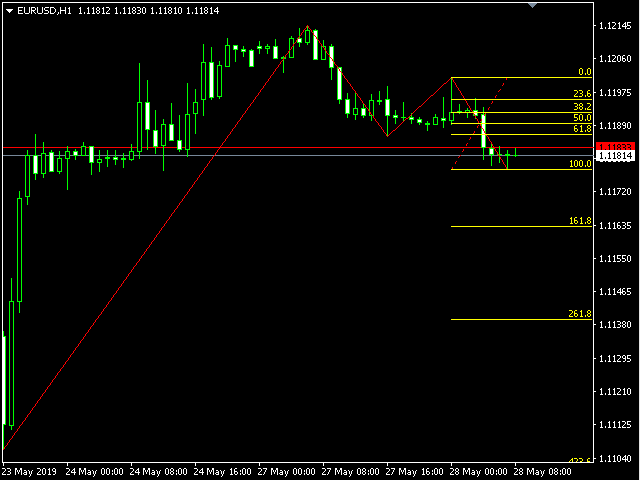
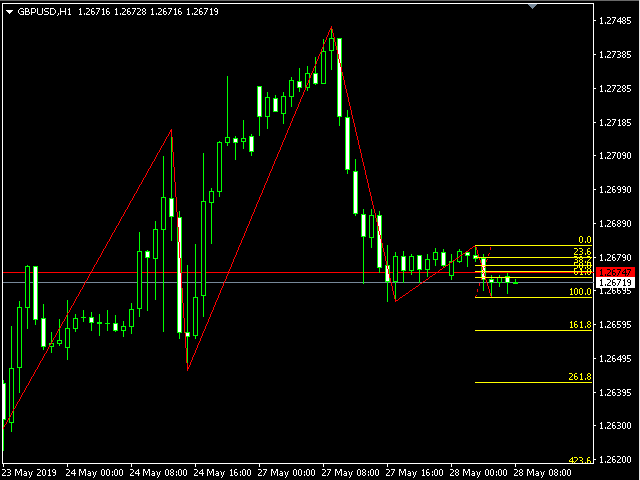
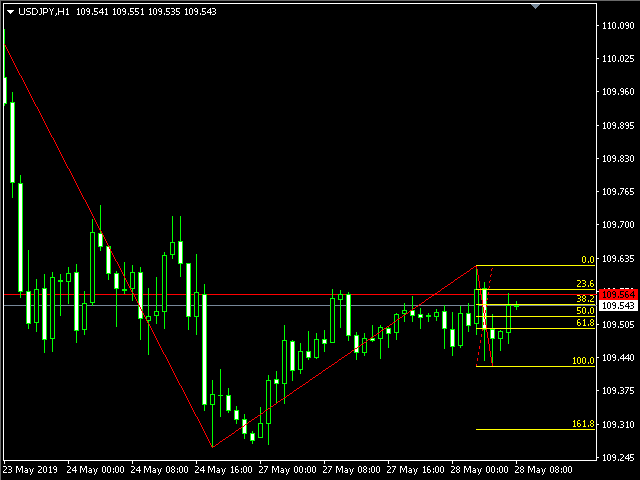
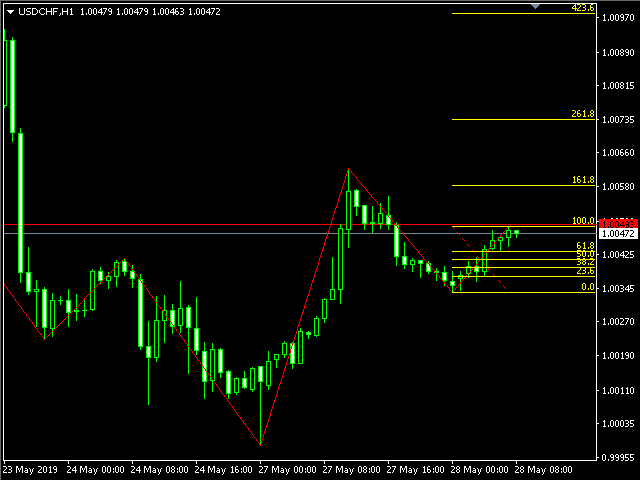
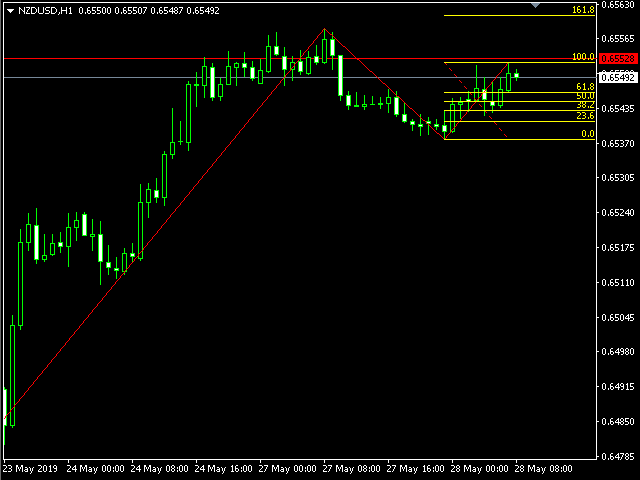
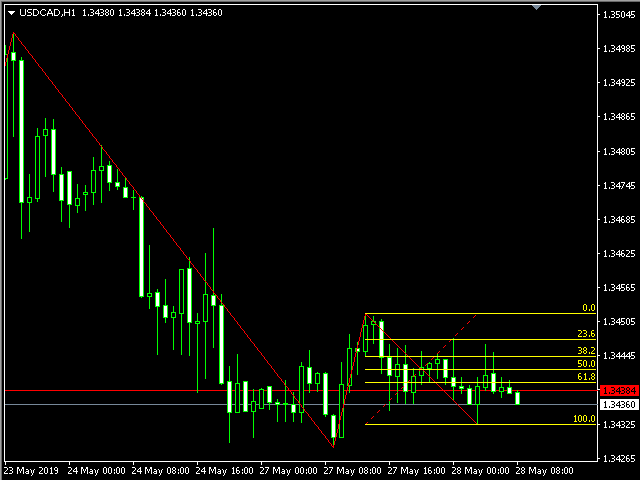
The SuperZigZag indicator is a signal indicator that is used to form trend lines connecting the main peaks and bases on the price chart. It graphically displays the most significant reversals and kickbacks of the market. Also among the objectives of this tool - cutting off noise that interferes with the consideration of the most significant movements.
Unlike most other technical indicators, ZigZag does not predict the future behavior of prices, but only reflects their behavior in the past. But in this interpretation we use the last, not yet formed signal of the indicator and form Fibonacci levels using it, which serves as an excellent signal to predict price reversal levels! Fibonacci levels began to be used by traders as soon as they noticed that the fluctuation of asset prices often repeats this numerical sequence.
How to read levels:
- On a scale of 0–100, the Fibonacci ratios are calculated as 23.6, 38.2, 50.0, 61.8 and 76.4%. These ratios are considered the main indicator (predicting possible future price movements), the price often rebounds from these levels.
- The indicator visualizes these levels on the chart of the price of an asset and provides an idea of its future movement.
- These lines can act as support or resistance levels, depending on whether currency pairs or stocks and indices in the stock market are traded above or below them.
- The more timeframe you work with, the clearer the levels will be triggered.
Standard options for ZigZag:
- ExtDeviation - The minimum number of points in percent between the lows or highs of the price of two adjacent candles.
- ExtDepth - The minimum number of candles, as the interval between extremes (highs or lows).
- ExtBackstep is the minimum number of candles between local extremes, in the area of which the second minimum / maximum will not be built if it is different from the previous one by the ExtDeviation indicator.

