StatChannel
- Indicadores
- Aleksey Ivanov
- Versión: 1.20
- Actualizado: 4 septiembre 2019
- Activaciones: 5
The principle of the indicator.
The StatChannel ( SC) indicator is a development of the Bollinger Bands indicator ( ВВ). BB is a moving average, on both sides of which two lines are drawn, separated from it by standard deviations std multiplied by the corresponding coefficient. At the same time, a moving average with an averaging period (2n + 1) bars is always obtained lagging behind n bars. Sliding std is also lagging behind on n bars, also calculated by (2n + 1) points. Such a strong delay reduces the efficiency of using BB.
The SC indicator is constructed in the same way as a classic BB, but only on the basis of the non-lagging moving average. Such a curve is calculated at points (Inf, n + 1], as a moving average at the segment (Inf, 0], where 0 is the number of the last bar, shifted back by n bars, and at the points of the segment [n, 0] it is estimated. The estimate is a curvilinear sector (sweeping confidence interval) in which the line of the non-lagging moving average is laid with a given confidence level. The non-lagging average is also surrounded by non-lagging std, which is determined at points at points (Inf, n + 1) in the same way as the non-lagging moving average, and at points of the segment [n, 0] - by a special algorithm that calculates the set of values std, that will be within the specified value of the confidence interval.
Trade using the SC indicator.
The SC indicator builds the distribution patterns of the current channels, into which all price fluctuations fit in heap and evenly. The figure of the middle line gives directly those values for the current price that fit into the given (in the settings) confidence level. The figures of the upper and lower lines describe the allowable variations in price fluctuations at the top and bottom, respectively.
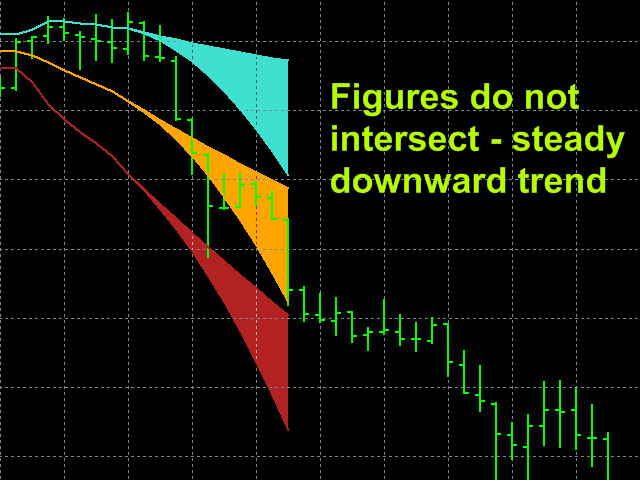
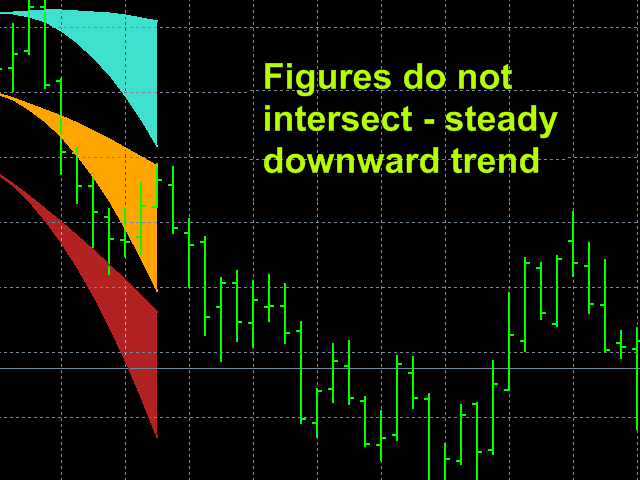
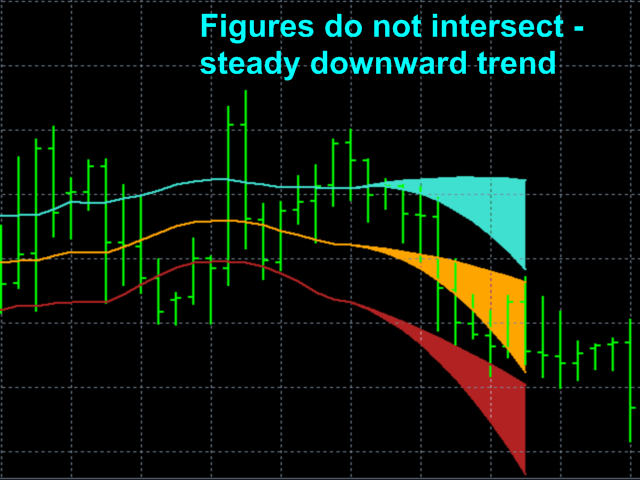
If the lower border of the figure sector of the middle component of the SC indicator moves to the up, then there is an upward trend. If the upper boundary of the curvilinear sector of the middle component of the SC indicator is oriented downwards, then there is a downward trend. In such cases, you can be confident in the correctness of the established trend direction with a given confidence level.
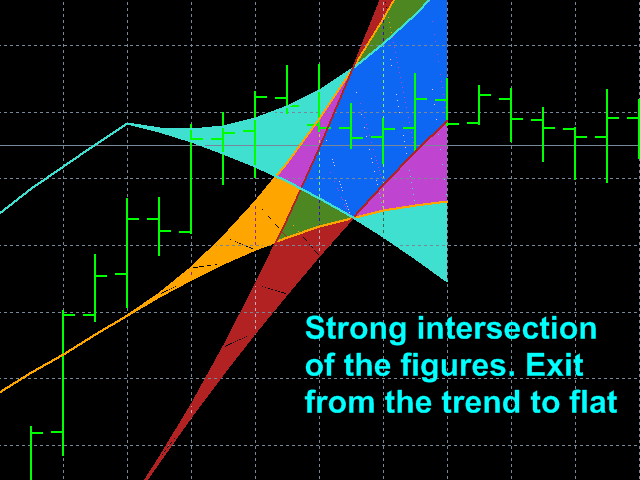
If the upper limit of the figure sector of the middle component of the SC indicator moves to the up, and the lower limit moves down, then there is a flat, which serves as a signal for closing trend positions.
If the colored sectors are clearly divided, then when the price approaches the upper edge of the upper line, you need to open a position on Sell, and when the price approaches the lower edge of the lower line on Buy, which, of course, needs to be done if there is a pronounced trend with regard to it directions, i.e. Do not play against this trend. Closing positions, on the contrary, Sell when the price drops to the figure sector of the lower line, and Buy when the price rises to the figure sector of the upper line.
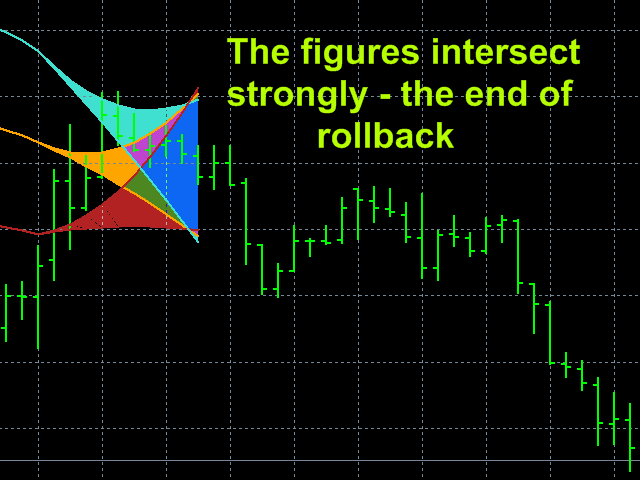
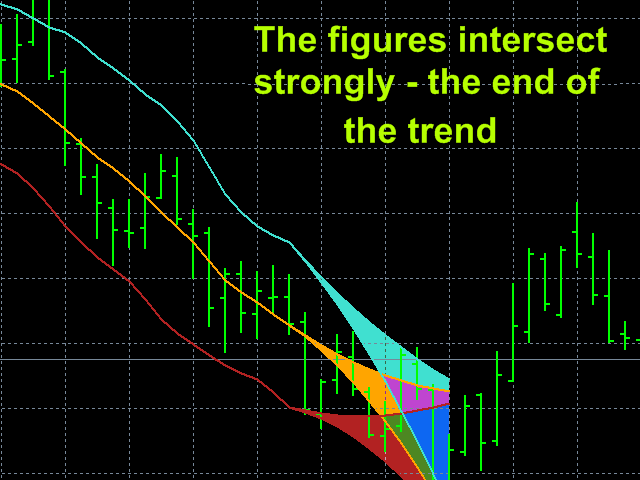
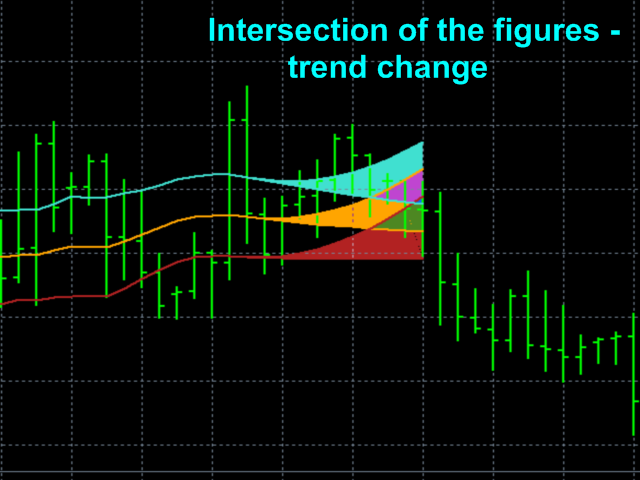
A strong overlap of sectors indicates a high probability of a change in trend.
Indicator settings.
- Price type - applied price. Values: Close price, Open price, High price, Low price, Median price ((high + low)/2 - default), Typical price ((high + low + close)/3), Weighted price ((high + low + 2*close)/4).
- The averaging method - averaging method. Values: Simple (default), Exponential, Smoothed, Linear weighted.
- The averaging period - averaging period. Values: any integer (21 default).
- Confidence probability Values: any real number from 0 to 0.999 (0.67 default).
- Channel width factor in STD - channel width factor in standard deviations. Values: any real number (1.0 default).
- Global shift - Global shift of the beginning of the indicator readings in bars. Values: any positive integer (0 default).
- Top line color – Color of the top line and figure sector. Default Turquoise.
- Midline color - Color of the midline and figure sector. Default Orange.
- Bottom line color - Color of the bottom line and figure sector. Default FireBrick.
- Paint over the confidence interval? - To color the figure sector of the confidence interval? Values: true (default), false.





Good indicator.